3160
Joint estimation of PDFF and T1 in abdomen with simultaneous B1+ correction at 3T1Shenzhen Institutes of Advanced Technology,Chinese Academy of Sciences, Shenzhen, China, 2Huazhong University of Science & Technology, Wuhan, China
Synopsis
T1 quantification is a valuable biomarker for liver function estimation and fibrosis staging. The presence of fat would confound the measurement of tissue T1. Chemical shift encoded fat-water separation combined variable flip angle (CSE-VFA) T1 mapping could remove the bias from fat signals, but B1 inhomogeneity would be a serious problem in abdominal applications. In this work, we proposed to combine the DREAM sequence with CSE-VFA, so that PDFF/T1/B1/R*2 could be simultaneously estimated. The deviation of the T1 values between the results with and without B1 correction verified the necessity of B1 measurements in the abdominal application.
Introduction:
Quantification of liver T1 has been a valuable biomarker for its potential use in estimation of liver function and fibrosis.[1-2] To remove the bias from short T1 fat signals, chemical shift encoded variable flip angle (CSE-VFA) T1 mapping has been proposed for liver T1 mapping[3], which enables the quantification of liver fat and T1 in the water component at the same time. However, the accuracy of VFA-T1 mapping approach relies on the accuracy of flip angle (FA), which could be a serious problem in abdominal applications at 3T due to the di-electric effect. In this study, we proposed to combine the DREAM sequence[4] with the CSE-VFA to jointly estimate the PDFF/T1/B1/$$$R_2^*$$$ in abdomen at 3T.Theory:
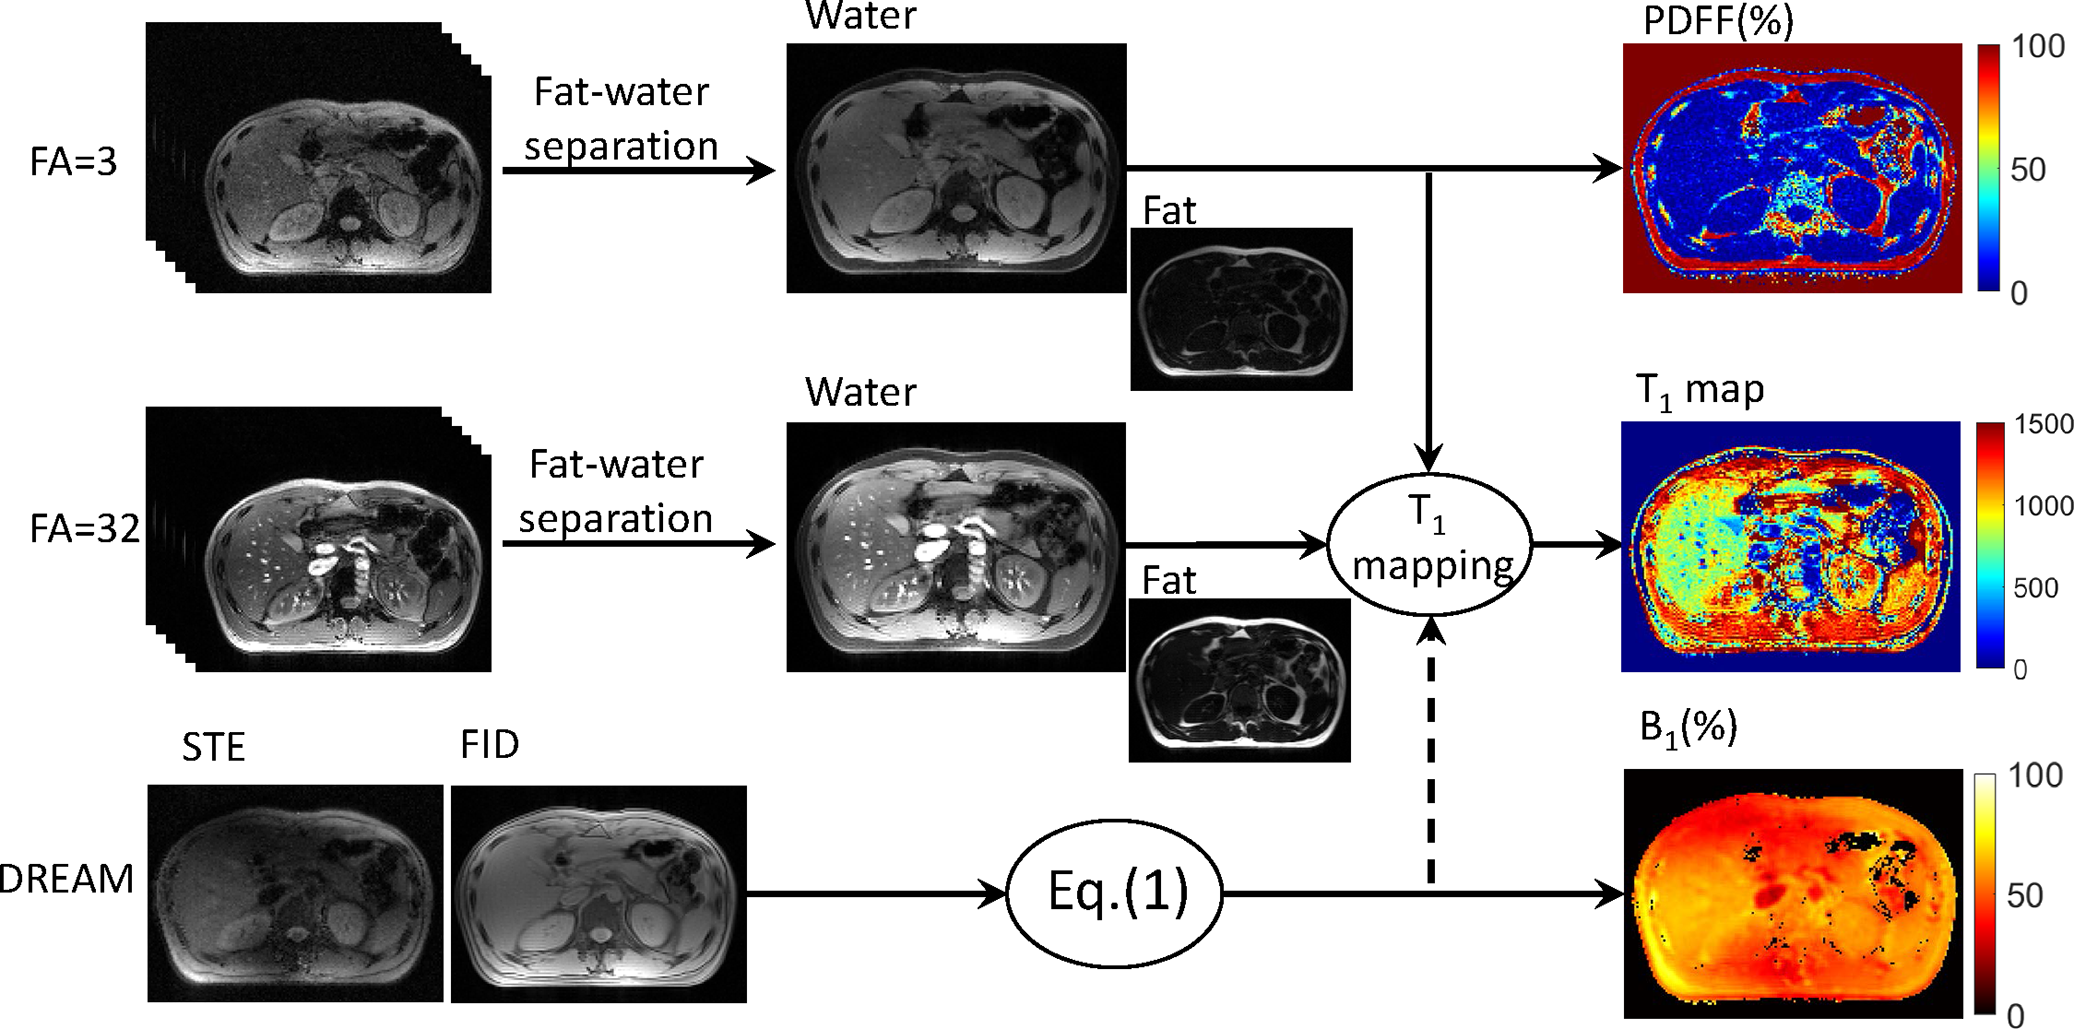
A CSE-VFA sequence to generate T1/PDFF/$$$R_2^*$$$ mapping within one breath-hold has been proposed by Tamada D et al.[3] However, the inhomogeneity of RF transmit (B1+) field wasn’t discussed in the work. The B1+ inhomogeneity could cause very serious problem for the VFA based T1 quantification methods. In this work, the rapid B1+ mapping approach DREAM sequence was applied to produce the actual flip angle (FA) map for the CSE-VFA sequence. To adapt to the abdominal application, where steatosis would occur in liver or pancreas, the stimulated echo (STE) and free induction decay (FID) signals were both strictly acquired at echo times when fat and water signals are in-phase. The actual flip angle was calculated by:$$$\alpha=\arctan\sqrt{|2I_{STE}/I_{FID}|} (1)$$$
where $$$I_{STE}$$$ and $$$I_{FID}$$$ were the signal intensities of FID and STE signals. The B1 inhomogeneity was given by $$$B_{1}=\alpha/\alpha_{D}$$$, where $$$\alpha_{D}$$$ is the reference flip angle used in the DREAM preparation pulse. The B1 map was then used for flip angle correction for the T1 mapping using DESPOT1 method in water components, which were separated from the multiple-echo data using the fat-water quantification method.[5] Defining $$$E_{1}=e^{-TR/T_{1}}$$$, T1 value for each pixel was transformed to a liner regression problem:
$$$\frac{S_{w}(n)}{\sin(B_{1}\cdot\theta_{n})}=\frac{S_{w}(n)}{\tan(B_{1}\cdot\theta_{n})}\cdot E_{1}+C (2)$$$
where $$$S_{w}(n)$$$ was the water component under flip angle $$$\theta_{n}$$$; $$$E_{1}$$$ was calculated by liner regression described by Deoni et al.[6]
The flowchart of the proposed method was shown in Fig.1.
Materials and methods:
All scans were performed at a 3.0T system (uMR790, Shanghai United Imaging Healthcare, Shanghai, China).A phantom was constructed with NiSO4, NaCl and pure water to test the accuracy of the T1 mapping of the proposed method. The T1 of the phantom was tested to be 101.1 ms using IR-FSE method. The multi-echo images under different FAs and DREAM was acquired with the same field-of-view (FOV) and imaging position. For DREAM sequence, $$$\alpha_{D}$$$ was set to $$$55^{\circ}$$$, and TE(FID) = TE(STE) = 2.24ms. Based on Deoni’s work, FAs for T1 mapping were optimized at $$$3^{\circ}$$$ and $$$32^{\circ}$$$ (for liver acquisition when TR = 17 ms). Multi-echo GRE images for a transversal slice was scanned. TR=17ms, TE = 2.51/4.04/5.57/7.71/8.63/10.16 ms, bandwidth = 700Hz/pixel, slice thickness = 10mm.
Two volunteers were recruited with informed consent under institutional review board approval in this study. The imaging protocol was used as same as mentioned above. A transverse slice of abdomen was scanned with slice thickness = 5mm with average = 3 for each FA. The volunteers were asked to keep breath-hold during the scan, and the whole scan was finished within 8 seconds.
Fat-water separation was applied on the acquired multi-echo images to obtain the water component and fat component using the TREE algorithm.[5] Water components of $$$3^{\circ}$$$ and $$$32^{\circ}$$$ images were combined with B1 maps to generate T1 map using Eq.(2). Proton density fat fractions (PDFF) and $$$R_2^*$$$ were calculated by the multi-echo GRE images under FA = $$$3^{\circ}$$$.
results:
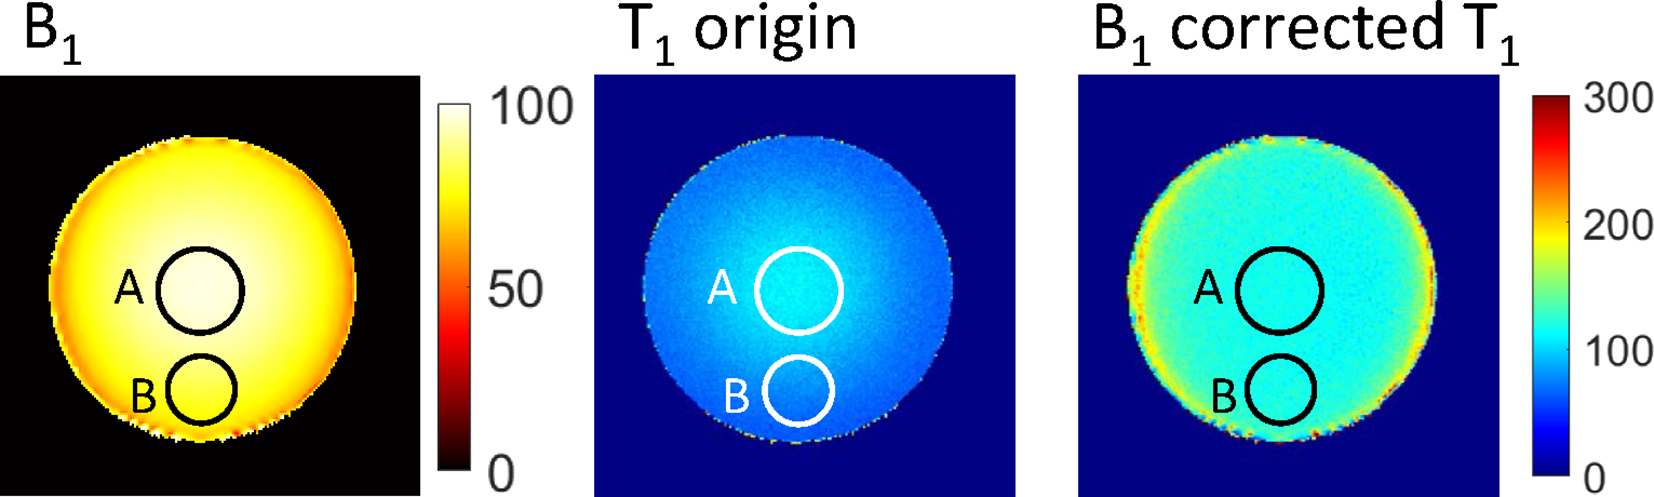
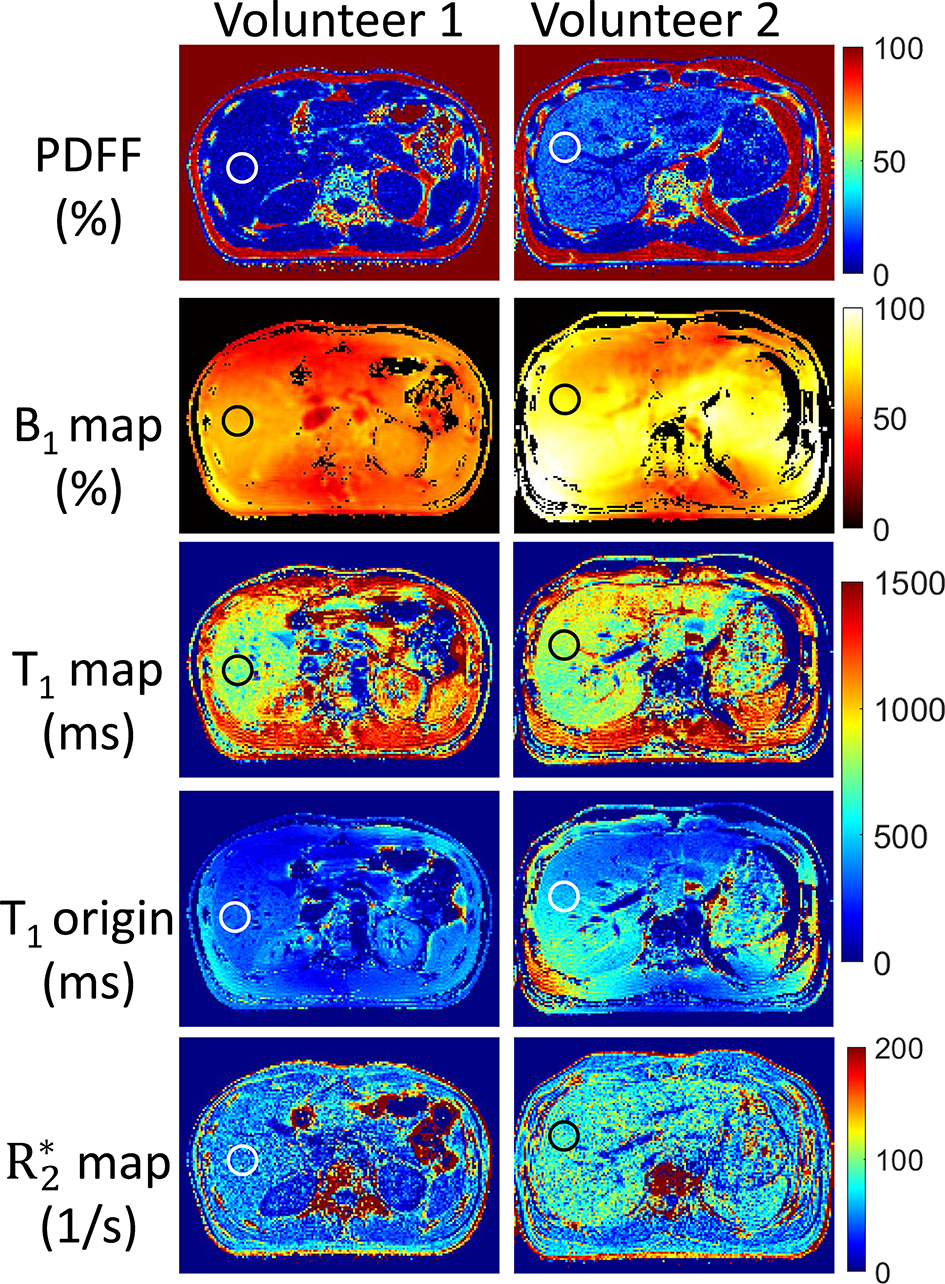
For the phantom experiment, B1 and T1 maps with and without B1 correction were shown in Fig.2. The mean B1 values (in percentage of the nominal angle) for region A and B were 96% and 80% respectively. For the T1 map without B1 correction, T1 value for central region A was $$$107.2\pm4.2ms$$$, while for the region B was $$$75.9\pm5.2ms$$$, showing great inhomogeneities. With B1 correction, the T1 values for region A and B became $$$116.0\pm4.3ms$$$ and $$$118.7\pm5.5ms$$$ respectively.PDFF, B1, $$$R_2^*$$$ and T1 maps with and without B1 correction in the abdomen of both volunteers were shown in Fig.3. For volunteer #1, the PDFF of the right liver lobe was $$$5.24\pm3.91$$$%, $$$R_2^*$$$ was $$$51.3\pm19.8s^{-1}$$$, and T1 value was $$$781.2\pm81.7ms$$$. The T1 value was close to normal values according to the reports by Ferenc E. Mozes et al.[7] For volunteer #2, mild steatosis and iron deposition was found in the liver, with PDFF = $$$22.2\pm4.4$$$%, $$$R_2^*$$$ was $$$76.7\pm17.9s^{-1}$$$ and $$$T_{1}=818.0\pm75.1ms$$$. Without B1 correction, the T1 values would be $$$322.1\pm30.8ms$$$ and $$$440.2\pm42.2ms$$$ for volunteer #1 and volunteer #2 respectively.
Discussion and conclusions:
In this work, B1 corrected T1 mapping approach was combined with fat quantification method to remove the bias from fat signals. T1, B1, PDFF and $$$R_2^*$$$ could be obtained simultaneously. Deviation of the T1 values with and without B1 correction verified the necessity of B1 measurements in the abdominal application. Further comparisons with other T1 reference methods like MRS[8] is ongoing in the future. Also, the scanning protocol will be adapted to 3D coverage over the whole liver within few breath-holds.Acknowledgements
No acknowledgement found.References
1. Banerjee, Rajarshi, et al. Multiparametric magnetic resonance for the non-invasive diagnosis of liver disease. J hepatology 2014:60(1): 69-77.
2. Pavlides, Michael, et al. Multiparametric magnetic resonance imaging predicts clinical outcomes in patients with chronic liver disease. J hepatology. 2016:64(2): 308-315.
3. Tamada, Daiki, et al. Multiparameter estimation using multi‐echo spoiled gradient echo with variable flip angles and multicontrast compressed sensing. Magn Reson Med. 2018; 80(4): 1546-1555.
4. Nehrke, Kay, and Peter Börnert. DREAM—a novel approach for robust, ultrafast, multislice B1 mapping. Magn Reson Med. 2012:68(5): 1517-1526.
5. Peng H, Zou C, Cheng C, et al. Fat-water separation based on Transition Region Extraction (TREE). Magn Reson Med. 2019;82(1):436–448.
6. Deoni, Sean CL, Brian K. Rutt, and Terry M. Peters. Rapid combined T1 and T2 mapping using gradient recalled acquisition in the steady state. Magn Reson Med 2003:49(3): 515-526.
7. Mozes, Ferenc E., et al. Mapping tissue water T1 in the liver using the MOLLI T1 method in the presence of fat, iron and B0 inhomogeneity. NMR in Biomedicine 2019:32(2): e4030.
8. Hamilton, Gavin, et al. In vivo breath‐hold 1H MRS simultaneous estimation of liver proton density fat fraction, and T1 and T2 of water and fat, with a multi‐TR, multi‐TE sequence. J Magn Reson Imaging. 2015:42(6): 1538-1543.
Figures