3158
A Novel 10-echo GESE multi-parametric sequence based on the EPIK readout for simultaneous quantification of T2 and T2*1Institute of Neuroscience and Medicine 4, Forschungszentrum Jülich, Jülich, Germany, 2Department of Neurology, RWTH Aachen, Aachen, Germany, 3Institute of Neuroscience and Medicine 11, Forschungszentrum Jülich, Jülich, Germany, 4JARA - BRAIN - Translational Medicine, Aachen, Germany
Synopsis
MRI sequences with a mixed GE/SE signal have been shown to be suitable for a wide range of applications due to the wide variety of accessible parameters. This work presents in vivo results of a 10-echo GESE sequence based on an EPIK readout to demonstrate the feasibility of whole-brain acquisitions below 5min, including T2 and T2* maps; comparison is made to reference methods. The generated images are artefact free and the T2*-maps correspond with conventional multi-echo GE results. The T2 values are higher than those from conventional SE, but are correctable using a reduced TE and improved fitting.
Introduction
Multi-echo acquisitions based on EPI readouts which combine pure SE, GE and mixed GE-SE signal have been used recently. Vessel size imaging1, CBV analysis and morphology maps2,3 have been performed with a 2-echo sequence and T2 and T2* mapping4 and compensation for off-resonance effects have been investigated5 based on a 5-echo GRASE6 sequence. Additionally, OEF calculations using a 6-echo MASE sequence7 and a 7-echo SAGE sequence with slice profile mismatch compensation have been published8. The potential of GE/SE acquisitions is underlined by these numerous applications. Multi-echo sequences based on an EPI readout are often plagued by relatively long TEs for late echoes, compromising the SNR and slice coverage for a given TR. To overcome the aforementioned issues, a previous work presented a five-echo GESE sequence based on an EPIK (EPI with a keyhole) readout9,10. The method was shown to outperform the standard EPI-based method in terms of SNR and slice coverage. In this work, five-echo GESE-EPIK was further developed to acquire 10 GESE echoes (i.e. two with GEs, six with mixed GESE and two with SE), enabling simultaneous quantification of T2 and T2*. The proposed method was verified with in vivo T2 and T2* maps at 3T and compared to reference methods.Methods
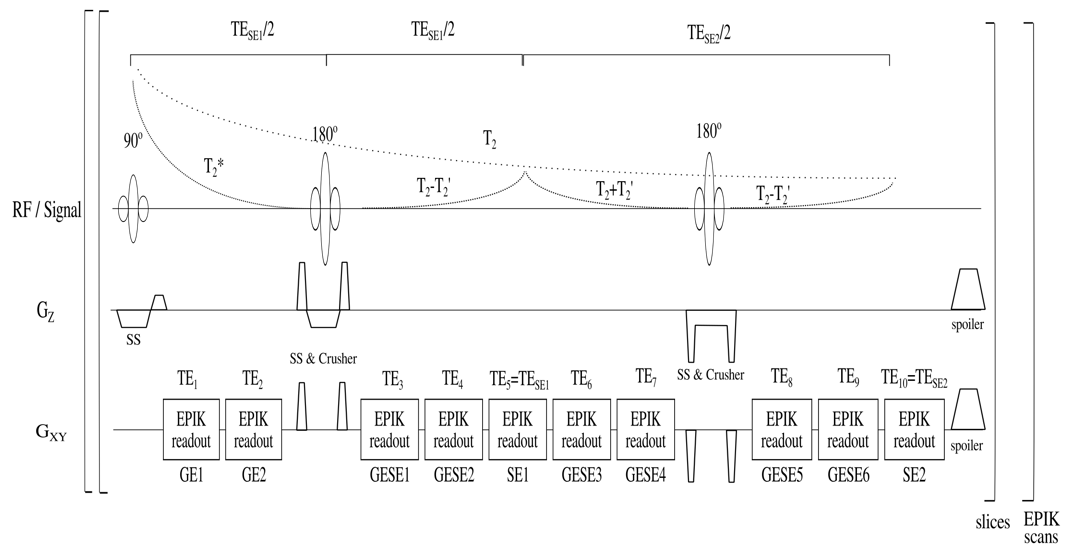
The 10-echo GESE sequence diagram including timing and signal decay is presented in Fig.1. The EPIK readouts were implemented with 128$$$\times$$$128 matrix-size, 1.9$$$\times$$$1.9$$$\times$$$3mm3 resolution, an EPIK multi-shot factor of 6 with 32 keyhole lines and GRAPPA11 factor 2 for image acceleration. Crusher gradient pairs with different amplitudes and opposite polarity were placed around both refocusing pulses to remove unwanted signal paths from stimulated echoes12. Spoiler gradients on all gradient axes were used and fat suppression was applied before each excitation. Three preparatory scans were used to reach a steady state. A volunteer (male; 25years) was scanned with TR=15s, TE=17,$$$~$$$39,$$$~$$$81,$$$~$$$103,$$$~$$$125,$$$~$$$147,$$$~$$$169,$$$~$$$204,$$$~$$$226,$$$~$$$250ms, TA=3:15min and 20 slices. Another data set (male; 28 years) was acquired with the same TEs, but with TR=0.8s, a TA=26s and 4 slices. T2 and T2* maps were calculated by fitting the 5th and 10th echoes for T2 and 1st and 2nd for T2*. To evaluate the T2* maps, a conventional multi-echo (64) gradient-echo sequence13 was employed to derive reference T2* maps. The employed TEs range from 4.10 to 91.04ms with echo spacing of 1.38ms, 4 slices and TR=0.5s, yielding TA=1:29min. The reference T2 maps were calculated from 5 single-echo SE measurements obtained at TE=30,$$$~$$$80,$$$~$$$125,$$$~$$$180,$$$~$$$250ms, thus covering the same TE range as 10-echo GESE-EPIK but with TA=13:10min. All maps were fitted with a least square algorithm, assuming the following signal relation:$$S(t)=S_{0}~e^{-{t}/{T_{2}^{*}}}$$ $$S(t)=S_{0}~e^{-{t}/{T_{2}}}$$
Results
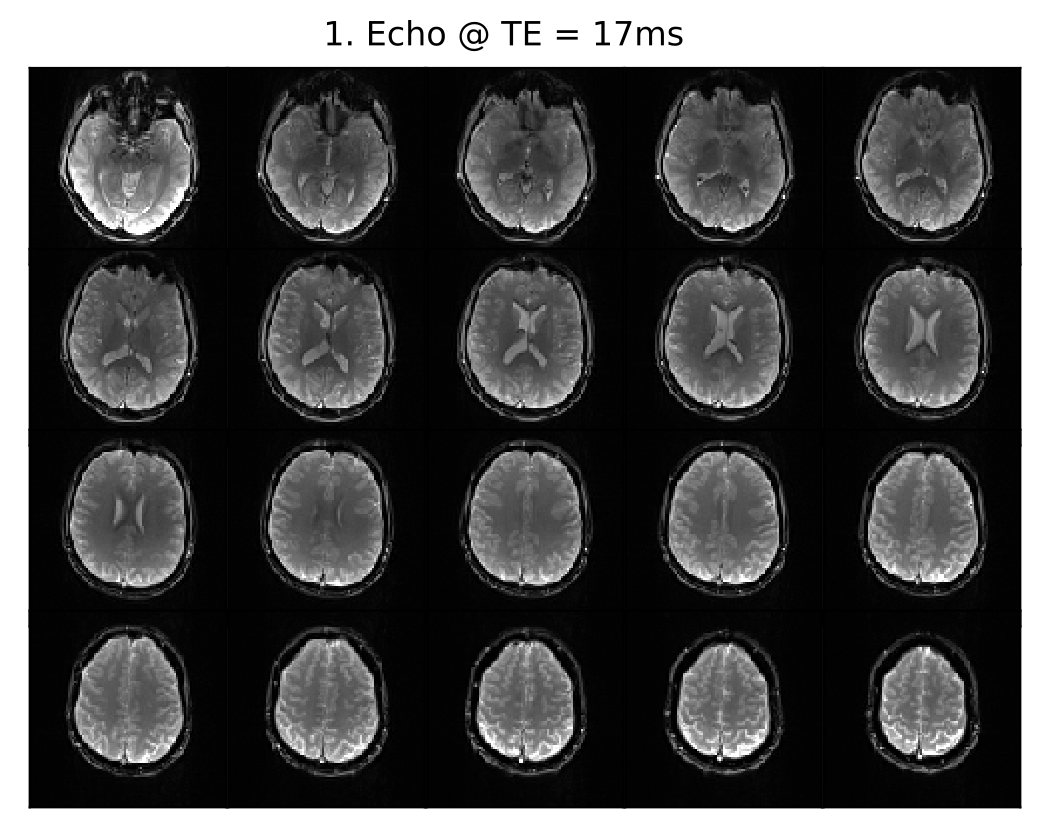
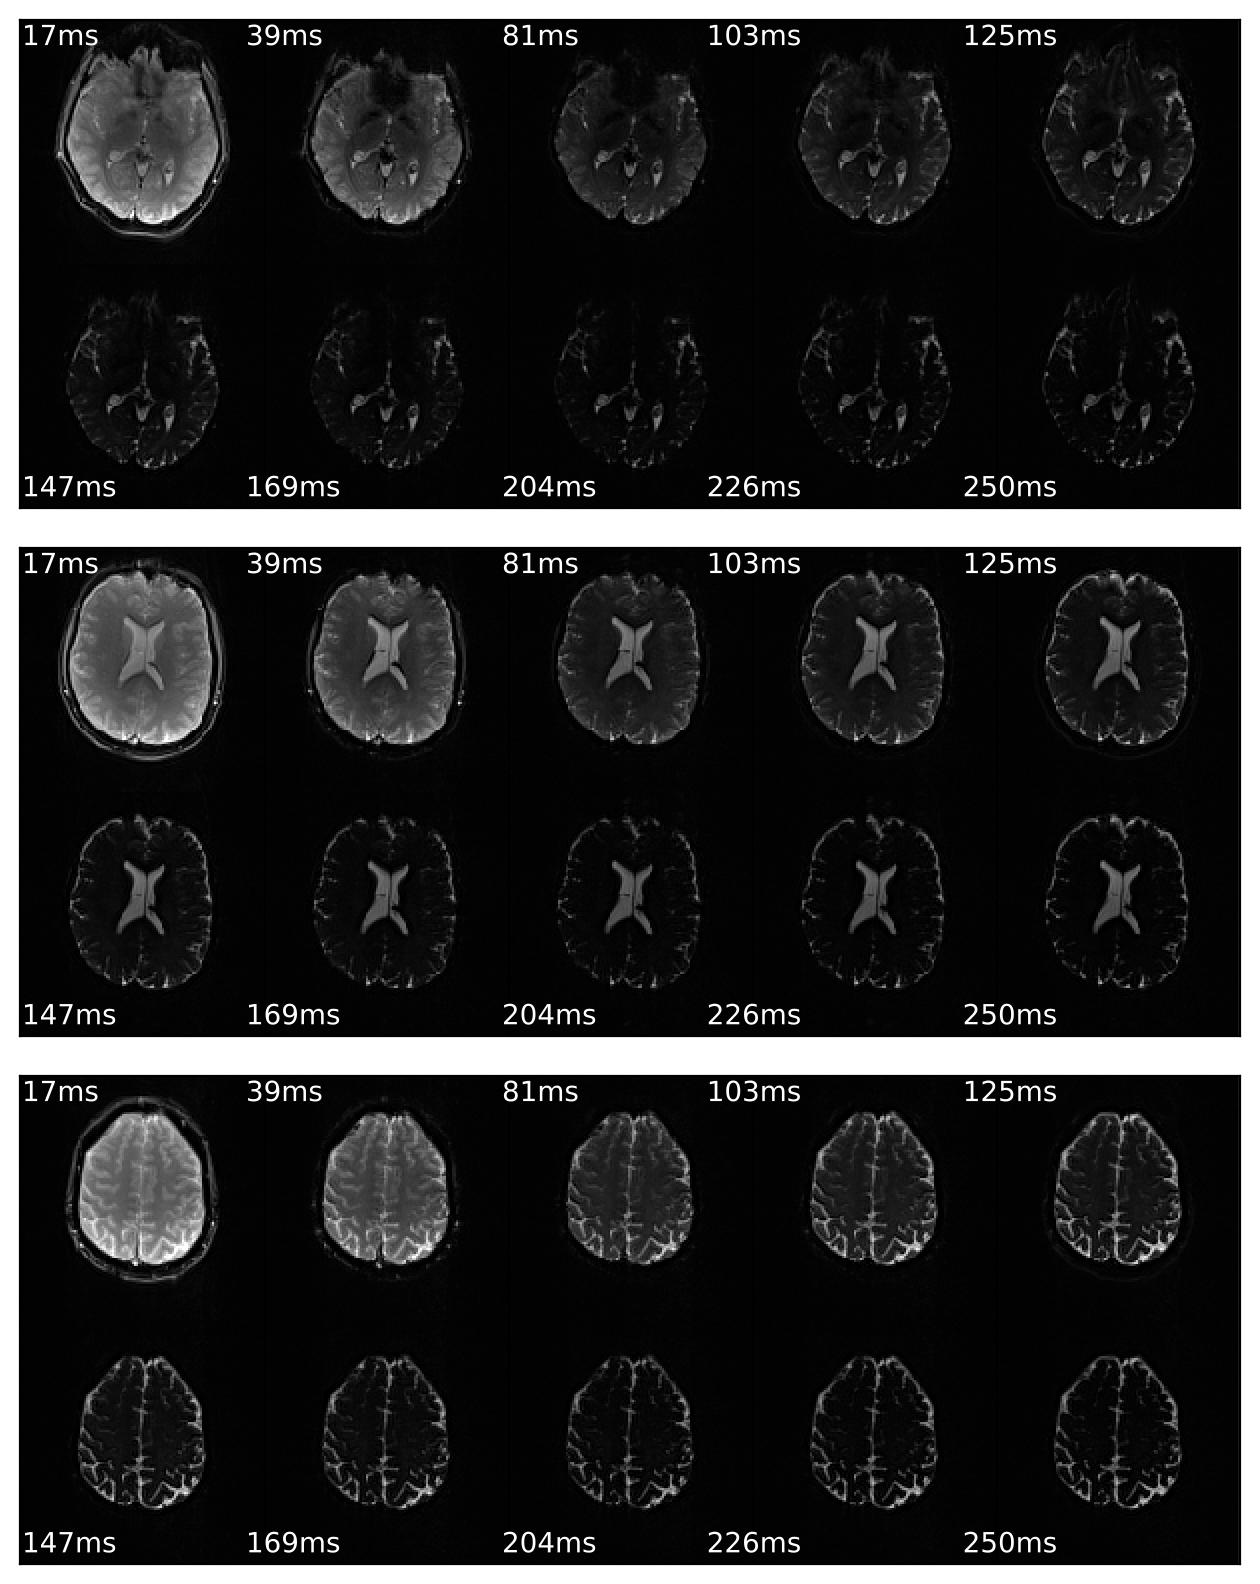
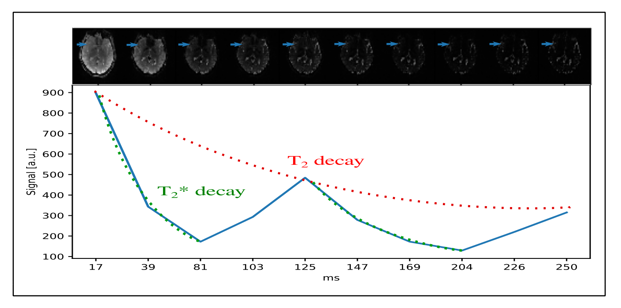
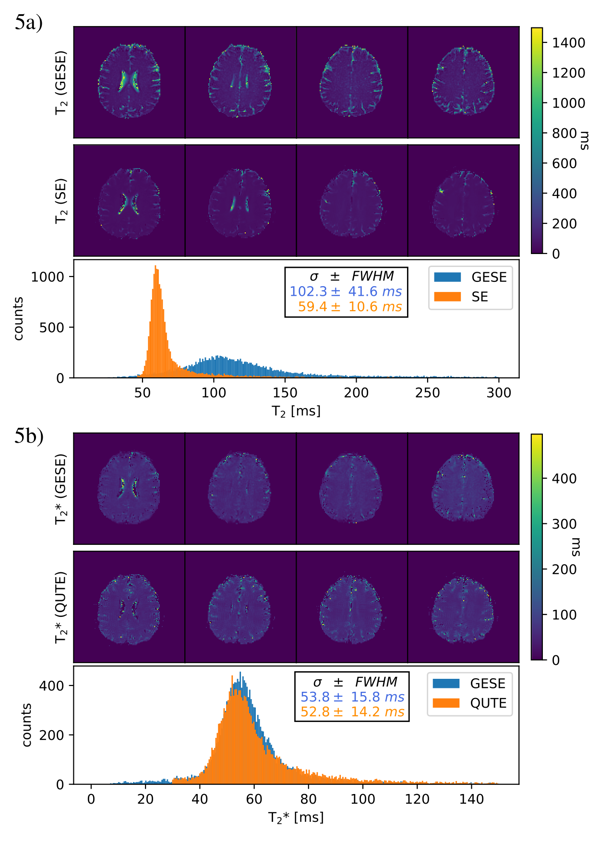
Fig.2 demonstrates the brain coverage capability of 10-echo GESE-EPIK sequence, showing 20 slices acquired at TE=17ms. The time course for all ten acquired echoes, for three exemplary slices, is shown in Fig.3. The overall signal decay as well SNR enhancement at the SE locations (5th and 10th), is evident. A closer look at the exact decay is depicted in Fig.4, showing the signal of a single voxel as a function of TE. The expected behavior of the combined T2 and T2* decay and local maxima at the SE positions is confirmed. Fig.5 depicts the resulting T2 and T2* maps of 4 different slices for 10-echo GESE-EPIK and the corresponding reference method including histogram distribution of the obtained T2 or T2* maps. All images were masked to exclude background noise and the skull. In the case of T2*, the histogram distribution from the two methods is nearly identical and is observed to have similar T2* ranges as reported in previous literature, considering the fact that the reported T2* values for WM/GM are 48.8/49.3ms14. The T2 values resulting from the proposed method are higher and are distributed more widely compared to the reference method and the literature (83.9/85.6ms for WM/GM14).Discussion and Conclusion
The suitability of 10-echo GESE-EPIK for larger brain coverage has been demonstrated and the resulting decay curves are in good agreement with the expected complex decay behaviour of T2 and T2*. Whole-brain coverage was not shown, however, the sequence parameters allow 80 slices within 5min for the shortest TR, yielding a coverage of 24cm. Initial T2 and T2* maps were extracted and compared with reference methods. T2* results are in good agreement with the literature and reference method, while T2 values are overestimated. This mismatch is likely to be caused by the larger TE for the second SE at 250ms, where most of the WM/GM signal is already decayed. The desired TE reduction will be facilitated by a higher GRAPPA factor and the use of the partial Fourier technique. Furthermore, the fitting routines were based on 2-point least-square fitting and thus, improvements in robustness and accuracy are expected to be obtained by including matching pursuit15 algorithms to fit the complex dependencies of all the 10 acquired echoes. It is anticipated that the sequence could also be employed for the quantification of other interesting parameters such as vessel size, OEF and T2’.In conclusion, 10-echo GESE-EPIK is a very useful technique for multi-parametric imaging of the brain, yielding T2 and T2* maps; the acquired information can easily facilitate T2’/OEF mapping, as well as vessel-size imaging (with CA injection).
Acknowledgements
Hereby, I would like to show my gratitude to my supervisor Prof. N.J. Shah and coauthor Dr. S. Yun for their expertise and assistance. Next to this, we thank our colleagues, the MTAs and the organizational team from the INM-4 institute for their support.References
1. V. G. Kiselev et al., (2005), ‘Vessel Size Imaging in Humans’, Magnetic Resonance in Medicine 53:553–563
2. K. Donahue et al., (1998), ‘Simultaneous Gradient-Echo/Spin-Echo EPI of Graded Ischemia in Human Skeletal Muscle’, JMRI 8:1106-1113
3. K. Donahue et al., (2000), ‘Utility of Simultaneously Acquired Gradient-Echo and Spin-Echo Cerebral Blood Volume and Morphology Maps in Brain Tumor Patients’, Magnetic Resonance in Medicine 43:845– 853
4. K. Oshio et al., (1991), ‘GRASE (Gradient- and Spin-Echo) Imaging: A Novel Fast MRI Technique’, Magnetic Resonance in Medicine 20:344-349
5. R. D. Newbould et al., (2007), ‘Simultaneous T2 and T2* dynamic susceptibility contrast perfusion imaging using a multi-echo parallel imaging approach’, Proc. Intl. Soc. Mag. Reson. Med. 15
6. H. Schmiedeskamp et. al., (2009), ‘Multiple gradient- and spin-echo EPI acquisition technique with z-shimming to compensate for susceptibility-induced off-resonance effects’, Proc. Intl. Soc. Mag. Reson. Med. 17
7. Yayan Yin, Yaoyu Zhang, and Jia-Hong Gao, (2018), ‘Dynamic Measurement of Oxygen Extraction Fraction Using a Multiecho Asymmetric Spin Echo (MASE) Pulse Sequence’, Magnetic Resonance in Medicine 80:1118–1124
8. H. Schmiedeskamp et al., (2012), ‘Compensation of Slice Profile Mismatch in Combined Spin- and Gradient-Echo Echo-Planar Imaging Pulse Sequences’, Magnetic Resonance in Medicine 67:378–388
9. M. Zaitsev, K. Zilles, N.J. Shah, (2001), ‘Shared k-space echo planar imaging with keyhole’, Magnetic Resonance in Medicine 45(1):109-17
10. N.J. Shah, N.A. da Silva,S. Yun, (2019), ‘Perfusion weighted imaging using combined gradient/spin echo EPIK: Brain tumour applications in hybrid MR-PET.’, Hum Brain Mapp.
11. M.A. Griswold, P.M. Jakob,R.M. Heidemann et al., (2002), 'Generalized autocalibrating partially parallel acquisition (GRAPPA)’, Magnetic Resonance in Medicine 47:1202-1210
12. M. A. Bernstein, K. F. King and X. J. Zhou, (2004), ‘ Handbook of MRI pulse sequences’, Elsevier.
13. T. Dierkes,H. Neeb, N.J. Shah, (2004),‘Distortion correction in echo-planar imaging and quantitative T2* mapping’, International Congress Series 1265:181-185
14. A.M. Oros-Peusquens, M. Laurila, N.J. Shah, (2008), ‘Magnetic field dependence of the distribution of NMR relaxation times in the living human brain’, Magnetic Resonance Mater Phy 21:131–147
15. G. M. StCphane and Zhifeng Zhang, (1993), ‘Matching Pursuits With Time-Frequency Dictionaries’, IEEE TRANSACTIONS ON SIGNAL PROCESSING VOL 41, NO 12
Figures