3156
Low Field MR Thermometry with a Fast, Interleaved Look-Locker based T1 Mapping Approach.1Laboratory for Adapatable MRI Technology (AMT lab), Dpt of Biomedical Engineering, University of Basel, Basel, Switzerland, 2Medical Image Analysis Centre (Miac AG), Basel, Switzerland
Synopsis
Low field scanners present several advantages for interventional applications, however no standard method has yet arisen from temperature mapping. In this study we investigated the relationship between T1 and temperature at 0.1 T. MR images of four water phantoms, characterised by different T1, were acquired at different temperatures using a multi-slice FLASH sequence based on Look-Locker. Pixel-wise estimation of T1 relaxation through data fitting showed a growing trend with temperature. In light of the large number of time points, compromising SNR by a factor of 2 produced similar results for an almost 4 times faster acquisition.
Introduction
Interventional MRI requires fast sequences for quasi real-time monitoring and guidance of therapy and/or surgery. Conventional high field scanners present some limitations in terms of access to the patient, and require specific care regarding MR compatibility of surgical instruments and monitoring devices. Additionally, metallic catheters and implants can also lead to heat deposition and cause severe susceptibility artefacts. MR systems operating at low field can overcome these constraints, naturally benefiting from longer T2* and increased T1 dispersion1.However, while temperature mapping in thermal therapies through proton resonance frequency shift is well established for high magnetic fields2, its use at low field regimes is less likely to succeed mainly due to poor spectral resolutions. T1 at low field was shown to correlate well with temperature3, yet fast T1 mapping sequences at this field regime have not been explored.
Here we provide a proof-of-concept study to measure T1 dispersion at low field as a function of temperature using a fast, custom developed, Look-Locker-based FLASH sequence.
Methods
T1 of four vials filled with water doped at different CuSO4 concentrations was characterised at room temperature using a spectroscopic IR sequence. All vials were placed inside a sealed container connected to a water tank. Temperature was regulated and monitored using a temperature-controlled heating plate. An immersed pump was used to circulate water and regulate temperature inside of the sealed container, surrounding the four-vial phantom (Fig. 1).An interleaved, multi-slice sequence based on the Look-Locker approach was implemented for T1 mapping4 (Fig. 2). The acquired dataset consisted of a stack of 50 images (in-plane resolution = 5 x 5 mm2, slice thickness = 30 mm, slice gap = 0.5 mm, matrix size = 32 x 25 x 3) corresponding to different inversion times spaced by 98.2 ms (TR/TE = 5000 ms/9.1 ms) (Fig. 3a). Two datasets were acquired, decreasing the number of averages from 15 to 4, hence reducing the acquisition time from 31 min to 8 min and the SNR by a factor of 2.
MR images were acquired at 0.1 T (4.2 MHz), at three different temperature points (23, 35 and 50 °C) in a resistive biplanar MRI system (Bouhnik S.A.S., France). For each temperature, a pixel-wise fit of the images obtained at the different inversion times was carried out using the following equation5:
$$M(t) = M_0^* - (M_0+M_0^*)e^\left(-\frac{t}{T_1^*}\right)$$
where T1 is the apparent relaxation time, -M0 is the inverted magnetisation and M0* is the steady-state magnetisation. T1 maps were retrieved from a combination of the three free parameters, as shown in the next equation:
$$T_1 = T_1^*\frac{M_0}{M_0^*}$$
Mean T1 and standard deviation were calculated and used for further analyses.
Results
Spectroscopic measurements were only run at one temperature point (here, room temperature of 23°C), yet the T1 maps reconstructed from imaging show a good agreement with spectroscopy (Fig. 3b). The T1 maps allowed identification of the four vials and a clear separation from the surrounding water (Fig. 4). A pixel-wise confidence map denoting the quality of the fit is also presented. A direct relationship between T1 and temperature was observed, with a higher growth rate associated to longer T1s (Fig. 5a). Comparable T1 estimations were obtained using the faster sequence with less signal averages (Fig. 5b).Discussion
The presented results have shown the possibility to measure T1 dispersion as a function of temperature in phantoms at 0.1 T. While three out of four phantoms display the linear relationship expected from the literature3, the data associated to the phantom with longest measured T1 suggest a higher order polynomial trend. Further investigation would require the use of a higher number of temperature points. Despite sacrificing SNR, the 8-minute acquisition produced T1 estimations comparable to those obtained with the 31-minute scan. The high number of inversion times, in fact, contributes to a successful fitting of the T1 recovery curves. This result opens up a scenario where data quality could be compromised in favour of a larger number of recovery points. We envisage that this direction, along with additional acceleration factors, could lead towards acquisition times comparable to those used with high-field scanners for this particular application.Conclusion
In this proof-of-concept study, we have shown the capability of estimating T1 dispersion as a function of temperature in calibrated phantoms. The perspective of acquiring temperature maps in times comparable with those used in clinical settings provides a further push towards the employment of low field scanners for interventional MRI.Acknowledgements
No acknowledgement found.References
1. Fischer, Helmut W., et al. "Nuclear relaxation of human brain gray and white matter: analysis of field dependence and implications for MRI." Magnetic resonance in medicine 16.2 (1990): 317-334.
2. Kuroda, Kagayaki. "Non-invasive MR thermography using the water proton chemical shift." International Journal of Hyperthermia 21.6 (2005): 547-560.
3. Nelson, T. R., and S. M. Tung. "Temperature dependence of proton relaxation times in vitro." Magnetic resonance imaging 5.3 (1987): 189-199.
4. Deichmann, Ralf. "Fast high‐resolution T1 mapping of the human brain." Magnetic Resonance in Medicine: An Official Journal of the International Society for Magnetic Resonance in Medicine 54.1 (2005): 20-27.
5. Deichmann, R., and A. Haase. "Quantification of T1 values by SNAPSHOT-FLASH NMR imaging." Journal of Magnetic Resonance (1969) 96.3 (1992): 608-612.
Figures
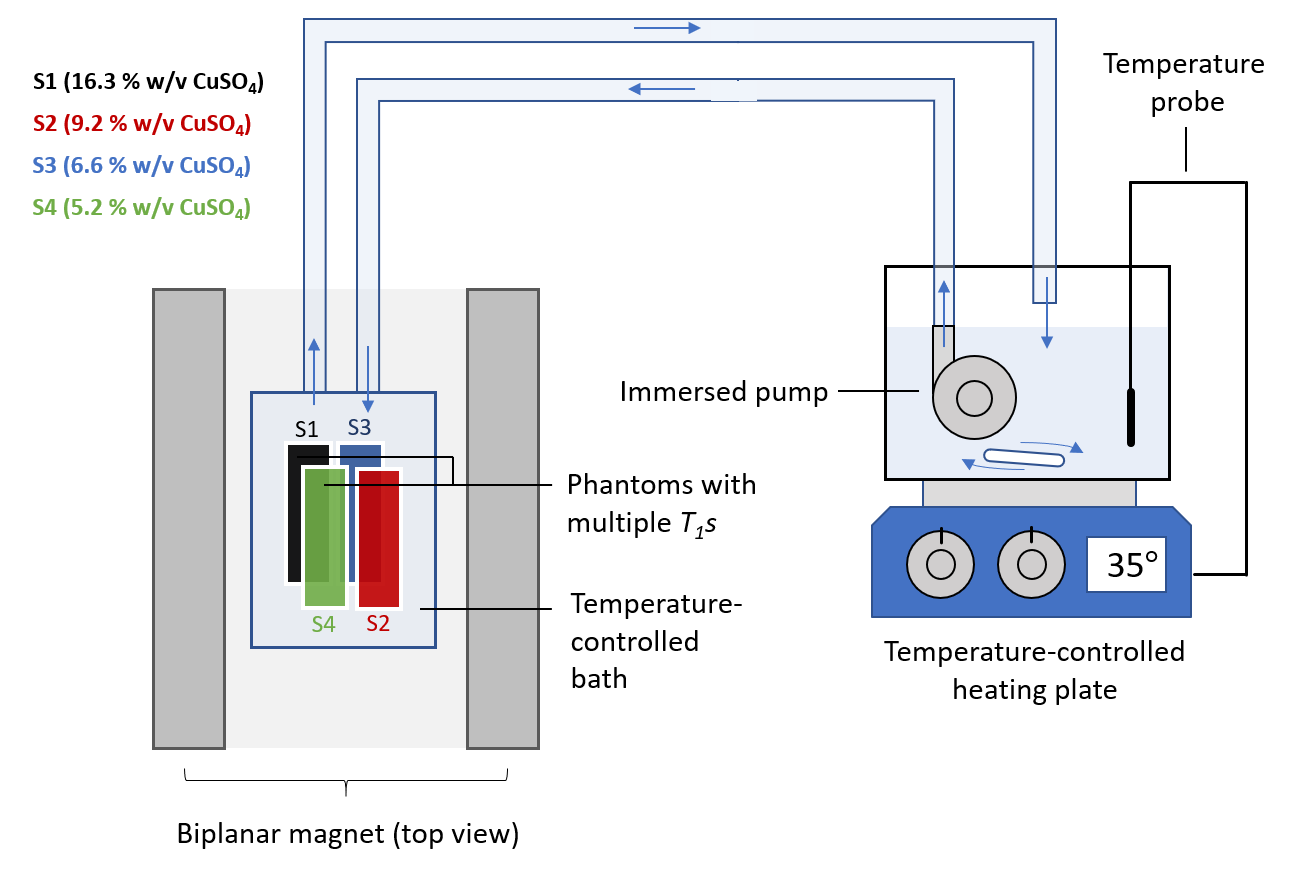
Figure 1: Experimental set up to probe T1 as a function of temperature.
A phantom consisting of four vials of doped water was inserted inside a temperature-controlled bath. A pump was employed to circulate water through the phantom. The temperature of the water was controlled through a heating plate. MR images of the phantom were acquired using a biplanar resistive magnet operating at 0.1 T.
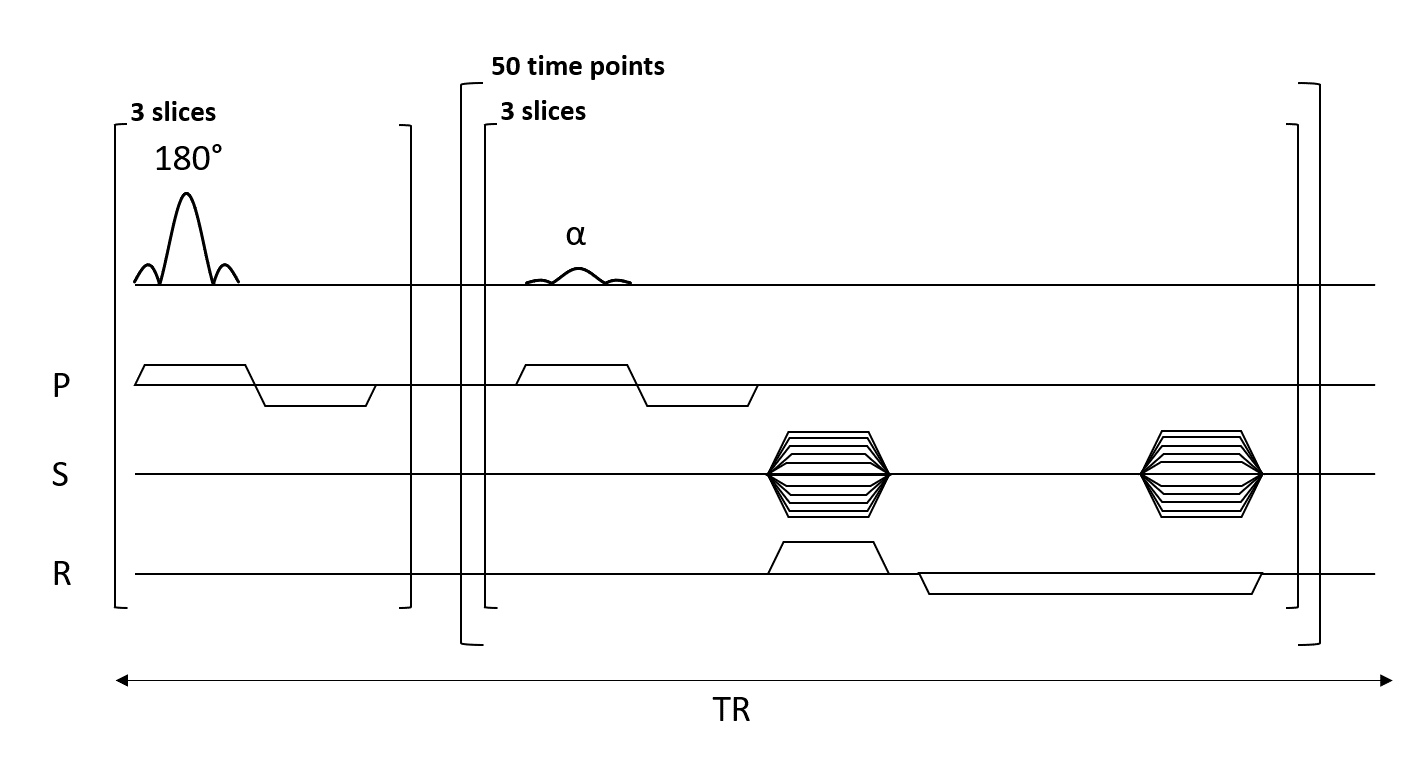
Figure 2: Multi-slice interleaved FLASH sequence based on Look-Locker.
A slice selective 180° pulse was applied to all the slices. Afterwards, an α = 20° slice-selective flip angle was applied to each slice and one line of k-space is acquired. This latter step was repeated 50 times to probe T1 recovery. One line of k-space is acquired for all slices and all time points during one full recovery. The distance between two inversion pulses was set to 5 s, while TR between each alpha pulse was equal to 98.2 ms.
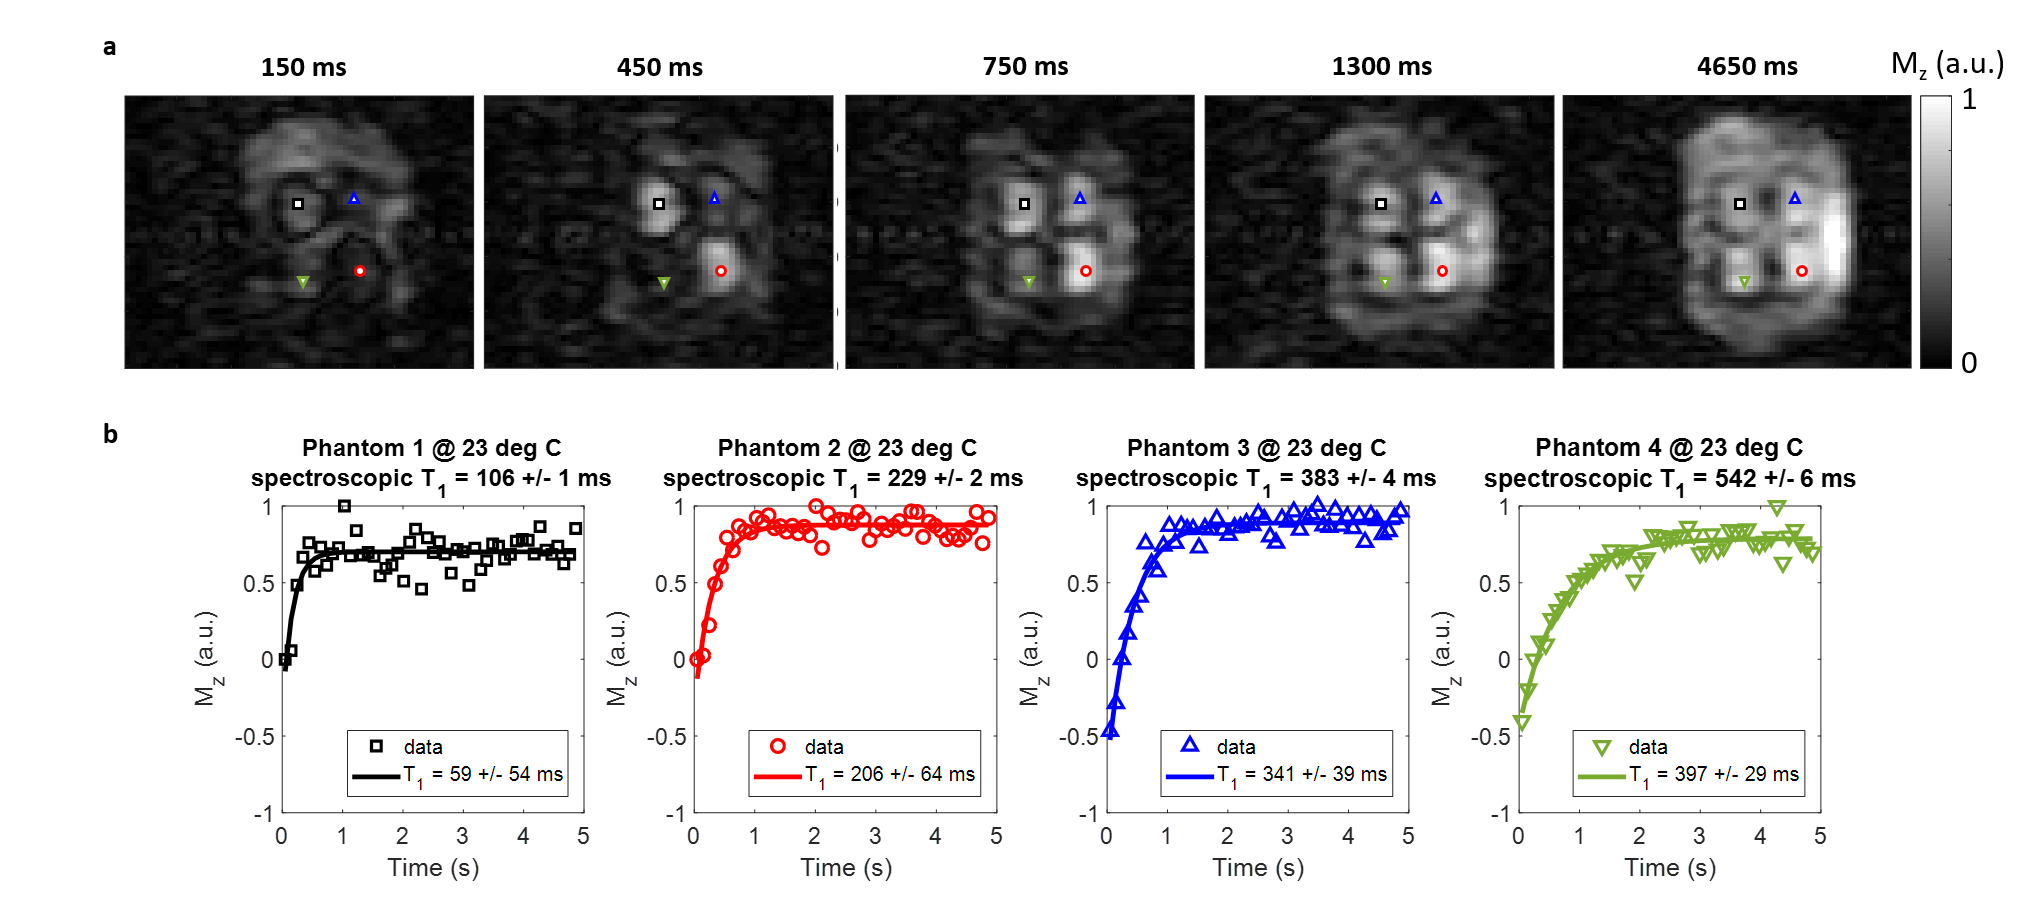
Figure 3: T1 estimation through pixel-wise fitting of MR images probing T1 relaxation.
a) MR images acquired at different inversion times show different timing of the magnetisation recovery for the different vials.
b) A 3-parameter fit of the apparent relaxation process (T1*) permits to retrieve a pixel-wise estimation of T1. At room temperature, the mean values estimated from the samples characterised by intermediate T1s match those measured through the spectroscopic sequence. The highest and lowest T1s, instead underestimate the expected values.
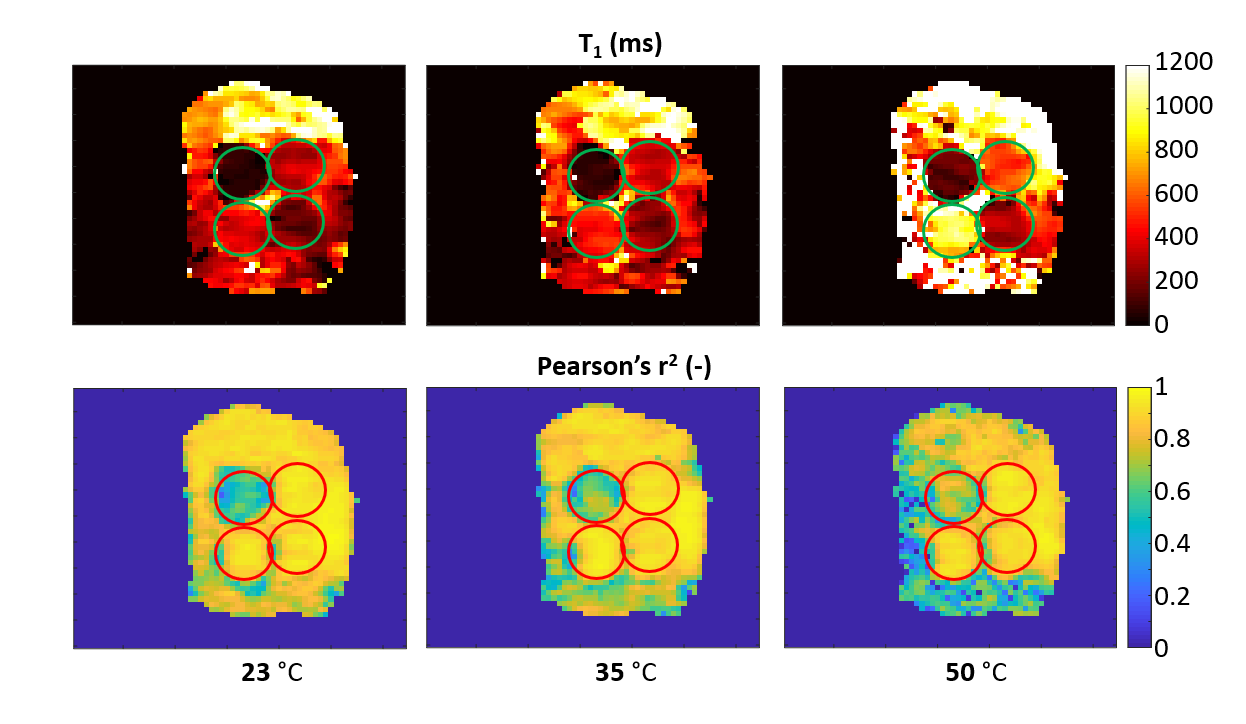
Figure 4: T1 mapping of the phantom at different temperatures.
From left to right are presented the predicted T1 values of the phantom for 23, 35 and 50 °C (top). The T1 dispersion of the four vials (circles) becomes more prominent with increasing temperature. Water surrounding the vials always shows a longer T1.
Pearson’s r2 suggests a good fit throughout almost the entire phantom (bottom). The metric points out a lower fitting quality for the sample characterised by the shortest T1, underestimated value at room temperature when compared to the spectroscopic measurement.
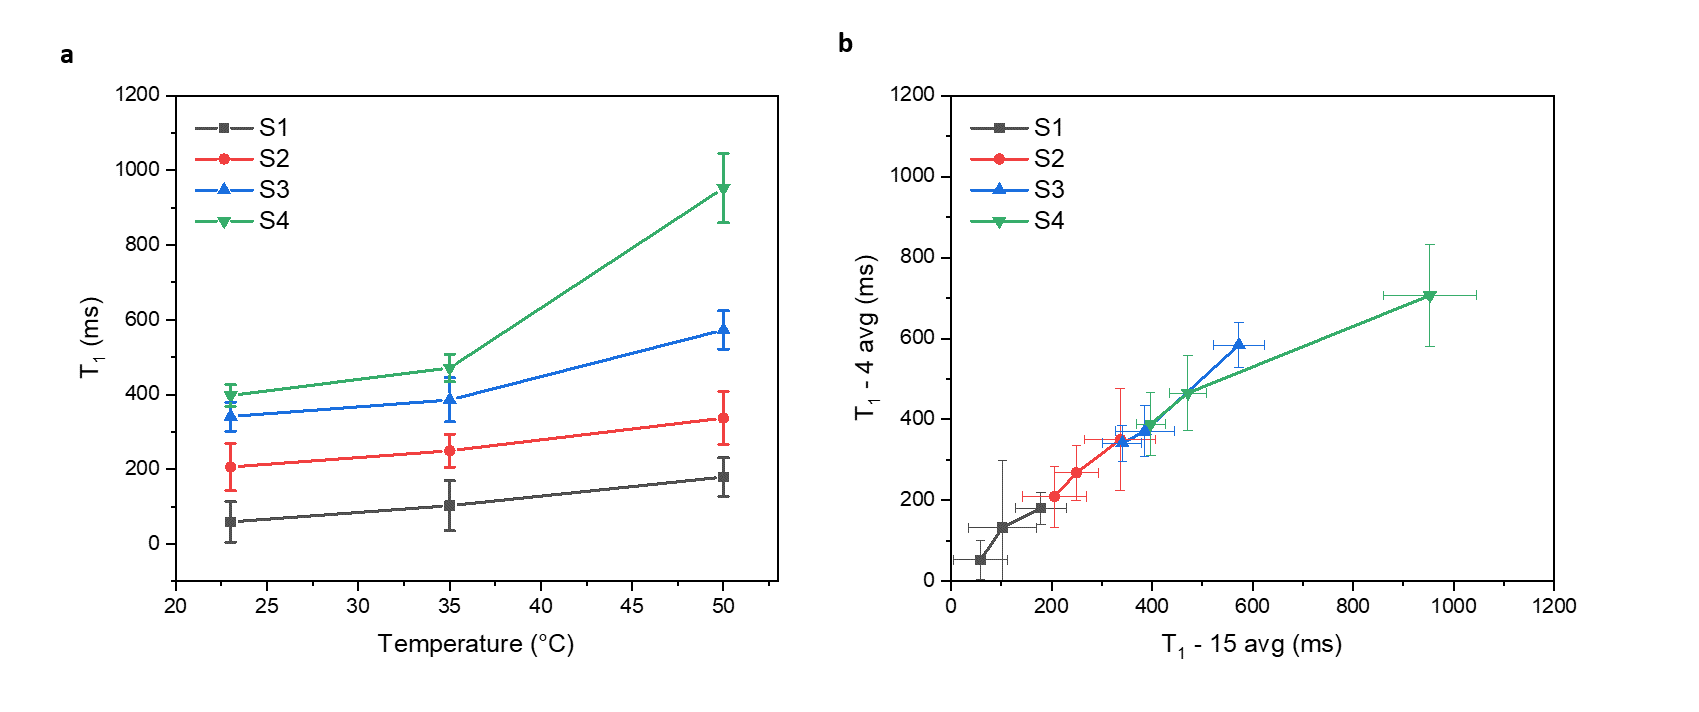
Figure 5: T1 mapping at low field can translate in fast temperature estimation.
(a) T1 shows a direct dependence on temperature at 0.1 T. While the trend is linear for three samples, in the case of the longest T1 the growth rate appears to change with temperature.
(b) Reducing the number of averages from 15 to 4 produces a drop in SNR by a factor of 2. Nevertheless, despite larger error bars, the estimated T1 value suggests a good correlation with those obtained using the higher-SNR sequence.