3154
Quantitative Imaging Metrics Derived from MR Fingerprinting using ISMRM/NIST System Phantom: An International Multi-Center Test-Retest Study1Department of Medical Physics, Memorial Sloan Kettering Cancer Center, New York, NY, United States, 2Columbia Magnetic Resonance Research Center, Columbia University, New York, NY, United States, 3Imago7 Foundation, Pisa, Italy, 4MR Apps & Workflow, GE Healthcare, New York, NY, United States, 5Department of Quantitative Health Sciences, Cleveland Clinic Foundation, Cleveland, OH, United States, 6Global Research, GE Healthcare, Munich, Germany, 7MR Workflow & Application Team, GE Healthcare, New York, NY, United States, 8Department of Radiology, Columbia University Medical Center, New York, NY, United States, 9Department of Radiology, Memorial Sloan Kettering Cancer Center, New York, NY, United States
Synopsis
The present study performed the repeatability and reproducibility test for T1, and T2 values estimated using MR fingerprinting (MRF) method. MRF data have been acquired over 30 days at three different centers (center-1 (USA): 1.5T and 3T, center-2 (USA): 3T and center-3 (Italy): 1.5T) using ISMRM/NIST MRI system phantom. MRF based estimated T1 and T2 values are compared with the vendor provided values and standard inversion recovery spin echo and a multiple single-echo spin-echo method as scanner Ground Truth (GT) values. The results show that the T1 and T2 values estimated using the MRF method are highly repeatable and reproducible.
Purpose
Magnetic Resonance Fingerprinting (MRF) by Dan Ma et al. 1 provides multiple Quantitative Imaging (QI) metrics (including, but not limited to, T1 and T2) within a single MR acquisition. This work aims to evaluate the repeatability and reproducibility of MR Fingerprinting (MRF) method estimated T1 and T2 values using the ISMRM/NIST MRI system phantom in an international multi-center study.Method
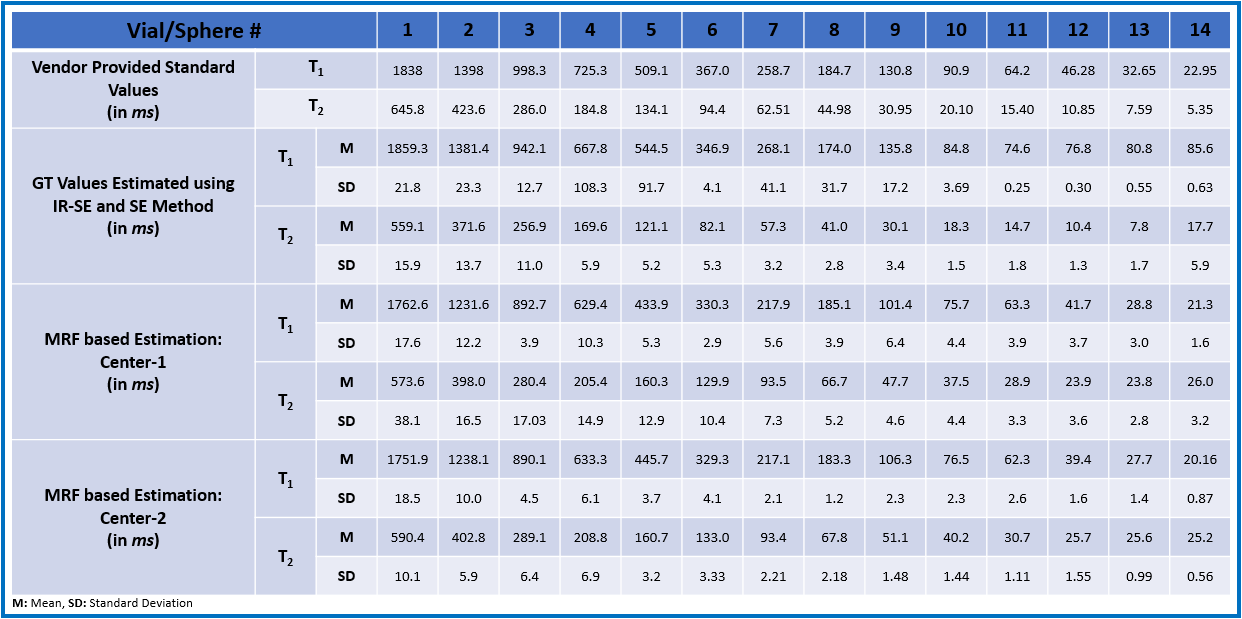
ISMRM/NIST system phantoms were scanned with the MRF protocol at the three centers (Center 1: Memorial Sloan Kettering Cancer Center, New York, USA; Center-2: Columbia University Medical Center, New York, USA; Center-3: Imagio7, Pisa, Italy) on General Electric (GE) MRI systems (Discovery 3T MR750w at center-1 and 2; and Signa 1.5T at center 1 and 3). MRF Data acquisition: The MRF sequence 2, 3 with the following parameter, Field of View (FOV)=25cm, matrix=128x128, minimum TR=14.7 ms, Flip Angle (FA)=700, number of slices=20 without a gap with the total scan time of 5.57 min were used to acquire all the data. The scan parameters matched TR and FA list from Jiang et al. 4. MRF scans were repeated 30 times at each center over 30 days. The Region of Interest (ROI) was selected on a specific sphere (14 T1 and 14 T2 spheres) in the ISMRM/NIST system phantom to assess the metric value of the measurements. The same protocol has been used at all the three collaborative centers to maintain the data consistency. Ground Truth (GT) T1 and T2 measurement: To estimate the GT T1 and T2 values in the ISMRM/NIST system phantom, an Inversion-Recovery Spin-Echo (IR-SE) method and a multiple single-echo spin-echo method were used on a GE Discovery 3T MR750w at center-1 and 2. T1 measurements from the T1 array were acquired by the IR-SE method with seven inversion times (TIs) of 50, 100, 200, 400, 800, 1600, and 3200 ms with a repetition time (TR) of 10,000 ms, an echo time (TE) of 12 ms, a matrix size of 128x128, a FOV of 25 cm, and a slice thickness of 5mm. The scan time for each TI measurement was 22.5 minutes. The total scan time for the gold standard T1 measurement was approximately 2 hours 45 mins. T2 measurements from the T2 array were obtained using a multiple single-echo spin-echo method with seven TEs of 12, 22, 42, 62, 102, 152, and 202 ms, a TR of 10,000 ms, with same a FOV, matrix size, and slice thickness as mentioned above. The scan time of each TE measurement was 23 min. The total scan time for the GT T2 measurement was approximately 2 hours 45 min. The curve fitting method is used to get the T1 and T2 values.Results
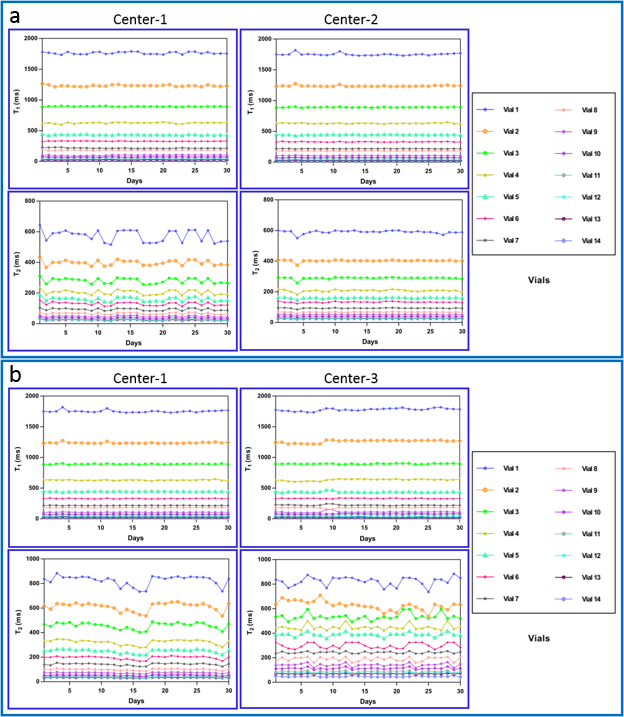
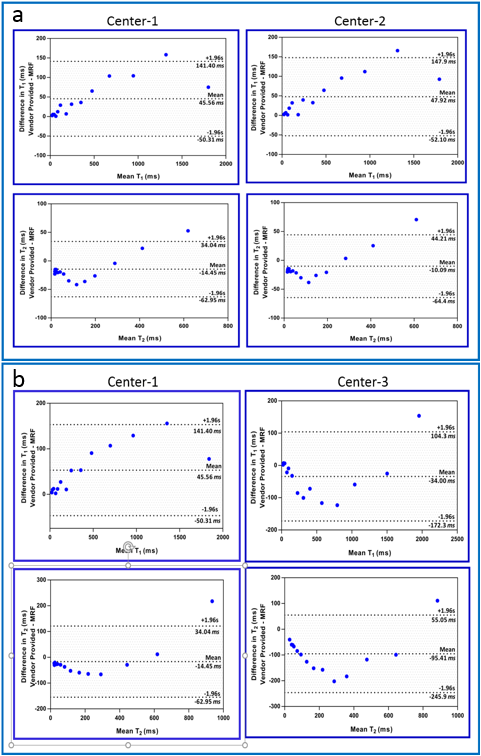
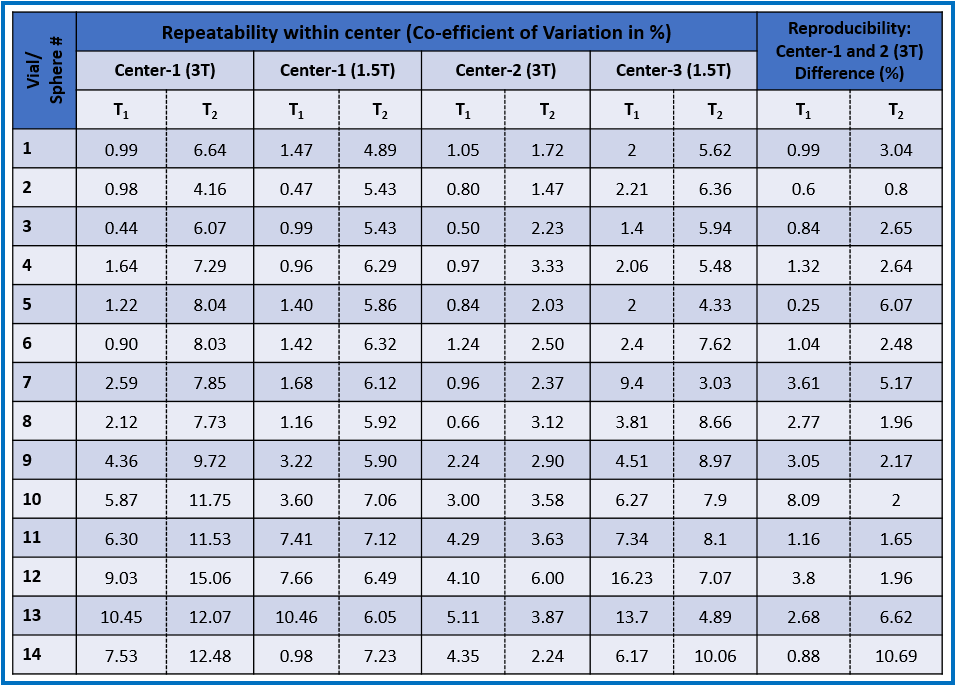
Figure 1 depicts T1 and T2 values in each sphere over 30 days at each center. A fixed size of 156-pixel circular ROI is used in this study to get the average T1 (from T1 array) and T2 (from T2 array) values from all the 14 spheres separately. Figure 2 shows the T1 and T2 values obtained from MRF method at three centers, which are plotted against the vendor-provided T1 and T2 values. The results show a strong linear correlation for T1 (Figure 2). Bland-Altman (BA) analysis performed on the T1 and T2 values obtained using MRF method and vendor-provided standard T1 and T2 values (Figure 3). BA plot shows that MRF based T1 and T2 values are within the limit of agreement except for one data point in all the cases. GT T1 and T2 values estimated using IR-SE, and single multi SE method along with the vendor provided and MRF based T1 and T2 estimates are reported in Table 1 to compare the difference between these methods. Table 2 consists of repeatability and reproducibility results. The coefficient of variation (CoV in %) is tabulated in Table 2 to show the repeatability of MRF method at all three centers. To check the reproducibility of T1 and T2 values estimated using MRF method, percentage of difference between the center-1 and center-2 (acquired on Discovery 3T MR750w at both centers) calculated and shown in Table 2.Discussion and Conclusion
This is the first international multi-center MRF test-retest study on this specific vendor (GE) for quantitative analysis using ISMRM/NIST MRI system phantom. The T1 values are consistent (CoV <5%) for higher T1 (>100ms) within center repeated experiments (values are detailed in Table 2). The T2 values exhibited a greater variation in measurement than T1 due to B1 variation in a day-to-day scans. Reproducibility analysis is performed by comparing the data acquired on the 3T scanner at center-1 and 2. Table 2 shows the percentage of difference between these two centers are less than 5% for majority of T1 and T2 values in a specific sphere/vial. MRF data obtained on 1.5T scanners at center-1 and 3 is not used for reproducibility study due to the difference in the version of the ISMRM/NIST MRI system phantom available at these centers. In conclusion this study shows that MRF has high repeatability and reproducibility in certain vials for both T1 and T2 using the ISMRM/NIST MRI system phantom which is consistent with published literature 5.Acknowledgements
National Institutes of Health Grant: U01 CA211205 (PI: ASD and LHS)
Zuckerman Institute Technical Development Grant for MR, Zuckerman Mind Brain Behavior Institute, Grant Number: CU-ZI-MR-T-0002 (PI: SG)
GE Healthcare-Columbia Radiology MR Research Partnership Program (PI:SG)
References
- Ma, Dan, Vikas Gulani, Nicole Seiberlich, Kecheng Liu, Jeffrey L. Sunshine, Jeffrey L. Duerk, and Mark A. Griswold. "Magnetic resonance fingerprinting." Nature 495, no. 7440 (2013): 187.
- Amaresha Shridhar Konar, G.B., Vaios Hatzoglou, Maggie Fung, Pedro Gomez, Rolf Schulte, Kavya Prasad, Michael Liu, Miriam Klein, Sairam Geethanath, Lawrence H Schwartz, Amita Shukla-Dave, and Sachin Jambawalikar. “Repeatability Measurements of Magnetic Resonance Fingerprinting Metrics using ACR and ISMRM/NIST Phantoms: A Multi-Center Study”. ISMRM. 2019. Montreal.
- Buonincontri, Guido, Laura Biagi, Alessandra Retico, Paolo Cecchi, Mirco Cosottini, Ferdia A. Gallagher, Pedro A. Gómez et al. "Multi-site repeatability and reproducibility of MR fingerprinting of the healthy brain at 1.5 and 3.0 T." NeuroImage 195 (2019): 362-372.
- Jiang, Yun, Dan Ma, Nicole Seiberlich, Vikas Gulani, and Mark A. Griswold. "MR fingerprinting using fast imaging with steady state precession (FISP) with spiral readout." Magnetic resonance in medicine 74, no. 6 (2015): 1621-1631.
- Jiang, Yun, Dan Ma, Kathryn E. Keenan, Karl F. Stupic, Vikas Gulani, and Mark A. Griswold. "Repeatability of magnetic resonance fingerprinting T1 and T2 estimates assessed using the ISMRM/NIST MRI system phantom." Magnetic resonance in medicine 78, no. 4 (2017): 1452-1457.
Figures