3153
Relaxometry Differences Between Magno- and Parvocellular Human LGN Subdivisions Revealed by In- and Ex-vivo Quantitative MRI1Max Planck Institute for Human Cognitive and Brain Sciences, Leipzig, Germany, 2Faculty of Psychology, Technical University of Dresden, Dresden, Germany, 3LPNC, Grenoble Alpes University, Grenoble, France, 4Integrative Model-based Cognitive Neuroscience Research Unit, Department of Psychology, University of Amsterdam, Amsterdam, Netherlands, 5Paul Flechsig Institute of Brain Research, University of Leipzig, Leipzig, Germany
Synopsis
The human lateral geniculate nucleus (LGN) is the central station for visual processing before information reaches the cerebral cortex. It is characterized by subdivisions with distinct cyto- and myeloarchitecture. Due to its small size, imaging of the LGN and especially its subdivisions is challenging. Here, we show that the LGN and its subdivisions can be identified using in-vivo and ex-vivo high-field quantitative MRI with ultra-high resolution. We present the to-date first atlas of the LGN and its estimated subdivisions. This work will serve as a highly valuable tool both for neuroscientists and clinicians investigating the visual system and its disorders.
Introduction
The human lateral geniculate nucleus (LGN) is the central visual processing structure between the retina and the visual cortex. On a cellular level, the LGN is composed of six layers, two ventral magnocellular (M) layers, and four dorsal parvocellular layers (P)1, which are separated by koniocellular layers. M and P layers process complementary visual information. Histological analyses revealed distinct cyto- and myeloarchitectonic characteristics of M and P layers1. Here, we investigated whether these distinct architectonic subdivisions can be identified by means of purely structural quantitative MR (qMRI) relaxometry approaches, which are sensitive to microstructural features such as differences in tissue myelination2. We first employed high-resolution ex-vivo qMRI of the human LGN to reveal relaxometry differences between LGN subdivisions. We then confirmed this relaxometry contrast in a large sample of high-resolution state-of-the-art in-vivo 7T qMRI data. The in-vivo data was used to create a detailed population atlas of the LGN and its potential subdivisions.Methods
Ex-vivo MRI:A human post-mortem brain (left hemisphere LGN, female, 89yrs, post-mortem delay 24h) was fixated in 3% paraformaldehyde and 1% glutaraldehyde, washed in phosphate-buffered-solution and immersed in Fomblin before MR scanning. High-resolution quantitative Multi-Parametric-Mapping (MPM)3 data were acquired on a 7T Magnetom MRI (Siemens Healthineers, Germany) using a custom-built Helmholtz coil4. The following multi-echo 3D-FLASH data were acquired: 220μm isotropic resolution, TR=95ms, TE=4-40.7ms (12 echoes), FoV=50×50×24.64mm³, αPD=17°, αErnst=32°, αT1=82°. Multi-echoes were employed to jointly estimate T2* and extrapolate all contrasts to TE=0ms3. Signal intensities of all contrasts were fit voxel-wise to the steady-state Ernst-equation5 to compute quantitative tissue parameters T1 & PD. To enable comparability to conventional in-vivo qMRI sequences (e.g., MP2RAGE), we focused on T1 to explore relaxometry differences between LGN subdivisions.
In-vivo MRI:
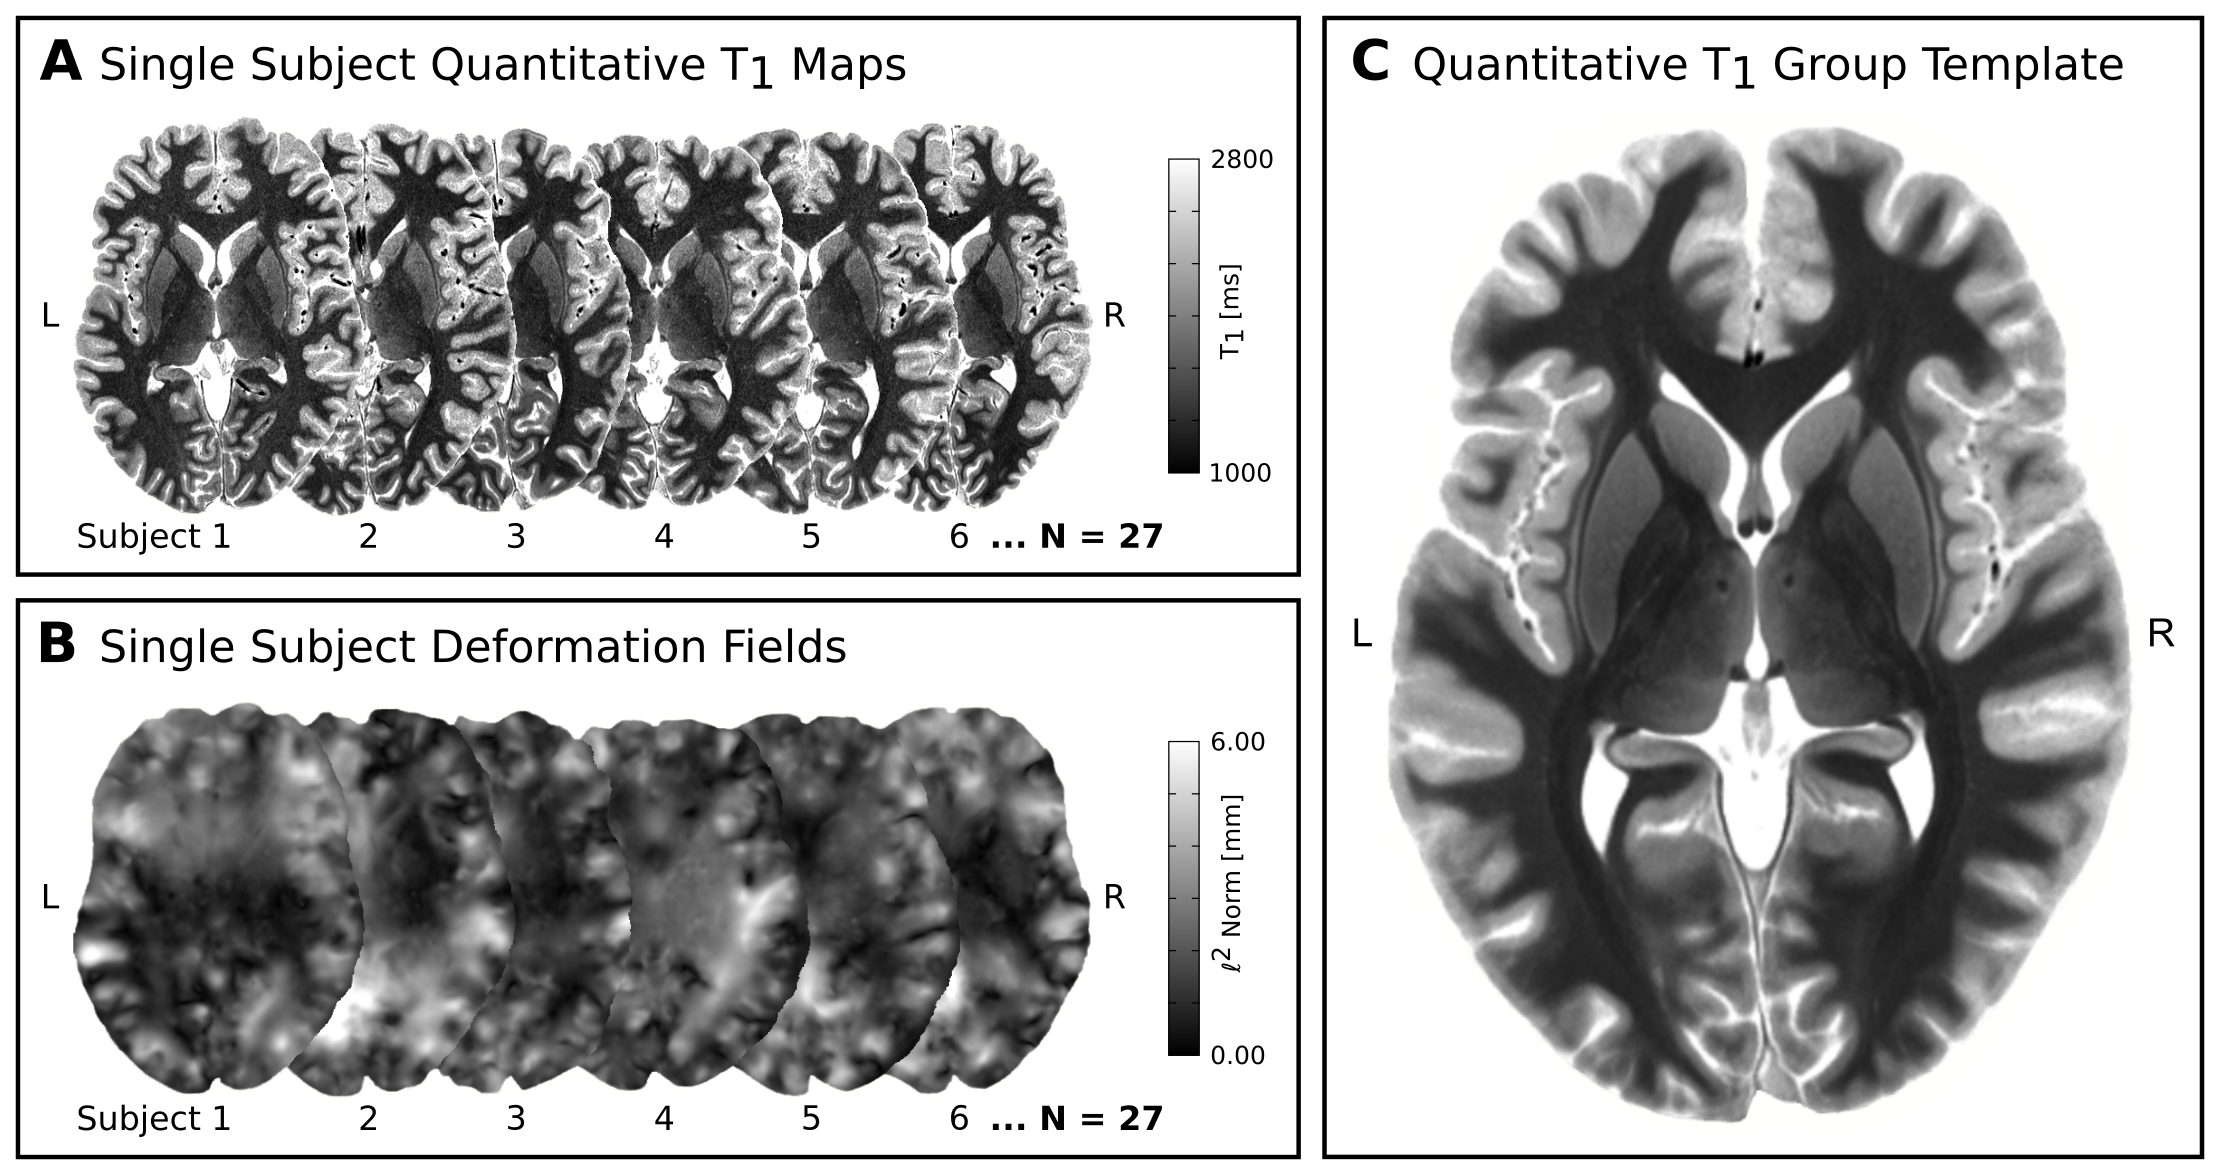
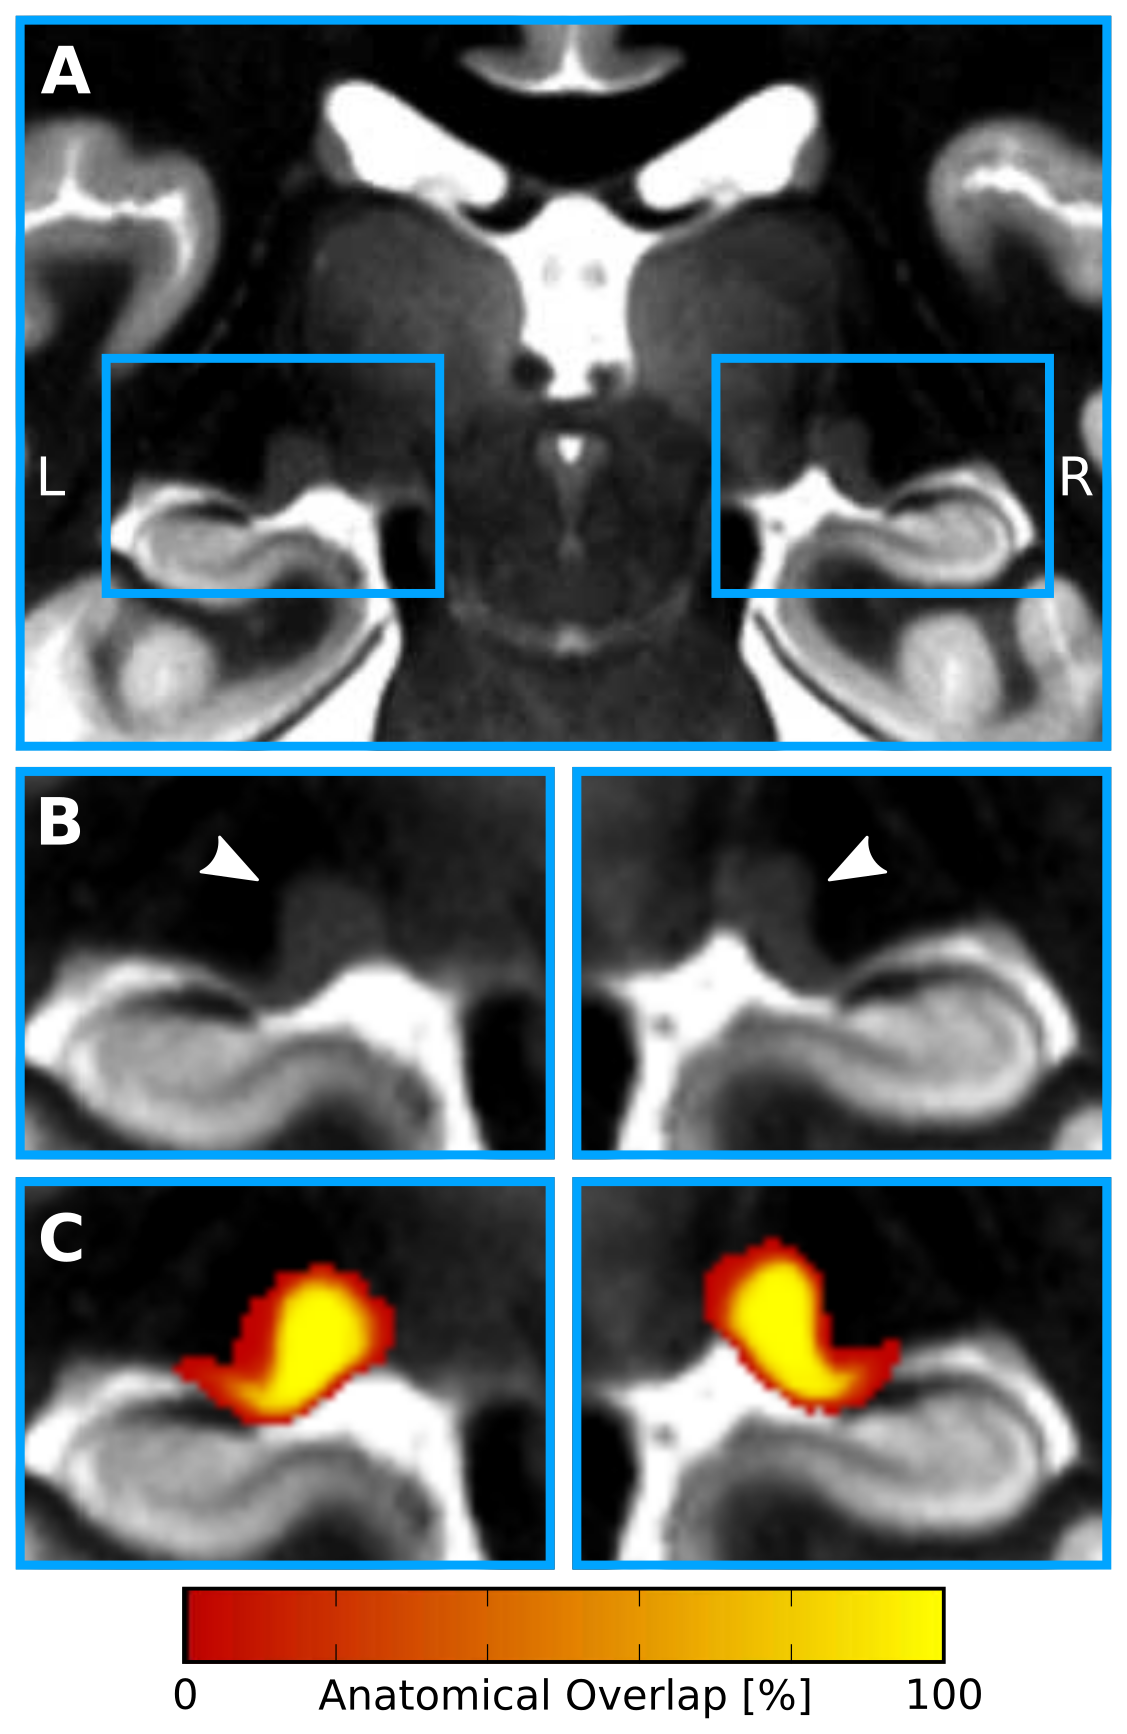
In-vivo 7T qMRI data were selected from publicly available6,7 500μm isotropic quantitative T1 maps of a 3D-MP2RAGE8 acquisition in two slabs of N=27 healthy adults (12 females, 26.5±3.8yrs). The imaging parameters were: TR=5000ms, TE=2.45ms, TI1/TI2=900/2750ms, FoV=224×224×104mm3, α1/α2=3/5° and PF=6/8. The two slabs were fused into a whole-brain image in MNI space at 400μm isotropic resolution. Two independent raters manually segmented bilateral LGNs with high inter-rater reliability: mean Dice9=0.88±0.02. Only the intersection of both segmentations was used to create LGN masks. To enable group-level relaxometry analyses, the qMR images and LGN masks were normalized to a common reference space, i.e., to a study-specific quantitative T1 template, which was created using symmetric normalization10 (SyN) in ANTS (Fig. 1). Within template space, all registered LGN masks were averaged for each hemisphere to create LGN population maps (Fig. 2). Both, the LGN population maps and the registered individual LGN masks were subsequently used to inform T1-relaxometry analyses on a group and single-subject level, respectively.
Results
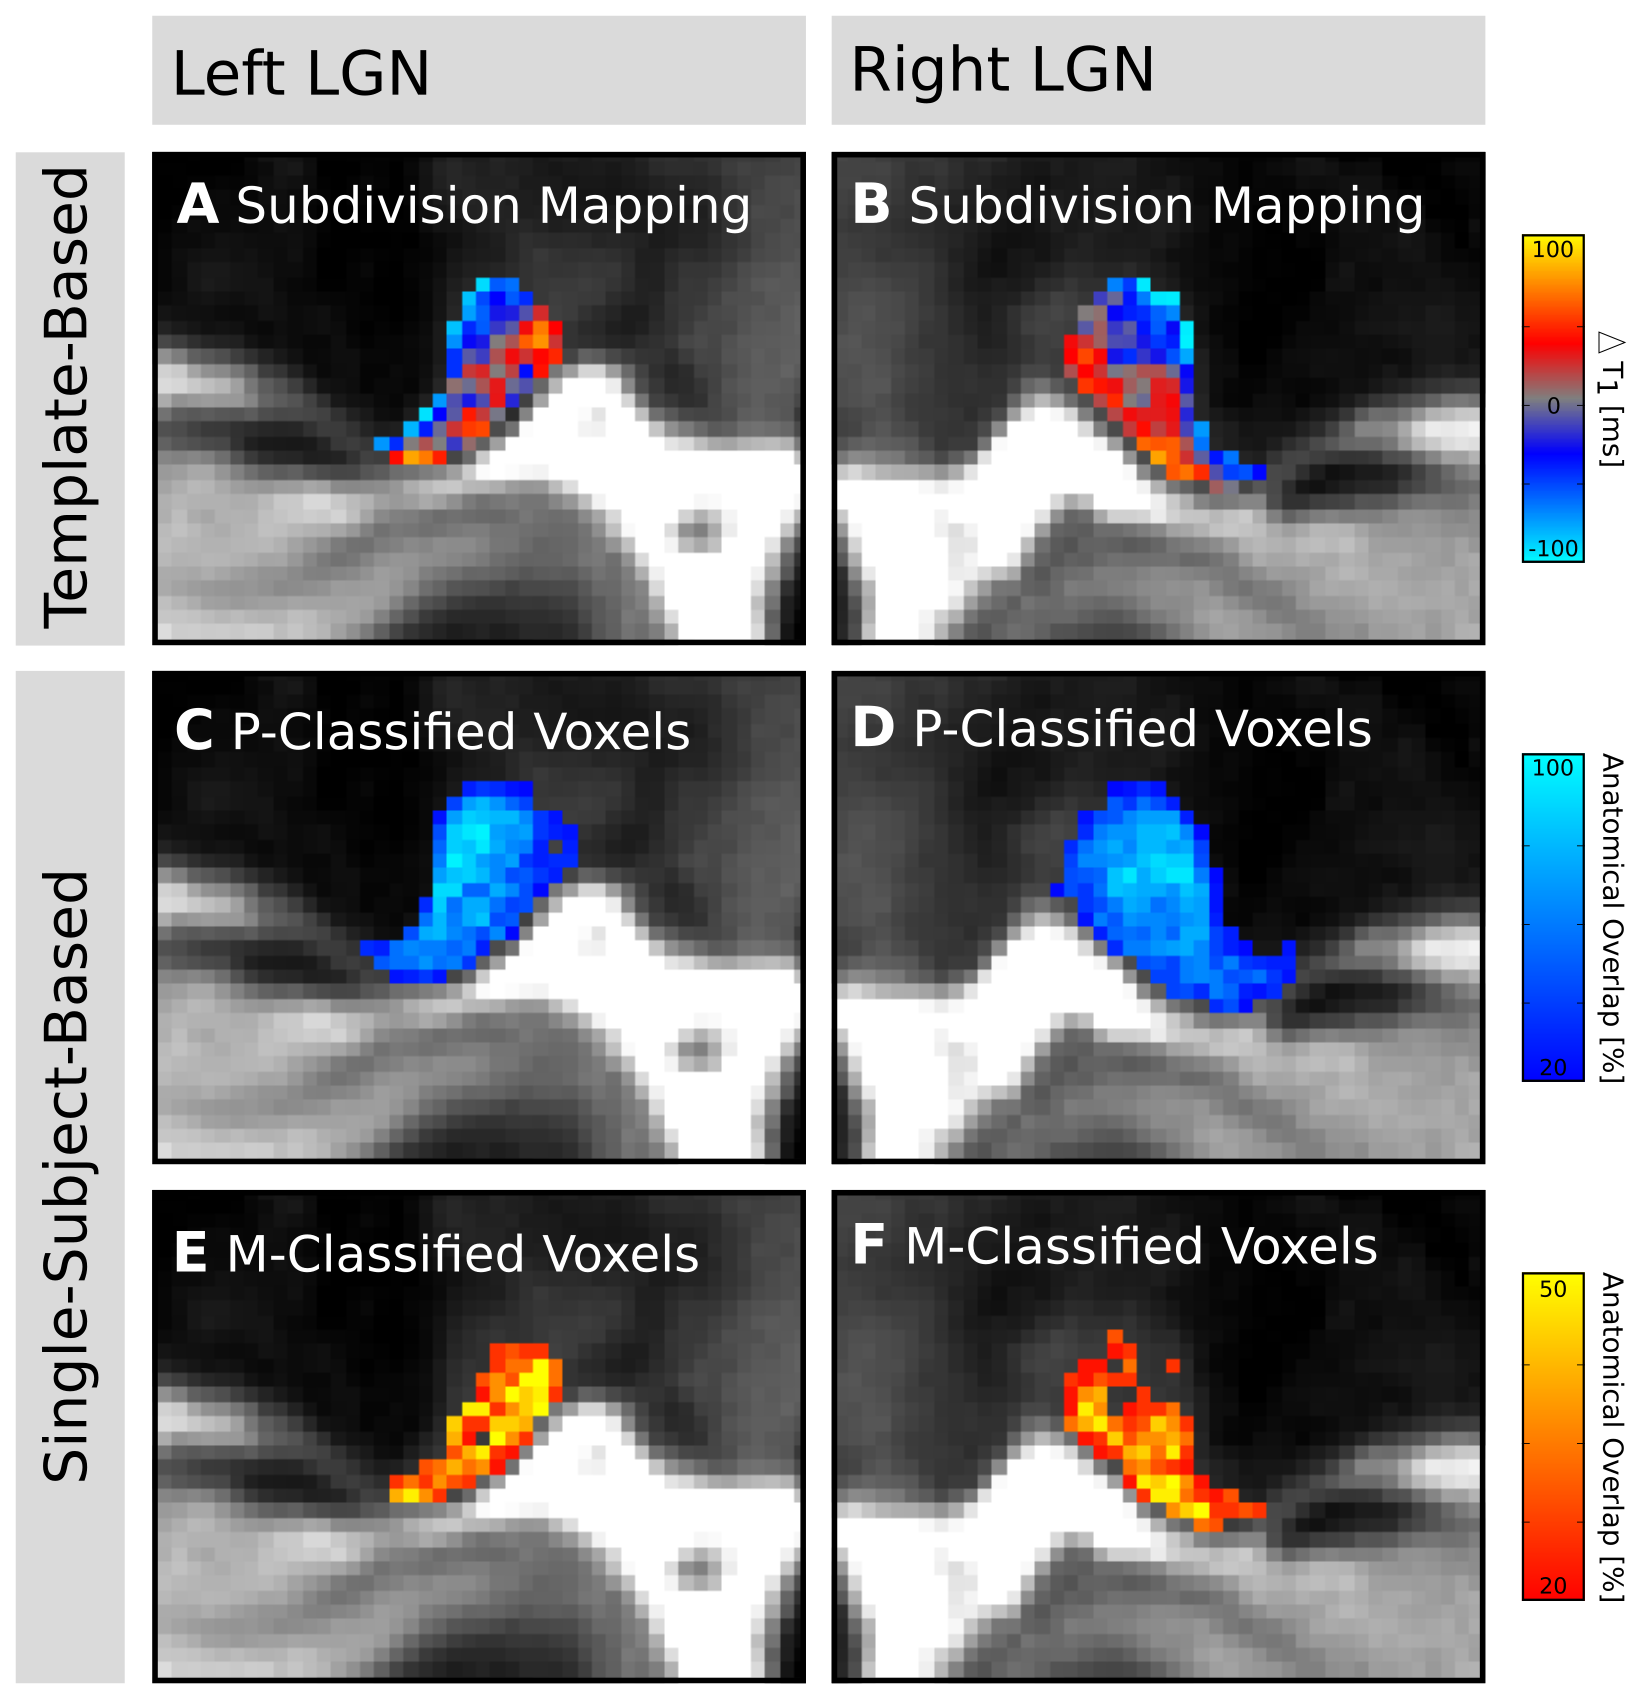
Visual inspection of the ex-vivo qT1 data revealed a clear contrast in tissue relaxometry within the LGN (Fig. 3A&B). Higher T1-relaxation values coincided with the known anatomical location of the M subdivision, and lower T1-relaxation values coincided with the P subdivision (Fig. 3D&E). Histogram-thresholding of LGN T1-values, in accordance with the known anatomical composition of approximately 20%-M and 80%-P contribution to total LGN volume1, confirmed a ventral and a dorsal subdivision (Fig. 3C). To confirm this relaxometry contrast in-vivo, the qT1 template was intersected with the LGN population maps (thresholded to 50% anatomical overlap across subjects), and normalized to the lowest 80% T1-values (P-contribution). In line with the ex-vivo results, there were higher T1-values in ventral and lower T1-values in dorsal parts of the LGN (Fig. 4A&B). A similar pattern was also evident on a single-subject level. Histogram-thresholding (lowest 80% T1: P-contribution) of each of the N=27 qT1 maps, intersected with the respective individual LGN masks, showed a high anatomical overlap across subjects in P-classified voxels in dorsal LGN (Fig. 4C&D), whereas a high overlap cluster of M-classified voxels was observed in the ventral LGN (Fig. 4E&F).Discussion
To date, mapping of the LGN’s major subdivisions in humans in-vivo has only been achieved using extensive fMRI protocols12,13. Conversely, we show here that a detailed definition of the LGN and its two main cytoarchitectonic subdivisions is feasible by means of purely structural qMRI approaches. By employing two methodologically orthogonal high-resolution ex-vivo (MPM) and in-vivo (MP2RAGE) qMRI acquisition strategies, we show that LGN subdivisions can be distinguished based on their distinctive qT1-relaxation profiles. The observed relaxometry-contrast, with elevated qT1-values of the ventral LGN subdivision, potentially arises from an overall decreased myelination density in the magnocellular layers. This decreased myelination density could be due to a sparser arrangement of M than P-cells1. With high-field MRI being increasingly available at clinical sites, we expect that structural mapping of the LGN’s subdivisions will be a promising endeavor for the clinical community, given that LGN subdivisions are implicated in various visual13,14 and neurodevelopmental disorders15-17. To facilitate future research on the human visual system, the here presented high-resolution LGN atlas and its estimated subdivisions will be made publicly available.Acknowledgements
We thank the former Brain Banking Centre Leipzig of the German Brain-Net, operated by the Paul Flechsig Institute of Brain Research (Medical Faculty, University of Leipzig, Department of Neuropathology, University Hospital Leipzig) for providing the post-mortem tissue. The entire procedure of case recruitment, acquisition of the patient's personal data, the protocols and the informed consent forms, performing the autopsy, and handling the autopsy material have been approved by the responsible authorities (Approval by the Sächsisches Bestattungsgesetz von 1994, 3. Abschnitt, §18, Ziffer 8; GZ 01GI9999-01GI0299; Approval \# WF-74/16, Approval \# 82-02 and Approval \# 205/17-ek, Approval \# 153/17-ek).
The project was funded by the ERC-consolidator grant SENSOCOM 647051 (KvK).
CE and HR are supported by the SPP2041 program "Computational Connectomics" of the German Research Foundation (DFG).
References
1. Andrews TJ et al. Correlated size variations in human visual cortex, lateral geniculate nucleus, and optic tract. J Neurosci. 1997;17(8):2859-2868.
2. Stüber C et al. Myelin and iron concentration in the human brain: a quantitative study of MRI contrast. Neuroimage. 2014;93:95-106.
3. Weiskopf N et al. Estimating the apparent transverse relaxation time (R2*) from images with different contrasts (ESTATICS) reduces motion artifacts. Frontiers in Neuroscience. 2014;8:278.
4. Müller R et al. Application of an RF current mirror for MRI transmit coils. ISMRM 27th Annual Meeting & Exhibition. 2019.
5. Helms G et al. Quantitative FLASH MRI at 3T using a rational approximation of the Ernst equation. Magnetic Resonance in Medicine. 2008;59(3): 667-672.
6. Tardif CL et al. Open Science CBS Neuroimaging Repository: sharing ultra-high-field MR images of the brain. Neuroimage. 2016;124:1143-1148.
7. Data repository: http://openscience.cbs.mpg.de/bazin/7T_Quantitative/
8. Marques JP et al. MP2RAGE, a self bias-field corrected sequence for improved segmentation and T1-mapping at high field. Neuroimage. 2010;49(2):1271-1281.
9. Dice LR. Measures of the amount of ecologic association between species. Ecology. 1945;26(3):297-302.
10. Avants BB et al. Symmetric diffeomorphic image registration with cross-correlation: Evaluating automated labeling of elderly and neurodegenerative brain. Medical Image Analysis. 2008;12(1):26-41.
11. Lendvai D et al. Perisynaptic aggrecan‐based extracellular matrix coats in the human lateral geniculate body devoid of perineuronal nets. Journal of Neuroscience Research. 2012;90(2):376-387.
12. Denison RN et al. Functional mapping of the magnocellular and parvocellular subdivisions of human LGN. Neuroimage. 2014;102:358-369.
13. Zhang P et al. Selective reduction of fMRI responses to transient achromatic stimuli in the magnocellular layers of the LGN and the superficial layer of the SC of early glaucoma patients. Human brain mapping. 2016;37(2):558-569.
14. Gupta N et al. Brain changes in glaucoma. European Journal of Ophthalmology. 2003;13:32-35.
15. Livingstone MS et al. Physiological and anatomical evidence for a magnocellular defect in developmental dyslexia. Proceedings of the National Academy of Sciences. 1991;88(18):7943-7947.
16. Müller-Axt C et al. Altered structural connectivity of the left visual thalamus in developmental dyslexia. Current Biology. 2017;27(23):3692-3698.
17. Milne E et al. High motion coherence thresholds in children with autism. Journal of Child Psychology and Psychiatry. 2002;43(2):255-263.
Figures