3150
T1 relaxation in fat and its dependence on fat content1Medical Physics Unit, McGill University, Montreal, QC, Canada, 2Biomedical Engineering, McGill University, Montreal, QC, Canada, 3Research Institute of the McGill University Health Centre, Montreal, QC, Canada
Synopsis
The T1 relaxation of triglyceride molecules is of interest for fat-water separation and fat quantification. A better understanding of the T1 of fat could benefit modeling techniques for applications in MR-oximetry and fatty liver disease. In this work, the T1 relaxation and its dependence on fat content was evaluated for five spectral peaks present in triglyceride molecules, over a range of fat fractions in a homogeneous fat-water mixture. The T1 of water in mixture was also studied. A model is proposed to describe the two-pool relaxation in a fat-water mixture as a function of the fraction of each pool.
Introduction
The longitudinal relaxation time of fat is of interest for accurate fat-water separation and fat quantification, for example in imaging of fatty liver disease1. Fat T1 has also received interest for MR-oximetry, as oxygen is more soluble in fat than in water2. Observations suggest that T1 of fat is more sensitive to variations in tissue oxygenation than global T13. A detailed understanding of the T1 relaxation of fat molecules, known as triglycerides, could therefore benefit fat T1 modeling for these applications. We studied the variations of T1 of major and minor fat peaks as a function of the fat fraction (FF) in a fat-water mixture. The water T1 was also studied.Methods
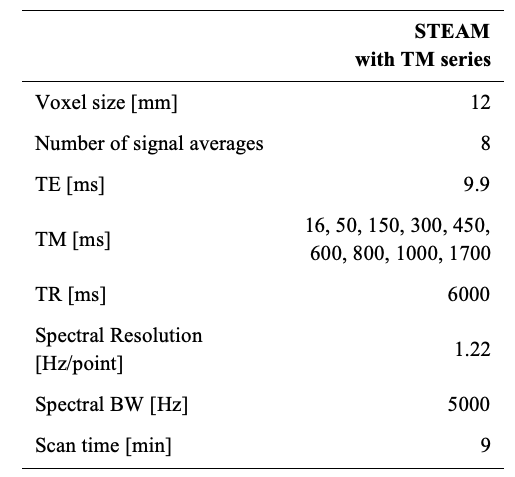
Dairy cream at room temperature was used as an approximation of fat-water mixture in human tissue. The cream was diluted with distilled water in 50 ml vials to produce six different FF between 4.4% and 35%.A 3 T scanner (Ingenia, Philips Inc.) was used with an extremity coil. A single-voxel STEAM MRS sequence with a series of mixing times (TM) was used for T1 measurements (Table 1). The T1 measurement was repeated three times in one vial (FF=35%) to evaluate variability. The experiment was performed twice, with re-positioning of the phantom, to evaluate replicability.
The MRS spectra were fitted with a nine-peak spectrum (eight fat peaks and the water peak) using least-squares fitting, after zeroth-order phase correction and apodization. For T1 calculation, a model for the area (S) of each peak as a function of the TM4 was fitted using non-linear least-squares:
$$S=Ae^{-\frac{TM}{T_1}}$$
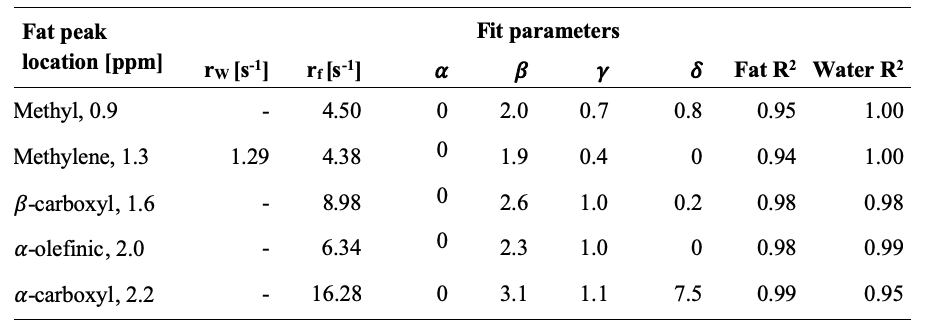
T1 variations of fat and water peaks as a function of FF were modeled with relaxation contributions from interactions within and between pools based on a prior model5. The relaxation rates were forced to converge at the extreme FF, as previously suggested1. The relaxation rates of water (R1,w) and fat (R1,f) are described by the following equations. rw and rf are the relaxation rates of pure water and pure fat, respectively. The positive, real exponents α, β, γ and δ introduce non-linear dependence on the pool sizes for the relaxation pathways (water-water (α), water-fat (β), fat-fat (γ), and fat-water (δ)).
$$R_{1,w}=r_w(1-FF)^\alpha+r_fFF^\beta$$
$$R_{1,f}=r_fFF^\gamma+r_w(1-FF)^\delta$$
These two equations were jointly fitted to the T1 of the water and methylene peaks versus FF using non-linear least-squares. The joint fit was repeated for other fat peaks, but with rw fixed to the result of the first fit, as rw should not vary by fat peak. T1 from both experiments were combined for this part of the analysis.
Results and discussion
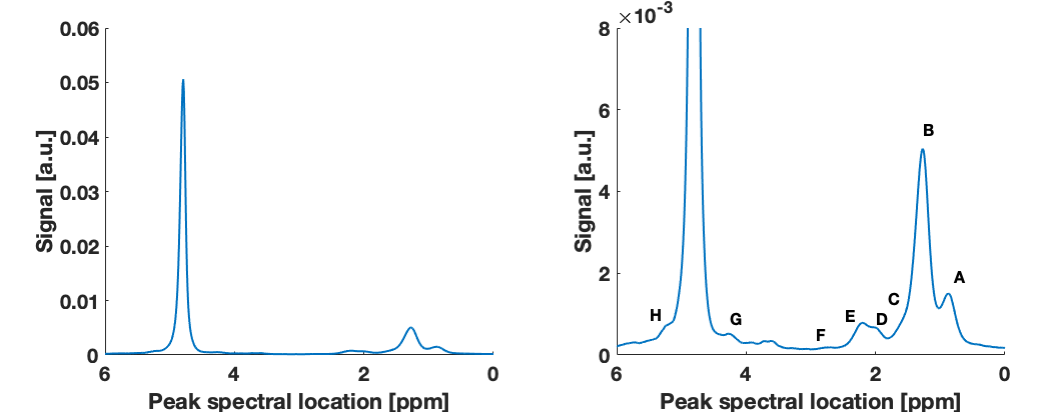
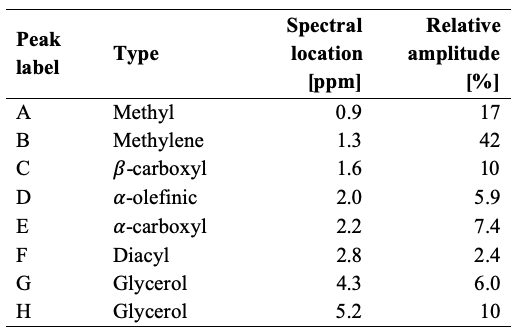
The two main fat peaks (methylene and methyl) were properly resolved (Figure 1). The α-carboxyl and α-olefinic peaks were also observed but with overlapping areas. The β-carboxyl peak was hidden in the methylene peak, but its T1 was observed to vary independently, so it was retained for T1 analysis. Other fat peaks were not properly resolved (diacyl and glycerol). The relative abundance of each fat peak, averaged over two experiments, is listed in Table 2.The variability of T1 over three scan repetitions was small within each experiment, with low coefficients of variation (CV), below 0.3% for the water and methylene peaks for both experiments. The results were also replicable between the two experiments: CV=0.06% for the water peak and CV=1.4% for the methylene peak.
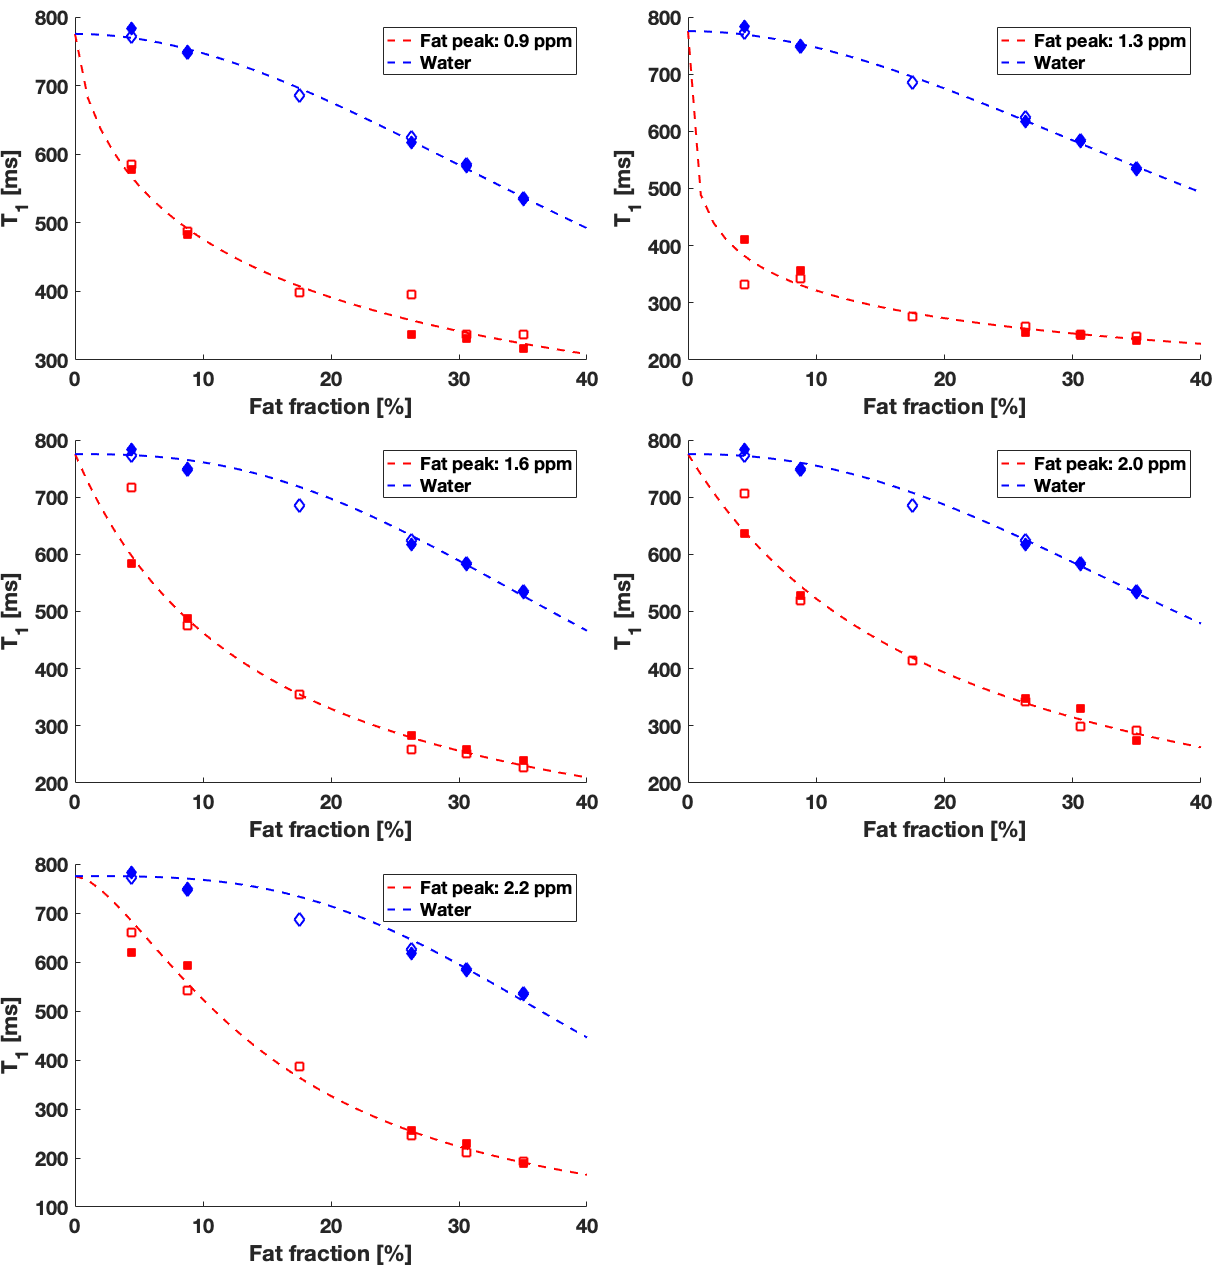
The T1 of fat peaks decreased as the FF increased (Figure 2). The variations were closely described by the proposed model for T1 versus FF, with R2fat>0.94 (Table 3). The spectrum measured in the FF=17.5% vial during the first experiment had lower shim quality and an unexpectedly low T1 value, and was excluded from the T1 analysis. The T1 of the methylene peak decreased with FF and stabilized around FF=26%, matching the observations in a previous work performed with a different fat-water mixture1, but contradicting a recent study6. The methylene peak was also the least variable T1 versus FF. The T1 of other fat peaks decreased further beyond FF=26%. The T1 variations of minor fat peaks as a function of FF have not previously been reported. Measurements at a higher field strength could be useful to study the other minor fat peaks (diacyl and glycerol).
The decrease of the water T1 with FF increased (Figure 2) was nearly linear, consistent with literature7. This behaviour was nonetheless closely fitted by the proposed model, with R2water>0.95 (Table 3).
Conclusion
We investigated variations of the longitudinal relaxation time of different peaks on fat molecules as a function of the FF in a mixture of dairy cream and water. T1 of the minor peaks varied with FF. Observations for the methylene and water peaks were consistent with previous reports1,7. These results, and our model, may inform the study of T1 relaxation in fat-water mixtures, for applications to MR-oximetry and fatty liver disease.Acknowledgements
The authors acknowledge the Body Magnetic Resonance research group (Technical University of Munich) for sharing their MRS processing software, and Guillaume Gilbert (Philips Healthcare, Inc.), Atiyah Yahya (University of Alberta), and Jamie Near, Zaki Ahmed, and Stella Xing (McGill University) for useful discussion. This work was funded by the Montreal General Hospital Foundation, the Research Institute of the McGill University Health Centre, and a Discovery Grant from the Natural Science and Engineering Research Council of Canada (NSERC). VF acknowledges fellowship support from NSERC, and partial support from the NSERC CREATE Medical Physics Research Training Network (Grant number: 432290).References
1. Hu HH, Nayak KS. Change in the proton T1 of fat and water in mixture. Magn Reson Med. 2010;63(2):494-501. doi:10.1002/mrm.22205.
2. Jordan BF, Magat J, Colliez F, et al. Mapping of oxygen by imaging lipids relaxation enhancement: A potential sensitive endogenous MRI contrast to map variations in tissue oxygenation. Magn Reson Med. 2013;70(3):732-744. doi:10.1002/mrm.24511.
3. Franconi F, Lemaire L, Saint-Jalmes H, Saulnier P. Tissue oxygenation mapping by combined chemical shift and T 1 magnetic resonance imaging. Magn Reson Med. 2018;79(4):1981-1991. doi:10.1002/mrm.26857.
4. Brix G, Heiland S, Bellemann ME, Koch T, Lorenz WJ. MR imaging of fat-containing tissues: Valuation of two quantitative imaging techniques in comparison with localized proton spectroscopy. Magn Reson Imaging. 1993;11(7):977-991. doi:10.1016/0730-725X(93)90217-2.
5. Ragozzino E, Bortone C. Proton spin-lattice relaxation in binary liquid mixtures: Determination of the mixed translational contributions. Mol Phys. 1971;22(3):525-533. doi:10.1080/00268977100102771.
6. Marage L, Lasbleiz J, Lederlin M, Gambarota G. Correlation between Fat Fraction and MR relaxation times in the vertebral bone marrow at 1.5 T. In: Proceedings of the 27th Annual Meeting of ISMRM, Montreal, Quebec, Canada, 2019. Abstract 4969.
7. Le Ster C, Lasbleiz J, Kannengiesser S, Guillin R, Gambarota G, Saint-Jalmes H. A fast method for the quantification of fat fraction and relaxation times: Comparison of five sites of bone marrow. Magn Reson Imaging. 2017;39:157-161. doi:10.1016/j.mri.2017.03.001.
Figures