3149
Fat DESPOT for MR-oximetry validated by STEAM MRS1Medical Physics Unit, McGill University, Montreal, QC, Canada, 2Biomedical Engineering, McGill University, Montreal, QC, Canada, 3Research Institute of the McGill University Health Centre, Montreal, QC, Canada
Synopsis
The R1 relaxation rate of fat is a promising biomarker for mapping tissue oxygenation. Existing techniques to map fat R1 are limited to single-voxel or 2D imaging with long scan times. To address these limitations, this work presents a 3D technique to map fat R1 using a fat-water-separated variable flip angle (VFA) approach. The sensitivity of this technique to oxygenation variations was evaluated in a phantom. The results showed that fat R1 can be measured using a technique based on 3D VFA at 3 T and is feasible for MR-oximetry.
Introduction
The characterization of tissue oxygenation (pO2) with MRI, known as MR-oximetry, is interesting for the study of diabetes and fatty liver disease1, and in cancer, where the hypoxia commonly observed in solid tumors is known to reduce the efficacy of radiotherapy2. Fat R1 is a promising biomarker for MR-oximetry, more sensitive to oxygen variations (∆O2) than global R1 because oxygen is more soluble in fat than in water3. Existing techniques to measure fat R1 require an important presence of fat3, are limited to 2D imaging with long scan times1, or have only been demonstrated in single-voxel4,5 or region of interest (ROI) measurements6. To address these limitations, we present Fat DESPOT, a volumetric technique to map fat R1 on a voxel-wise basis using a variable flip angle (VFA) approach.Methods
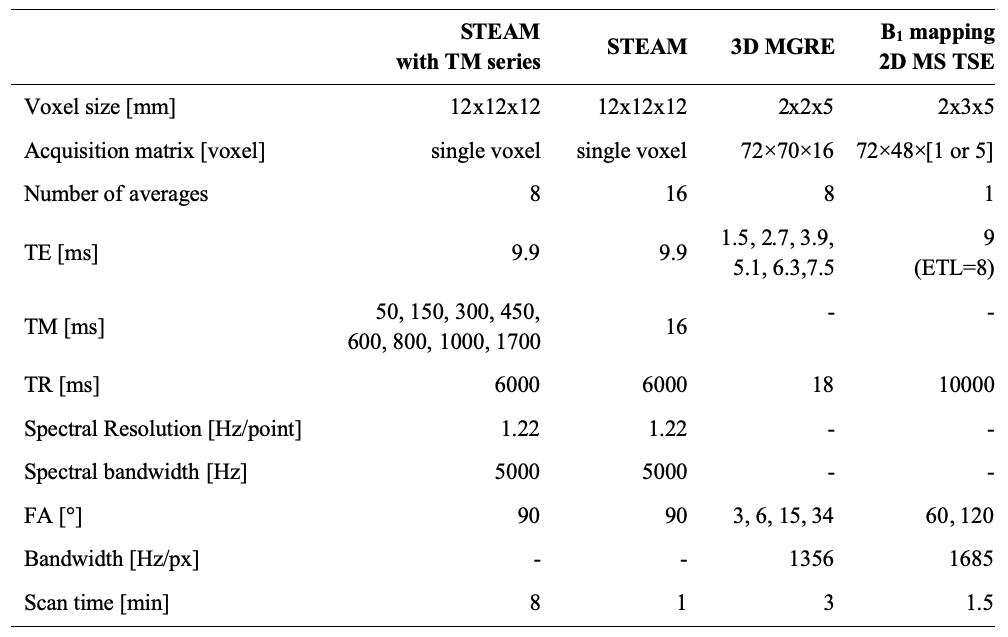
Dairy cream (fat fraction f = 35%) at room temperature was used as an approximation of fat in human tissue, in a phantom with six 50-ml cream-filled vials with controlled variations of oxygen concentration. Oxygenation was set by bubbling the cream with nitrogen (N2) or oxygen (O2) for controlled periods of time. After imaging, the O2 concentration was measured in each vial with a dissolved O2 meter (Orion Star A323, Thermo Fisher Scientific).Data were collected in a 3 T scanner (Ingenia, Philips) with an extremity coil. For Fat DESPOT R1 mapping, 3D three-echo gradient echo (MGRE) data were acquired with four flip angles (FA). For each FA, the sequence was run twice while changing the first echo time (TE), resulting in six echoes with an effective ∆TE of 1.2 ms. B1 mapping was performed using the dual angle method7. Reference R1 was measured in each phantom vial using a single-voxel STEAM MRS sequence with a series of mixing times (TM). The fat spectrum of dairy cream was obtained from STEAM data with minimum TM. Sequences parameters are listed in Table 1.
For voxel-wise fat and water R1 mapping with Fat DESPOT, the MGRE magnitude data was fitted with the following equation (with five fitting parameters: S0, R2*, f, R1w, R1f). This two-compartment model, based on previous work6, includes the measured fat spectrum (relative amplitude αp and frequency shift relative to water Δωp) and a B1 correction (on θn). The fit was performed separately with four (3°, 6°, 15°, 34°) and two (6° and 34°) FAs to evaluate the possibility of reducing the scan time. To assess the variability of Fat DESPOT, the MGRE measurements with two FAs were repeated seven times in one vial.
$$S(TE_i,\theta_n,TR)=S_0e^{-R_2^*TE_i}\left[(1-f)\frac{(1-e^{-R_{1_w}TR})\sin(\theta_n)}{1-e^{-R_{1_w}TR}\cos(\theta_n)} +f\frac{(1-e^{-R_{1_f}TR})\sin(\theta_n)}{1-e^{-R_{1_f}TR}\cos(\theta_n)}\sum_{p=1}^x(\alpha_pe^{i∆\omega_pTE_i})\right]$$
The STEAM MRS spectra were fitted with a nine-peak spectral model (eight fat peaks and the water peak) using least-squares fitting, after zeroth-order phase correction and apodization. For R1 calculation, the area (S) of three peaks (water and the two most abundant fat peaks, methylene and methyl) was fitted as a function of TM8 with non-linear least-squares using:
$$S=Ae^{-R_1TM} $$
Linear fits were performed on the estimates of R1 as a function of the measured O2 concentration, for Fat DESPOT and MRS STEAM, to extract the O2 relaxivity (slope in ms-1/ %O2). Fat and water R1 from Fat DESPOT were extracted in circular ROI in each vial. The experiment (Fat DESPOT and STEAM MRS) was repeated three times to evaluate the replicability.
Results and discussion
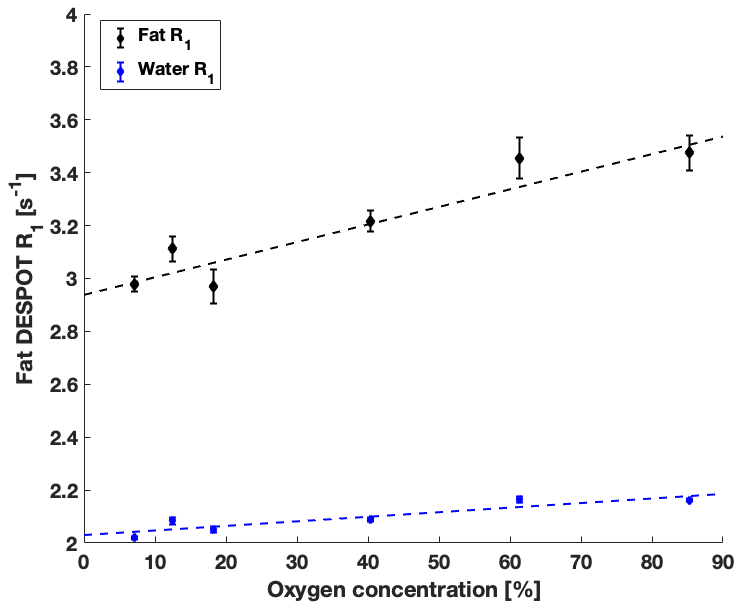
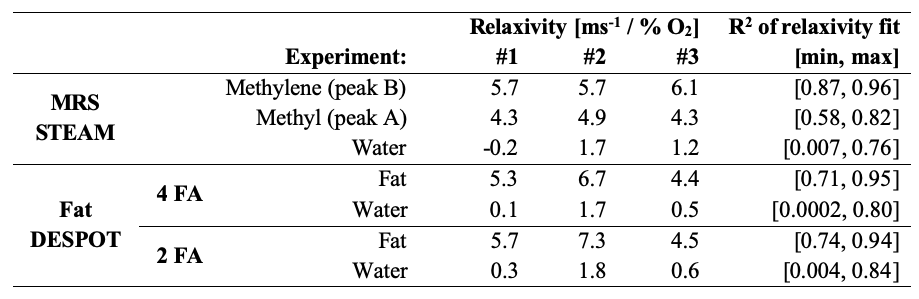
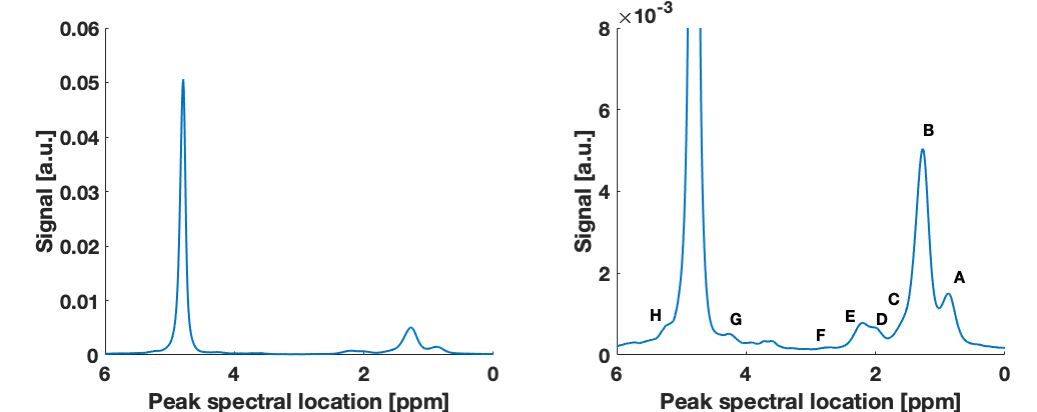
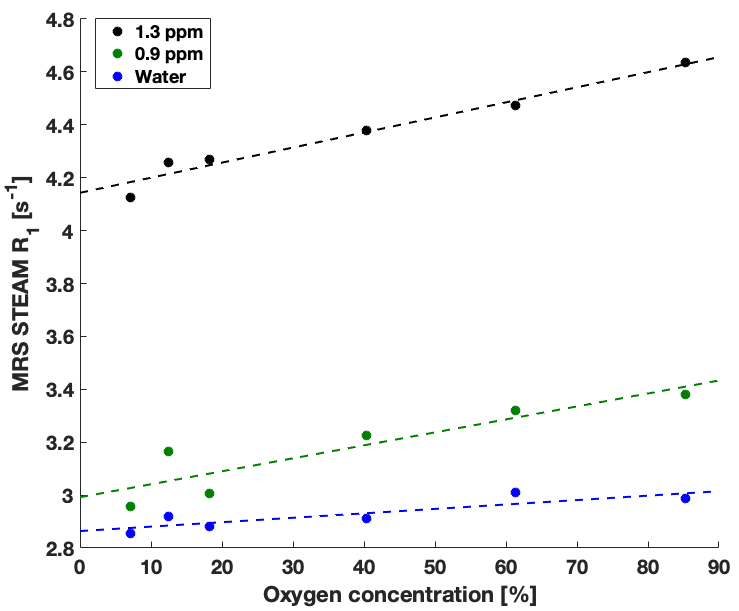
High quality Fat DESPOT fits were obtained in all voxels (R2>0.95). Fat R1 showed a higher O2 relaxivity than water R1 (Figure 1) and a stronger linear correlation (Table 2), as anticipated1. The four- and two-FA fits led to the same conclusions, enabling the reduction of scan time by a factor of two. Fat DESPOT also showed a low variability. The coefficients of variation (CV) over the seven scan repetitions of the mean fat R1, water R1, and fat fraction were below 3.5 %, much lower than a previous report using a similar method with a CV reaching 25%6.With STEAM MRS, the methyl and methylene peaks were well resolved (Figure 2). These peaks showed a significant linear correlation between R1 and O2 concentration (Table 2), consistent with a previous report4. The methyl and methylene R1 were more sensitive to O2 variations than the water R1 (Figure 3).
The O2 dependence in Fat DESPOT was consistent with the reference technique. Both showed the expected linear relationship between R1 and oxygen concentration, with a greater slope for fat R1 than water R1. The O2 relaxivity for fat (Table 2) was comparable between the two techniques. The results of Fat DESPOT and STEAM MRS were consistent between the three experiments.
Conclusion
This work demonstrated the feasibility of using a 3D VFA approach to measure fat R1 at 3 T in the context of oximetry. Fat DESPOT provides results consistent with literature and MRS measurements, and addresses the main limitations of existing methods through high-resolution 3D coverage in a clinically acceptable measurement time (<15 min). This technique could provide relevant information for personalized radiotherapy treatments in oncology to overcome the effects of hypoxia. It could also provide valuable information in other contexts where hypoxia is of interest, such as obesity-related metabolic diseases.Acknowledgements
The authors acknowledge the Body Magnetic Resonance research group (Technical University of Munich) for sharing their MRS processing software, the developers of the ISMRM fat water toolbox (http://www.ismrm.org/workshops/FatWater12/ data.htm), and Guillaume Gilbert (Philips Healthcare, Inc.), Atiyah Yahya (University of Alberta), and Jamie Near, Norma Ybarra, Zaki Ahmed, and Stella Xing (McGill University) for useful discussion. This work was funded by the Montreal General Hospital Foundation, the Research Institute of the McGill University Health Centre, and a Discovery Grant from the Natural Science and Engineering Research Council of Canada (NSERC). VF acknowledges fellowship support from NSERC, and partial support from the NSERC CREATE Medical Physics Research Training Network (Grant number: 432290).References
1. Franconi F, Lemaire L, Saint-Jalmes H, Saulnier P. Tissue oxygenation mapping by combined chemical shift and T 1 magnetic resonance imaging. Magn Reson Med. 2018;79(4):1981-1991. doi:10.1002/mrm.26857.
2. Zhao J, Du F, Luo Y, Shen G, Zheng F, Xu B. The emerging role of hypoxia-inducible factor-2 involved in chemo / radioresistance in solid tumors. Cancer Treat Rev. 2015;41(7):623-633. doi:10.1016/j.ctrv.2015.05.004.
3. Colliez F, Neveu MA, Magat J, Pham TTC, Gallez B, Jordan BF. Qualification of a noninvasive magnetic resonance imaging biomarker to assess tumor oxygenation. Clin Cancer Res. 2014;20(21):5403-5411. doi:10.1158/1078-0432.CCR-13-3434.
4. Morozov D, Quirk JD, Beeman SC. Towards MR-based interrogation of adipose tissue pO2 . In: Proceedings of the 27th Annual Meeting of ISMRM, Montreal, Quebec, Canada, 2019. Abstract 1936.
5. Beeman SC, Smith G, Garbow JR, Jh J. Towards validation and non-invasive interrogation of the hypoxia-driven insulin resistance hypothesis. In: Proceedings of the 25th Annual Meeting of ISMRM, Honolulu, Hawaii, USA, 2017. Abstract 3679.
6. Le Ster C, Gambarota G, Lasbleiz J, Guillin R, Decaux O, Saint-Jalmes H. Breath-hold MR measurements of fat fraction, T1, and T2* of water and fat in vertebral bone marrow. J Magn Reson Imaging. 2016;44(3):549-555. doi:10.1002/jmri.25205.
7. Boudreau M, Tardif CL, Stikov N, Sled JG, Lee W, Pike GB. B 1 mapping for bias-correction in quantitative T 1 imaging of the brain at 3T using standard pulse sequences. J Magn Reson Imaging. 2017;DOI: 10.10. doi:10.1002/jmri.25692.
8. Brix G, Heiland S, Bellemann ME, Koch T, Lorenz WJ. MR imaging of fat-containing tissues: Valuation of two quantitative imaging techniques in comparison with localized proton spectroscopy. Magn Reson Imaging. 1993;11(7):977-991. doi:10.1016/0730-725X(93)90217-2.
Figures