3148
Assessment of R2* dependency on fiber orientation and myelin concentration in normal-appearing white matter in multiple sclerosis1Medical Physics Group, Institute of Diagnostic and Interventional Radiology, Jena University Hospital - Friedrich Schiller University Jena, Jena, Germany, 2Department of Radiology, University Hospital Halle (Saale), Halle, Germany, 3Department of Neurology, Medical University of Graz, Graz, Austria, 4Michael Stifel Center Jena for Data-Driven and Simulation Science, Friedrich Schiller University Jena, Jena, Germany, 5Abbe School of Photonics, Friedrich Schiller University Jena, Jena, Germany, 6Center of Medical Optics and Photonics, Friedrich Schiller University Jena, Jena, Germany
Synopsis
The effective transverse relaxation rate (R2*) is increasingly used in quantitative MRI, due to its sensitivity to iron and myelin content of the tissue. Separating the contributions from both sources is of particular interest in relation to multiple sclerosis. This work attempts to factor out contribution from myelin using orientation information derived from dMRI, and magnetization transfer saturation (MTS). Application of such correction to a group of multiple sclerosis patients and a control group, suggests that sensitivity of R2* to iron might be improved by accounting for fiber orientation in WM, while incorporation of MTS might not show clear benefit.
Introduction
Alternation of iron content in normal-appearing white matter (NAWM)1 in multiple sclerosis (MS) makes the effective transverse relaxation rate $$$R_2^*$$$ particularly interesting candidate for non-invasive assessment of tissue iron content2. In white matter, however, $$$R_2^*$$$ is not only affected by presence of iron but also by tissue's myelin content as well as its microstructural organization3,4. A number of models to describe such dependency has been proposed in the literature5,6. Adopting two models from Lee et al.6, our study attempts to relate $$$R_2^*$$$ with measures, sensitive to myelin concentration and orientation of myelinated axons, to more accurately assess changes in NAWM iron content.Materials and Methods
Sixty MS patients (age 20y–60y, median age 38y; 33 female) and 60 healthy controls (age 25y–67y, median age 33; 33 female) were examined on two different sites with two identical 3T MRI systems (Siemens Prisma) using identical 20 channel head-coils.The acquisition protocol included three 3D multi-echo GRE sequences (PDw, T1w, and MTw) used to obtain the $$$R_2^*$$$ and magnetization transfer saturation (MTS) following the multi-parameter mapping approach7 (FA=6°/6°/35° for PDw/MTw/T1w; TE 1–5=8.12/13.19/19.26/24.33/29.4 ms for PDw/T1w and TE 1–2=8.12/13.19 for MTw; TR=37ms; monopolar readout, bandwidth=280Hz/px, voxel size=1mm×1mm×1mm). MTS was corrected for transmit field inhomogeneities using a $$$B_1^+$$$ map (Turbo-FLASH, voxel size=3.5mm×3.5mm×3.5mm). Two diffusion-weighted scans (voxel size=1.5mm×1.5mm×1.5mm; TR=3300ms; TE=84ms) with reversed phase encoding polarities and multi-shell diffusion scheme (8, 16, 32, and 48 directions with b-values of 0, 835, 1665 and 2500s/mm2, respectively) were acquired to assess the orientation of WM fiber bundles with respect to the static magnetic field. FLAIR scan (voxel size=0.9mm×0.9mm×3.0mm) was acquired to assess subject's condition.
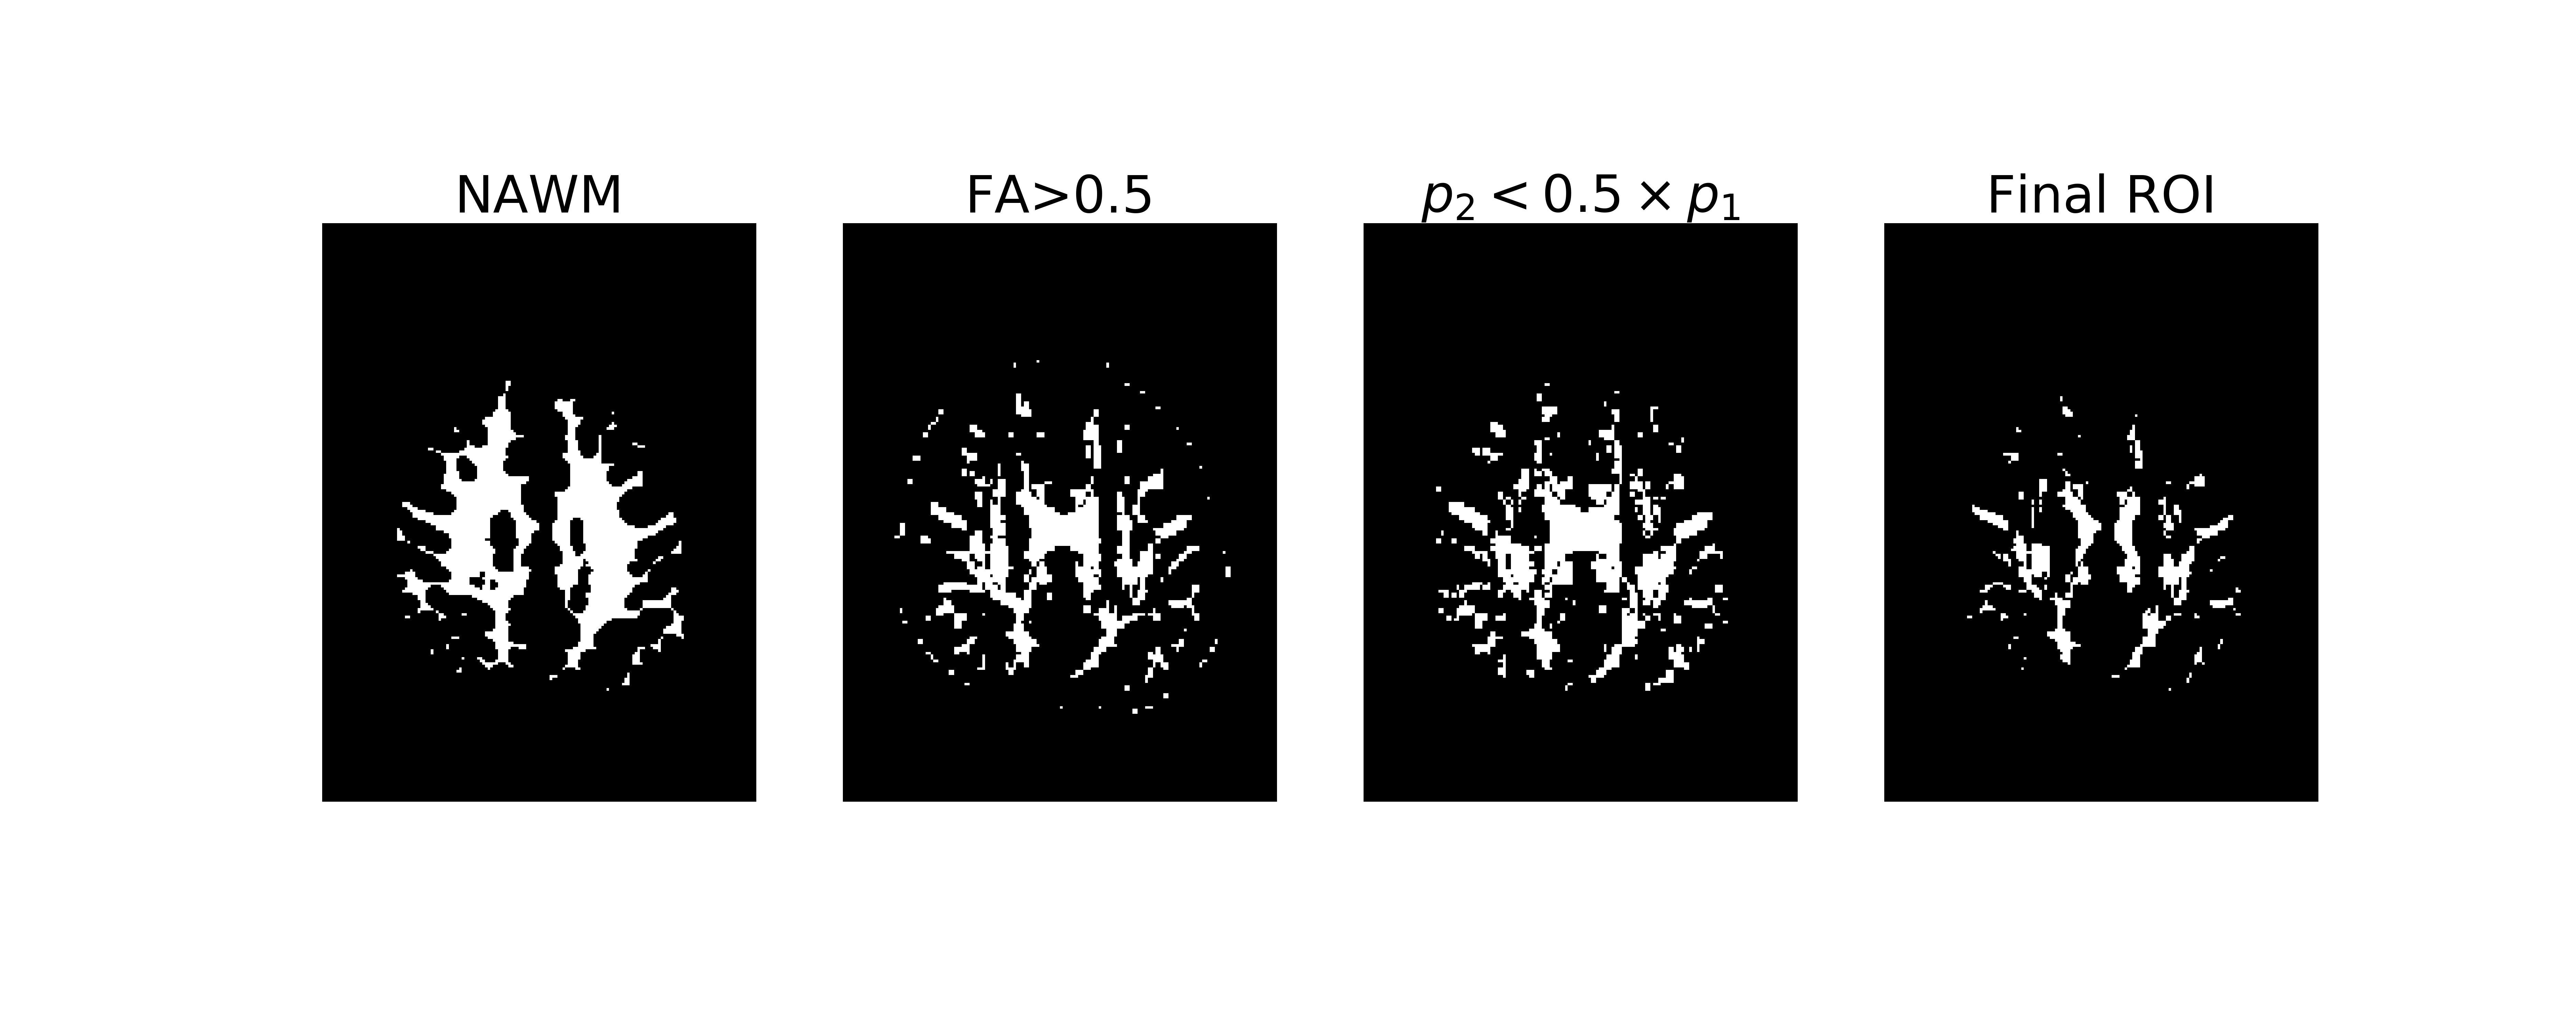
For each subject FLAIR, PDw, and MTw scans were rigidly registered to the T1w GRE data using Aladin from NiftyReg8. $$$R_2^*$$$ maps were calculated from T1w GRE acquisition via monoexponential linear fit. Diffusion acquisitions were combined, distortion-corrected using FSL9,10. The DTI model was fitted to obtain fractional anisotropy (FA), and predominant fiber orientation was determined using constrained spherical deconvolution11. Fiber orientation was computed as the angle $$$\theta$$$ between the first ODF peak and the $$$B_0$$$ direction. FA and $$$\theta$$$ were transformed to the multi-echo T1w space based. White matter segmentation was obtained with Freesurfer12 based on the first echo of T1w GRE data. From it, NAWM mask was obtained by subtracting MS lesions, identified by a radiologist based on FLAIR images. NAWM mask was additionally eroded with a sphere of radius 2mm. To exclude crossing fibers, voxels with FA<0.5 and the second peak of the ODF grater than 50% of the first peak were removed from the mask (see Figure 1).
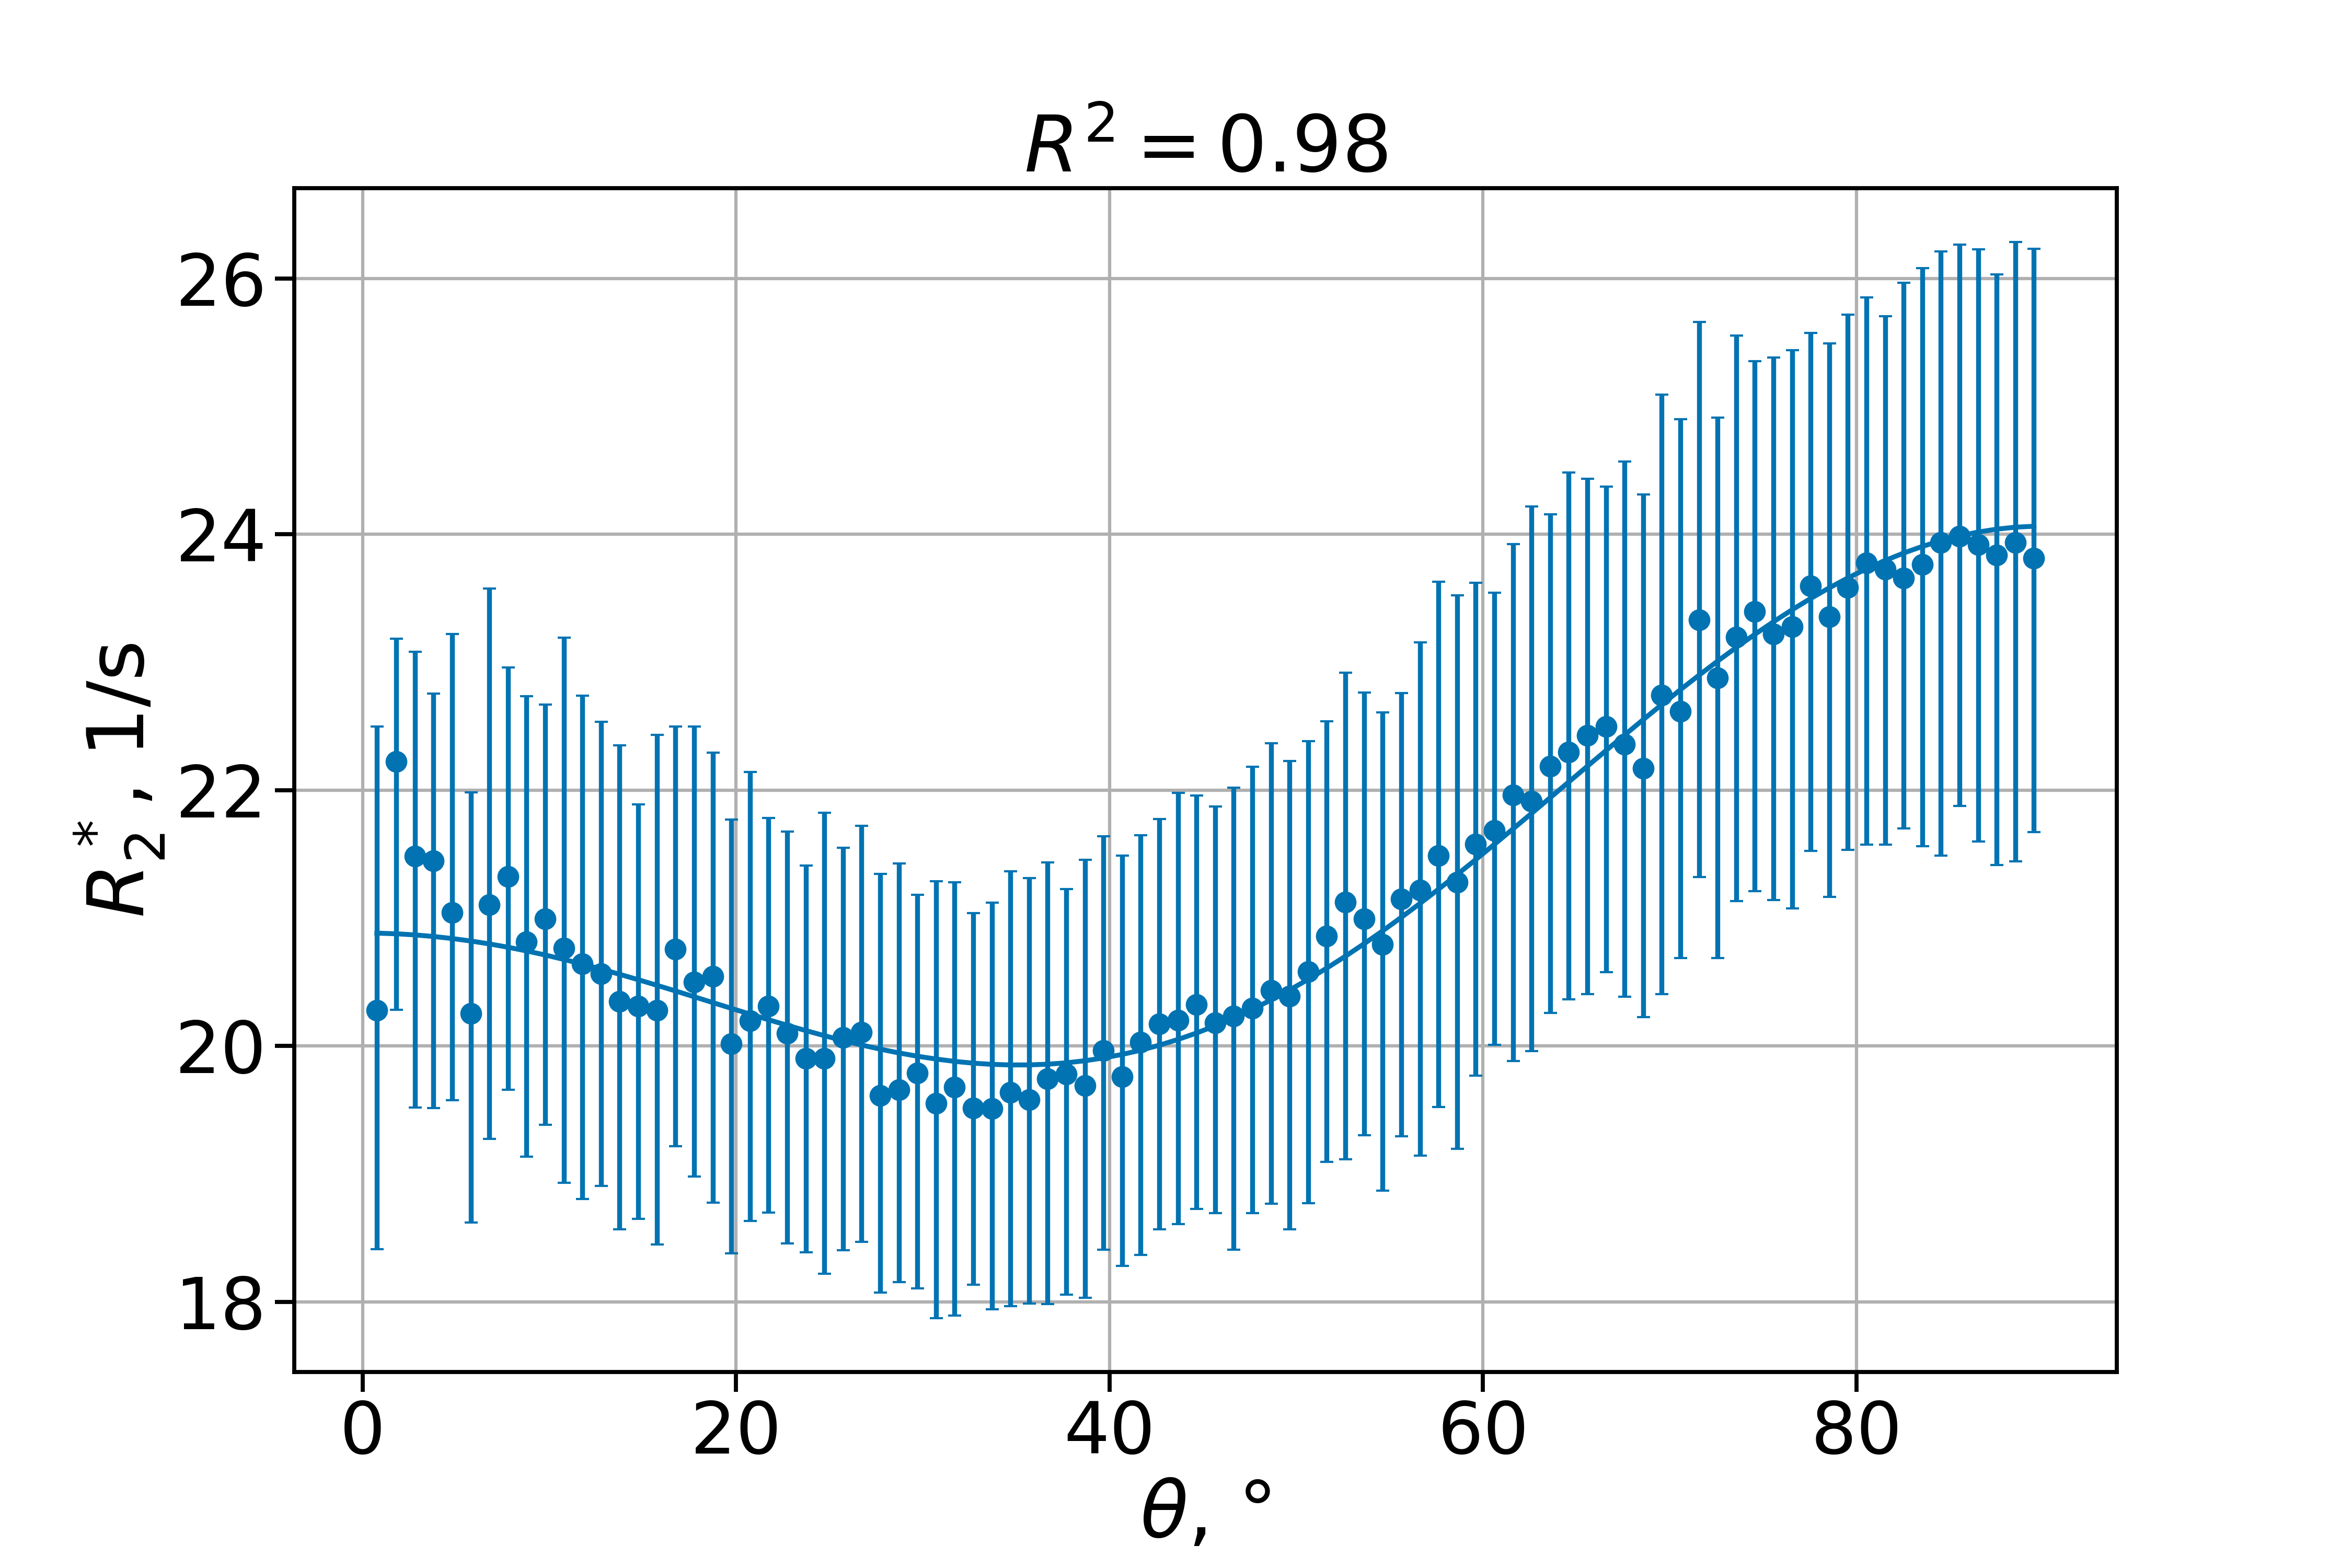
Two models of $$$R_2^*$$$ orientation and/or myelin concentration dependency from6 were adopted in the study. Model 1 related $$$R_2^*$$$ with orientation of WM fibers:
$$R_{2}^{*} = a_{0} + a_{1}\cos^{2}\theta + a_{2}\cos^{4}\theta,$$
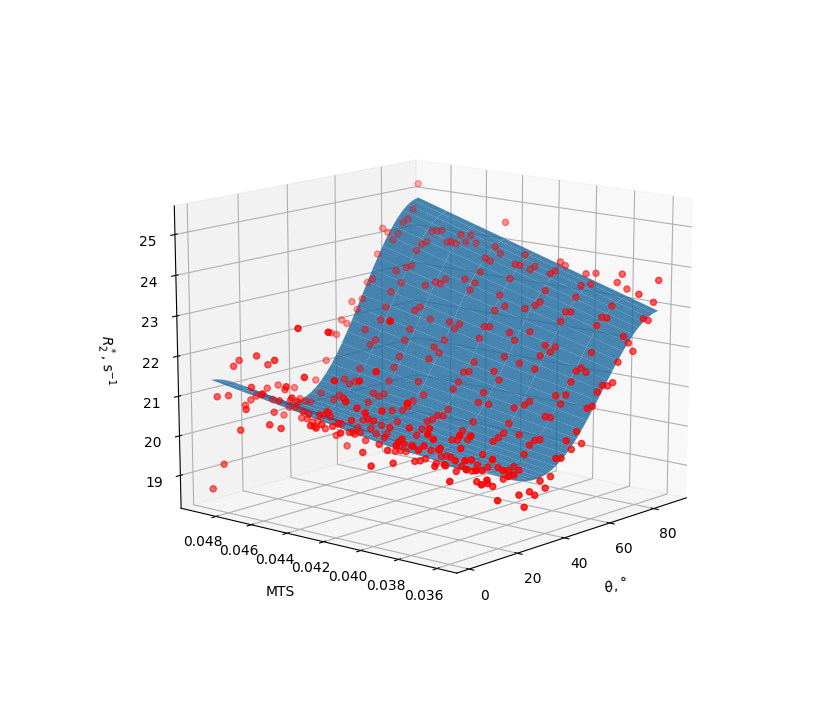
whereas model 2 included fiber orientation and MTS ($$$\delta$$$):
$$R_{2}^{*} = b_{0} + \delta(b_{1} + b_{2}\cos^{2}\theta + b_{3}\cos^{4}\theta).$$
Data were binned and models were fitted to median $$$R_2^{*}$$$ (model 1: $$$\Delta\theta=1^\circ$$$, model 2: $$$\Delta\theta\times\Delta\delta\approx 2^{\circ}\times 0.002$$$).
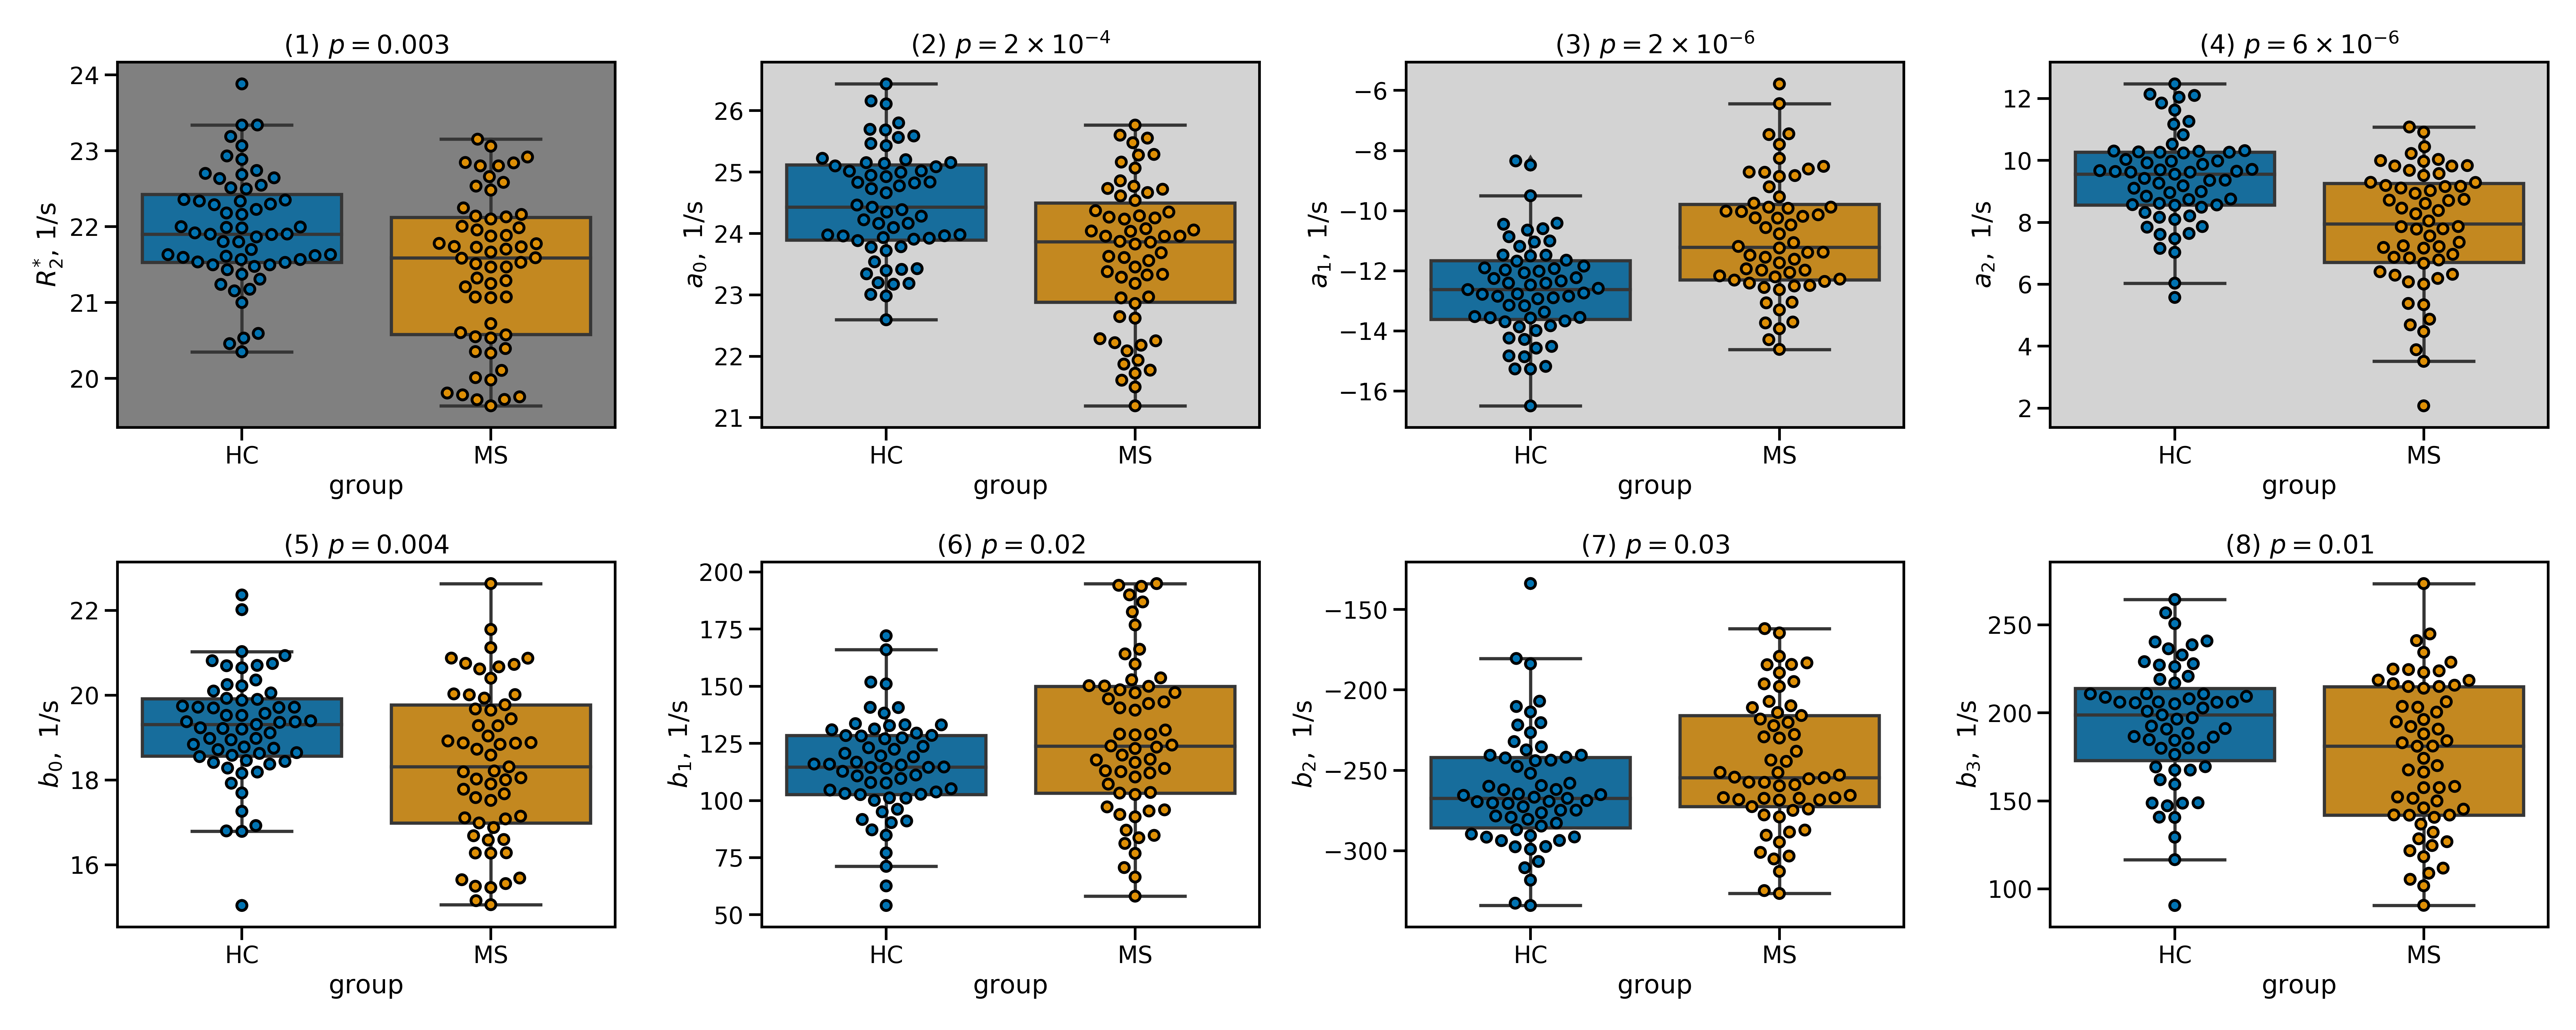
Mann-Whitney U test was applied to resulted distributions across the two groups. The significance is reported along with Glass' effect size $$$\Delta$$$.
Results
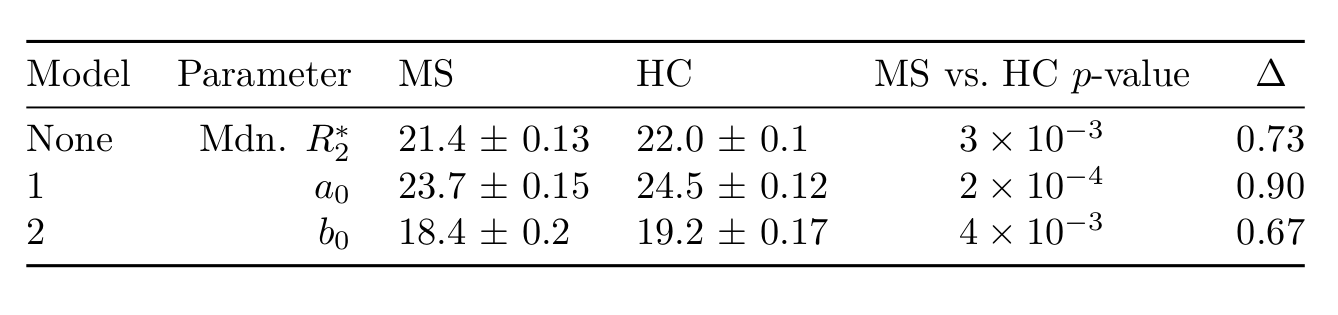
Figures 2 and 3 illustrate the fit of models 1 and 2 to the data from a representative subject. Model 1 captures most of the data variance ($$$R^2=0.98$$$), and model 2 responds to weakly MTS relatively weakly.Figure 4 shows fitted parameters alongside with median $$$R_{2}^{*}$$$ across the entire ROI. Of all fitting parameters, $$$a_0$$$ and $$$b_0$$$ can be interpreted as global $$$R_2^{*},$$$ corrected for orientation anisotropy and contribution from myelinated axon correspondingly. Similarly to global median $$$R_2^{*}$$$, they appear to be decreased in MS group (see Table 1) which is consistent with previously reported decrease in iron content of NAWM1.
Discussion
As can be seen from effect size in Table 1, when model 1 factors orientation-dependency out of global $$$R_2^{*},$$$ residual orientation-independent transverse relaxivity $$$a_{0}$$$ shows bigger separation between the groups. One possible explanation can be better sensitivity of $$$a_0$$$ to decreased iron content in NAWM, which is otherwise overshadowed in $$$R_2^{*}$$$ by contributions from myelin.As can be seen from Figure 3, inclusion of MTS does not substantially change the behavior of the corresponding model parameters, which agrees with the fact that the data in Figure 2 show only weak dependency on MTS. It might suggest that MTS may lack sensitivity to myelin concentration, which is necessary to explain $$$R_2^{*}$$$ variation in WM, as MWF did in6. Such lack of sensitivity may explain lower fit quality as reflected in lower $$$R^2$$$ values for model 2 (see Figure 4) and consequently lower effect size.
Conclusion
Combination of multiple modalities of MRI offers a possibility to untangle contributions to $$$R_2^{*}$$$ from such sources as iron and myelin, potentially increasing specificity to pathological changes in either of the parameters. Particularly, this work suggests that accounting for $$$R_2^{*}$$$ anisotropy in WM based on concomitant diffusion acquisition may increase sensitivity to the decrease in iron content in NAWM in MS.Despite previously shown success in increasing homogeneity of $$$R_2^{*}$$$ maps relating it with myelin content6, current work suggests that MTS might not be as suitable for the purpose as previously reported MWF.
Acknowledgements
The study was supported by the German Research Foundation (DFG, DE2516/1-1, RE1123/21-1) and the Austrian FWF (I 3001-B27).References
1. Hametner S, Wimmer I, Haider L, et al. Iron and neurodegeneration in the multiple sclerosis brain. Ann Neurol. 2013 Dec;74(6):848-61.
2. Langkammer C, Krebs N, Goessler W, et al. Quantitative MR imaging of brain iron: a postmortem validation study. Radiology. 2010 Nov;257(2):455-62.
3. Bender B, Klose U. The in vivo influence of white matter fiber orientation towards $$$B_0$$$ on $$$T_2^*$$$ in the human brain. NMR in biomedicine. 2010 Nov;23(9):1071-6.
4. Denk C, Torres EH, MacKay A, Rauscher A. The influence of white matter fibre orientation on MR signal phase and decay. NMR in Biomedicine. 2011 Apr;24(3):246-52.
5. Lee J, van Gelderen P, Kuo LW, et al. $$$T_2^*$$$-based fiber orientation mapping. Neuroimage. 2011 Jul 1;57(1):225-34.
6. Lee J, Shin HG, Jung W, et al. An $$$R_2^*$$$ model of white matter for fiber orientation and myelin concentration. Neuroimage. 2017 Nov 5;162:269-75.
7. Weiskopf N, Suckling J, Williams G, et al. Quantitative multi-parameter mapping of R1, PD*, MT, and $$$R_2^*$$$ at 3T: a multi-center validation. Frontiers in neuroscience. 2013 Jun 10;7:95.
8. Ourselin S, Roche A, Subsol G, et al. Reconstructing a 3D structure from serial histological sections. Image and vision computing. 2001 Jan 1;19(1-2):25-31.
9. Andersson JL, Skare S, Ashburner J. How to correct susceptibility distortions in spin-echo echo-planar images: application to diffusion tensor imaging. Neuroimage. 2003 Oct 1;20(2):870-88.
10. Andersson JL, Sotiropoulos SN. An integrated approach to correction for off-resonance effects and subject movement in diffusion MR imaging. Neuroimage. 2016 Jan 15;125:1063-78.
11. Tournier JD, Calamante F, Connelly A. Robust determination of the fibre orientation distribution in diffusion MRI: non-negativity constrained super-resolved spherical deconvolution. Neuroimage. 2007 May 1;35(4):1459-72.
12. Desikan RS, Ségonne F, Fischl B, et al. An automated labeling system for subdividing the human cerebral cortex on MRI scans into gyral based regions of interest. Neuroimage. 2006 Jul 1;31(3):968-80.
Figures