3147
Alternating 3D Unbalanced SSFP With Z-shimming for Background Field Corrected R2’ Measurement in the Human Brain1Radiology, University of Pennsylvania, Philadelphia, PA, United States, 2Electrical and Electronic Engineering, Yonsei University, Seoul, Korea, Republic of
Synopsis
The relaxation parameter R2’ characterizes susceptibility-induced voxel signal modulations, for example, in the presence of deoxygenated hemoglobin in brain microvasculature or iron deposits in deep gray matter structures. Current R2’ measurement methods build on a spin-echo sequence configuration, and hence require impractically long scan time for volumetric 3D R2’ mapping. Furthermore, large susceptibility gradients around air/tissue interfaces result in signal distortions with increasing echo times, thus making it challenging to achieve accurate R2’ estimation in deep GM regions. Here, we propose an alternating, 3D z-shimmed, unbalanced steady-state-free-precession (SSFP) technique for rapid and B0-corrected R2’ mapping in the human brain.
Introduction
The transverse relaxation rate parameter R2* represents the rate of free-induction-decay (FID) in the absence of macroscopic magnetic field (B0) gradients. It is composed of reversible (R2’) and irreversible (R2) contributions as R2*=R2+R2’. R2’ is of particular interest as it characterizes susceptibility-induced voxel signal modulations, for example, in the presence of deoxygenated hemoglobin in brain microvasculature1 or iron deposits in deep gray matter (GM) structures2. Currently practiced R2’ measurement methods3 build on a spin-echo sequence configuration to eliminate the R2 effect, and hence require impractically long scan time for volumetric 3D R2’ mapping. Furthermore, large susceptibility gradients around air/tissue interfaces result in signal distortions with increasing echo times (TE), thus making it challenging to achieve accurate R2’ estimation in deep GM regions. Here, we propose an alternating, 3D z-shimmed, unbalanced steady-state-free-precession (SSFP) technique for rapid and B0-corrected R2’ mapping in the human brain.Methods
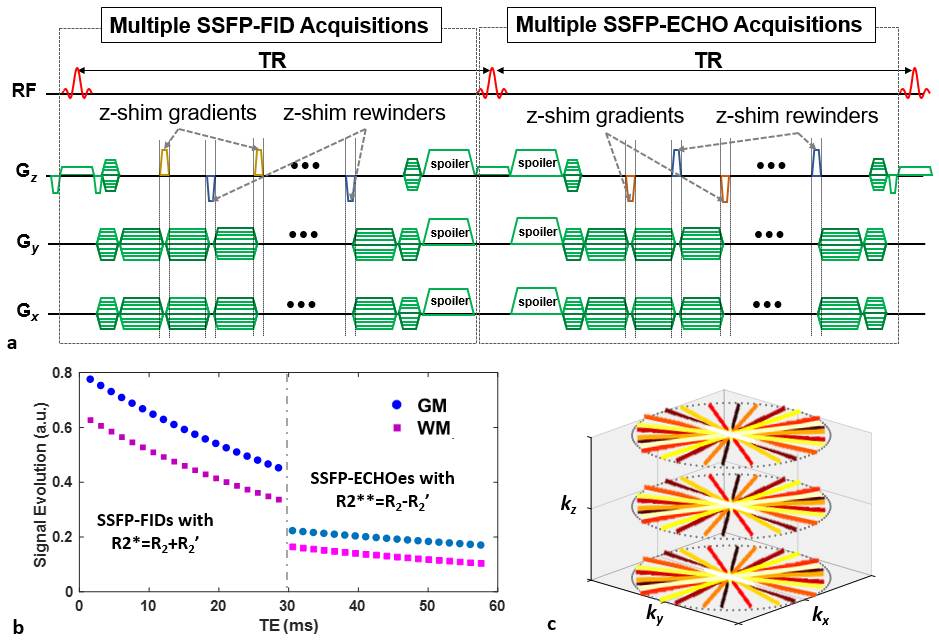
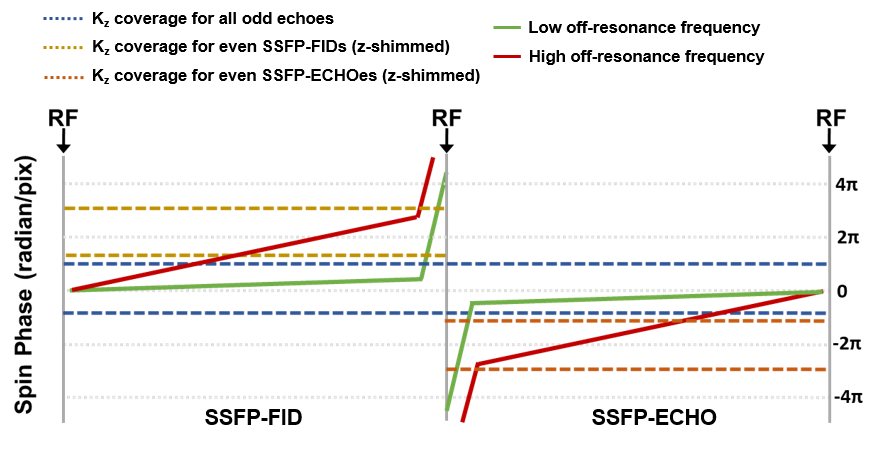
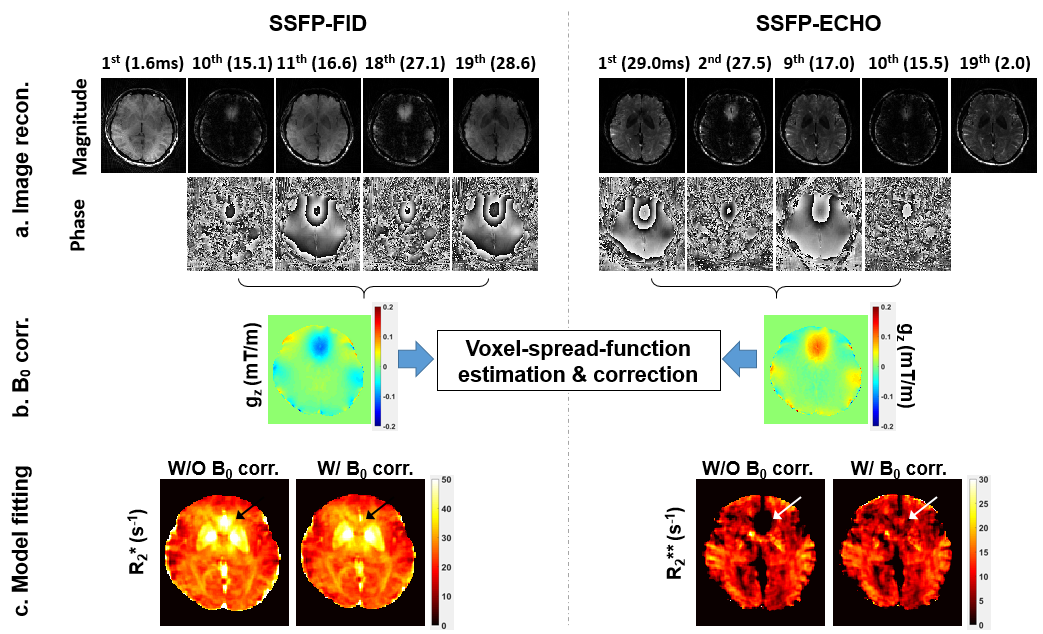
Sequence configuration: Figure 1a shows a timing diagram of the proposed pulse sequence. SSFP-FID and SSFP-ECHO modules are alternating along the entire echo train, while producing a plurality of gradient-recalled echo signals within each time-of-repetition (TR). The temporal evolution of these two sets of signals can be expressed in terms of rate constants, R2* (=R2+R2’) and R2** (=R2-R2’), for SSFP-FID and SSFP-ECHO, respectively (Fig. 1b). It is noted that this scheme is essentially analogous to the GESFIDE method4, but runs in a steady-state regime, thereby allowing rapid encoding of the relaxation information. Second, a radial stack-of-stars k-space sampling scheme (Fig. 1c) is employed so as to make the method relatively immune to physiologic motions5 that manifest as ghosting artifacts in Cartesian sampling. Finally, z-shim gradients and corresponding rewinders are alternately inserted along the z-axis (Fig. 1a) as in Han et al.6, making every even echo z-shimmed and thereby able to capture signals in regions with large B0 gradients (gz). The polarity of the z-shim gradients in SSFP-ECHO is reversed relative to that in SSFP-FID to account for the phase-reversal effect of the SSFP-ECHO signal mechanism. Figure 2 represents a simplified extended phase diagram for the present pulse sequence.Data processing: Figure 3 illustrates a three-step data processing scheme consisting of image reconstruction, B0 correction, and model fitting. K-space data were Fourier-transformed along the through-plane direction, followed by 2D gridding reconstruction for individual slices. Subsequently, a gz map, obtained using the phase images from both SSFP-FID and SSFP-ECHO, was used to estimate the voxel-spread-function (VSF) along the z-direction. Briefly, the VSF method7 approximates a B0 inhomogeneity induced voxel signal modulation as convolution of a signal-leakage function (VSF) with ideal signals in the neighboring voxels, leading to the correction of such effect. It has previously been shown that incorporating z-shimmed signals in the VSF method improves the accuracy of R2* estimation in regions with large gz values6. Finally, mono-exponential fitting of the B0-corrected signals was performed voxel-by-voxel to yield R2* and R2** from SSFP-FID and SSFP-ECHO multi-echo data, leading to R2 = (R2*+R2**)/2 and R2’ = (R2*-R2**)/2 maps.
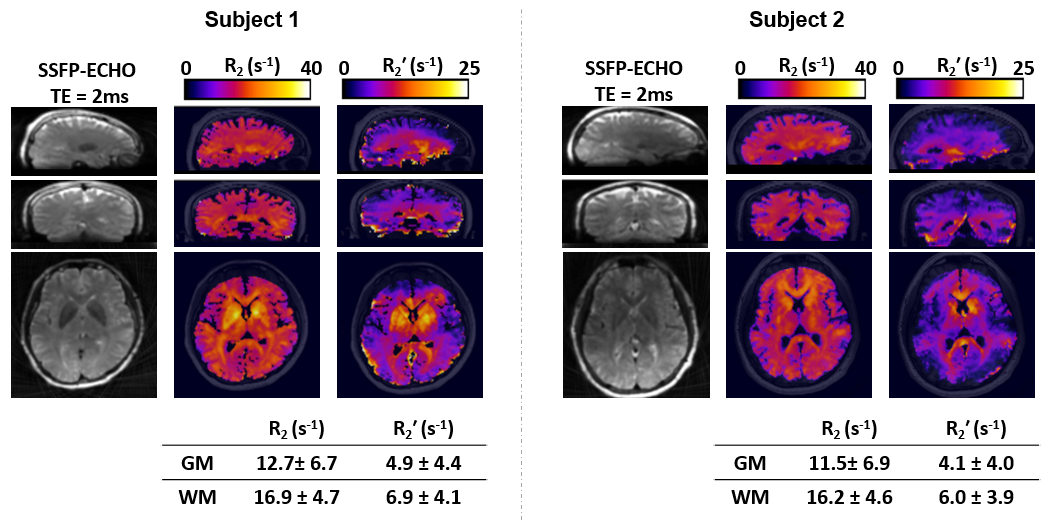
In vivo experiments: Experiments were performed at 3 T (Siemens Prisma) in two healthy subjects. A 32-channel head coil was used for signal reception. Imaging parameters were: TR = 32 ms, echo-spacing = 1.5 ms, number of echoes = 19, number of radial views = 160; FOV = 240 x 240 x 120 mm3, image matrix size = 160 x 160 x 40, voxel size = 1.5 x 1.5 x 3 mm3, slice oversampling factor = 25%, and scan time = 8.5 min. High-resolution T1-weigthed images were additionally acquired for brain segmentation with SPM12 software8. Derived R2 and R2’ maps were overlaid onto the T1-weighted images, while those in each voxel were averaged over segmented gray matter (GM) and white matter (WM) regions, respectively.
Results
Figure 3c shows the effectiveness of the present B0 correction approach (z-shimming in combination with the VSF method). Without B0 correction, both R2* and R2** are erroneously estimated in regions where the magnetic field varies rapidly (corresponding to high gz in Fig. 3b), while with correction such errors are largely eliminated. Figure 4 shows R2 and R2’ maps in the three orthogonal planes, obtained in the two subjects (see Figure 4 for regional averages of the two parameters). Heavily T2-weighted images (SSFP-ECHO at TE=2ms) are also provided as anatomical reference, particularly for deep GM structures in which, compared to cortical GM areas, both R2 and R2’ are substantially overestimated.Discussion and Conclusions
The unbalanced SSFP-based approach makes it possible to achieve rapid 3D encoding of transverse relaxation parameters, while the VSF model with z-shim gradients allows estimation of those parameters in regions with strong B0 inhomogeneity. While regional averages of R2 (Fig. 4) agree well with literature values9, R2’ values are higher than those reported by Ni et al.’s3, which may be attributed to the large R2’ values obtained in deep GM regions known to be rich in non-heme iron10, an issue that warrants further scrutiny with larger number of subjects and compartmentalized analysis. Upon further validation, the present method may serve as a tool for quantification of metabolic parameters as well as iron content covering much of the brain including regions suffering from large intrinsic gradients.Acknowledgements
NIH grants R21EB022687 and UL1TR001878References
1. Yablonskiy DA, Sukstanskii AL, He X. Blood oxygenation level-dependent (BOLD)-based techniques for the quantification of brain hemodynamic and metabolic properties – theoretical models and experimental approaches. NMR in Biomedicine 2013;26:963-986.
2. Sedlacik J, Boelmans K, Lobel U, Holst B, Siemonsen S, Fiehler J. Reversible, irrerversible and effective transverse relaxation rates in normal aging brain at 3T. NeuroImage 2014;84:1032-1041.
3. Ni W, Christen T, Zun Z, Zaharchuk G. Comparison of R2’ measurement methods in the normal brain at 3 Tesla. Magnetic Resonance in Medicine 2015;73:1228-1236.
4. Ma J, Wehrli FW. Method for image-based measurement of the reverible and irreversible contribution to the transverse-relaxation rate. J Magn Reson B 1996;111:61-69.
5. Block KT, Chandarana H, Milla S, Bruno M, Mulholland T, Fatterpekar G, Hagiwara M, Grimm R, Geppert C, Kiefer B, Sodickson DK. Towards routine clinical use of radial stack-of-stars 3D gradient-echo sequences for reducing motion sensitivity. JKSMRM 2014;18:87-106.
6. Han D, Nam Y, Gho SM, Kim DH. Volumetric R2* mapping using z-shim multi-echo gradient echo imaging. Magnetic Resonance in Medicine 2015;73:1164-1170.
7. Yablonskiy DA, Sukstanskii AL, Luo J, Wang X. Voxel spread function method for correction of magnetic field inhomogeneity effects in quantitative gradient-echo-based MRI. Magnetic Resonance in Medicine 2013;70:1283-1292.
8. Penny W, Friston K, Ashburner J, Kiebel S, Nichols T. Statistical parametric mapping: The analysis of functional brain images. Elsevier 2016.
9. Gelman N, Gorell JM, Barker PB, Savage RM, Spickler EM, Windham JP, Knight RA. MR imaging of human brain at 3.0T: preliminary report on transverse relaxation rates and relation to estimated iron content. Radiology 1999;210:759-767.
10. Hallgren B, Sourander P. The effect of age on the non-haemin iron in the human brain. Journal of Neurochemistry. 1958;3:41-51.
Figures