3146
Towards understanding of CEST signal in breast cancer; relation between APT- MT- and B1 effects.
Elles Elschot1, Lieke van den Wildenberg1, Vitaly Khlebnikov1, Dennis Klomp1, and Jannie Wijnen1
1Radiology Department, UMC Utrecht, Utrecht, Netherlands
1Radiology Department, UMC Utrecht, Utrecht, Netherlands
Synopsis
This study investigates
the relation between B1+ and signal amplitude of the APT and MT exchange pools in CEST MRI. We examined 19 breast
cancer patients that underwent NAC treatment with CEST MRI at 7T. The data
indicates evidence for an extra exchanging pool with strong B1
dependence, that is more abundant in tumor tissue compared to healthy tissue. By
identifying the exchanging components in this pool, a new biomarker for tumor
tissue could be found and used to understand changes in response to NAC early
during treatment.
Introduction
Nowadays neoadjuvant chemotherapy (NAC) is the preferred treatment for early-stage breast cancer. NAC is a systemic therapy whereby cytotoxic drugs are administered before surgery or radiation therapy, with the intention to reduce tumor size and make breast conserving surgery possible for patients who otherwise required mastectomy.1,2 However 30% of the patients do not respond to NAC3 and for these patients it would be beneficial to predict the pathological response early on in the course of treatment, to properly adjust the treatment for every patient individually. In this study, changes in metabolism of tumor tissue are investigated using amide proton transfer (APT) CEST MRI at an ultra-high field MR system (7T). The concentration of proteins and the intracellular exchange rate is increased in tumor tissue.4,5 Dula et al. showed that NAC may have an effect on these features.6 APT CEST at high-field benefits from high signal to noise ratio (SNR) and increased chemical shift dispersion, making the technique reproducible with a high level of precision and improving the sensitivity of APT signals to therapeutic response.7 Moreover, at higher field strengths, the wavelength of the radio frequency pulse is reduced, resulting in transmit (B1+) field inhomogeneities that can be used to study CEST contrast mechanism in detail. This study was performed to evaluate the effect of B1+ on CEST MRI in breast cancer patients at an ultra-high-field MR system.Methods
CEST MRI was performed in 19 breast cancer patients treated with NAC before and after the first cycle of chemotherapy on a whole-body 7T MR scanner (Achieva, Philips Health Care, Cleveland, OH, USA) in prone position using a dual-quadrature double-tuned radiofrequency coil.8 A series of 20 sinc-Gauss RF-saturation pulses (pulse duration: 100ms, inter pulse delay: 100ms, nominal B1+ peak amplitude: 2µT) resulting in a 4s saturation train (50% duty cycle) followed by a gradient-echo readout.9 33 Frequency offsets were acquired resulting in a scan time of 4:55min. These offsets were not equally distributed over the frequencies; more offsets were obtained around the amide peak (3.5 ppm) and the water peak (0.0 ppm) for better fitting of these resonances. The frequency offsets associated with the nuclear Overhauser effect (NOE) were not included due to signal distortions by unsuppressed lipid resonances. CEST images were B0 corrected using the original CEST spectra as input for the WASSR method10 and quantified using a three-pool Lorentzian fit (water, APT and metabolic transfer (MT)) of the Z-spectra in the tumor as well as in healthy tissue. The calculated APT and MT maps were obtained using the amplitude of the fits. Tumor tissue masks were obtained using a region growing algorithm on intensity difference images of the first and last acquisition of a dynamic contrast series (Figure 1). The correlation between B1+ and CEST signal was investigated for APT and MT and compared between healthy and tumor tissue. Because the quality of the B1+ maps acquired (AFI, TE=1.981ms, TR1=40ms, TR2=200ms, FA=30°) is suboptimal in some regions where B1+ is low, the template approach developed by Rijssel et al. was used.11 The simulated B1+ distribution of the generic template12 was scaled to patient specific values using a linear least squares approach between the template and the measured B1+ maps for both breasts separately.Results
Figure 2 shows the results of the three pool Lorentzian fitting of the Z-spectrum of one patient. Looking at the correlation between APT and B1+, healthy tissue showed a positive correlation (R2=0.12747; Figure 3). However, in the tumor tissue a negative correlation between APT and B1+ was observed (R2=0.50093). The MT signal showed a positive correlation with B1+ in healthy tissue (R2=0.48253) and an even stronger positive correlation in tumor tissue (R2=0.70834; Figure 4). These results indicate that an additional pool is present in the tumor tissue, which might cause overfitting of MT and under fitting of APT.Discussion
As can be seen in Figures 3 and 4 the B1+ field has a certain effect on the data. An increase in absolute intrinsic signal is expected considering the relation of B1+ with B1-. The remaining effect could be explained by an additional exchange pool with strong B1+ dependence, which results in imperfect fitting of MT and APT. Further research is needed to identify and quantify the exchanging metabolites in the “hidden pool” we found in our data. The stronger increase at higher B1+ points to a fast exchanging molecule at lower ppm.Conclusion
This study shows an indication for an exchange pool with strong B1+ dependence, that is more abundant in tumor tissue compared to healthy tissue. By identifying the metabolites in this pool a new biomarker for tumor tissue could be found and used to understand changes in response to NAC early during treatment.Acknowledgements
We would like to thank the Dutch Cancer Society (Alpe d'Huzes project number: UU 2013‐6302) for financial support.References
- Beasley G, Olson J, What’s new in neoadjuvant therapy for breast cancer? Advances in Surgery. 2010;44(1):199.
- Van der Hage J, Van de Velde C, Julien J, et al. Preoperative chemotherapy in primary operable breast cancer: Results from the European Organization for Research and Treatment of Cancer Trial 10902, Journal of Clinical Oncology. 2001;19(22):4224-4237.
- Early Breast Cancer Trialists’ Collaborative Group (EBCTCG). Long-term outcomes for neoadjuvant versus adjuvant chemotherapy in early breast cancer: meta-analysis of individual patient data from ten randomized trials. Lancet Oncol. 2018; 19: 27-39.
- Van Zijl P, Yadav N, Chemical exchange saturation transfer (CEST): What is in a name and what isn't?. Magnetic Resonance in Medicine. 2011;65(4):927-948.
- Wu B, Warnock G, Zaiss M, et al. An overview of CEST MRI for non-MR physicists. EJNMMI Physics. 2016;3(1).
- Dula A, Arlinghaus L, Dortch R, et al. Amide proton transfer imaging of the breast at 3 T: Establishing reproducibility and possible feasibility assessing chemotherapy response. Magnetic Resonance in Medicine. 2013;70(1):216-224.
- Klomp D, Dula A, Arlinghaus L, et al. Amide proton transfer imaging of the human breast at 7T: Development and reproducibility. NMR in Biomedicine. 2013;26(10):1271-1277.
- Van der Velden TA, Italiaander M, van der Kemp WJM, et al. Radiofrequency Configuration to Facilitate Bilateral Breast 31P MR Spectroscopic Imaging and High-Resolution MRI at 7 Tesla. Magnetic Resonance in Medicine. 2015;74(6):1803-1810.
- Khlebnikov V, Geades N, Klomp DWJ, et al. Comparison of pulsed three-dimensional CEST acquisition schemes at 7 Tesla: steady state versus pseudosteady state. Magn Reson Med. 2017;77:2280–7.
- Kim M, Gillen J, Landman BA, et al. Water saturation shift referencing (WASSR) for chemical exchange saturation transfer (CEST) experiments. Magn Reson Med. 2009;61(6):1441–50.
- Van Rijssel M, Pluim J, Luijten P, et al. Estimating B1+ in the breast at 7T using a generic template. NMR in Biomedicine. 2018;31(5):e3911.
- Van den Wildenberg L, Krikken E, Wijnen JP, et al. Correcting breast MRI with a generic B1+ template for T1 map calculation. Proc Intl Soc Mag Reson Med. 2019;27:4499.
Figures
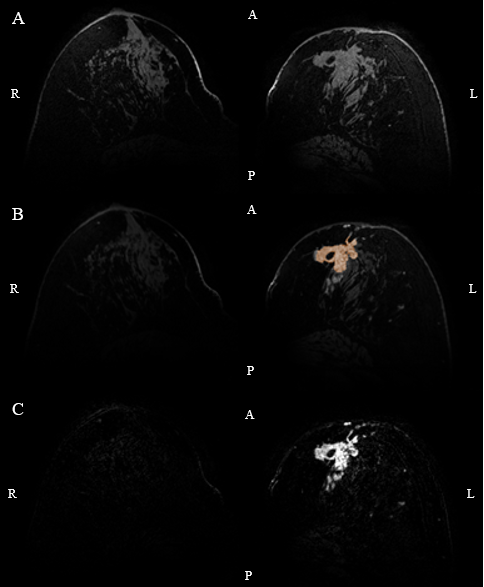
Figure 1: An
example of tumor segmentation using DCE images. (DCE acquisition contained 1 fat
suppressed high resolution scan prior to contrast injection (0.1 mmol/kg
gadobutrol), 12 high temporal resolution scans (TE/TR=1.6/4.8ms, FA=8°,
FOV=160x350x160mm3, resolution=2.86x2.86x2.86mm3) and 5
fat suppressed high resolution scans (TE/TR=2.5/5.6ms, FA=8°, FOV=160x350x160mm3,
resolution=0.7x0.7x0.7mm3)). A) First high resolution scan after
contrast administration. B) Result of the segmented tumor mask on top of the pre-contrast
image. C) Intensity difference image.
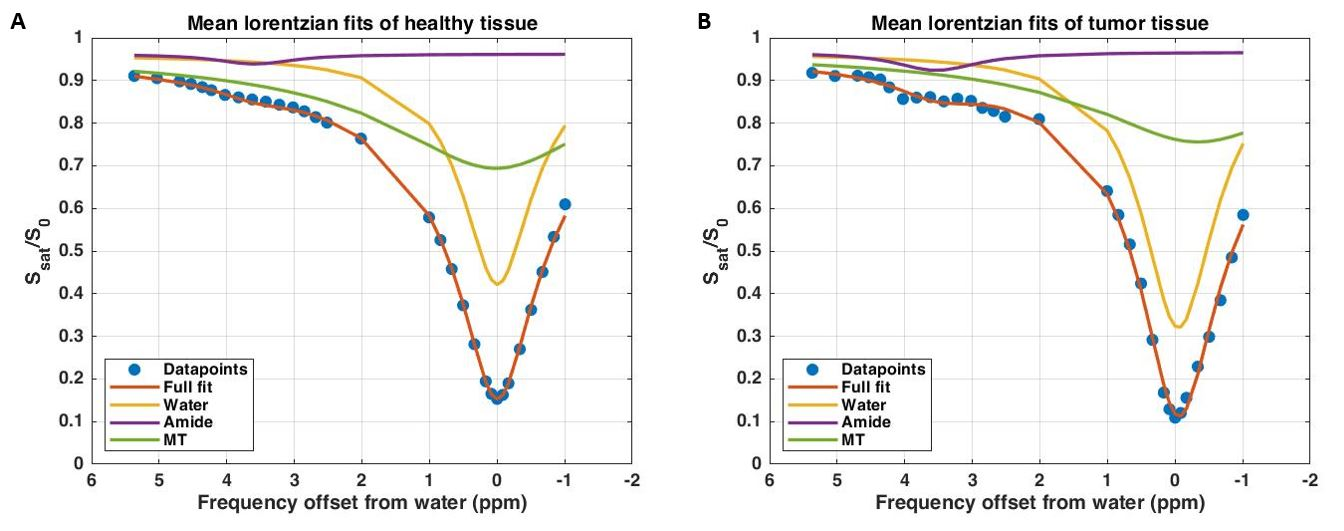
Figure 2:
Results of the three pool Lorentzian fitting of the Z-spectrum averaged over
the healthy tissue (A) and the tumor region (B) in one patient. CEST image
acquisition included fat suppression with a short 1-2-1 spectral-spatial RF
pulse to allow for a short TE of 1.4ms, a TR of 2.6ms and a flip angle of 1.2°.
A coronal field of view (FOV) of 150×320×100mm3 (FH×RL×AP) with a
true resolution of 2.3×3.0×6.8mm3 was obtained in two shots with an
interval of 4.48s and a fourfold acceleration in the right-left direction.
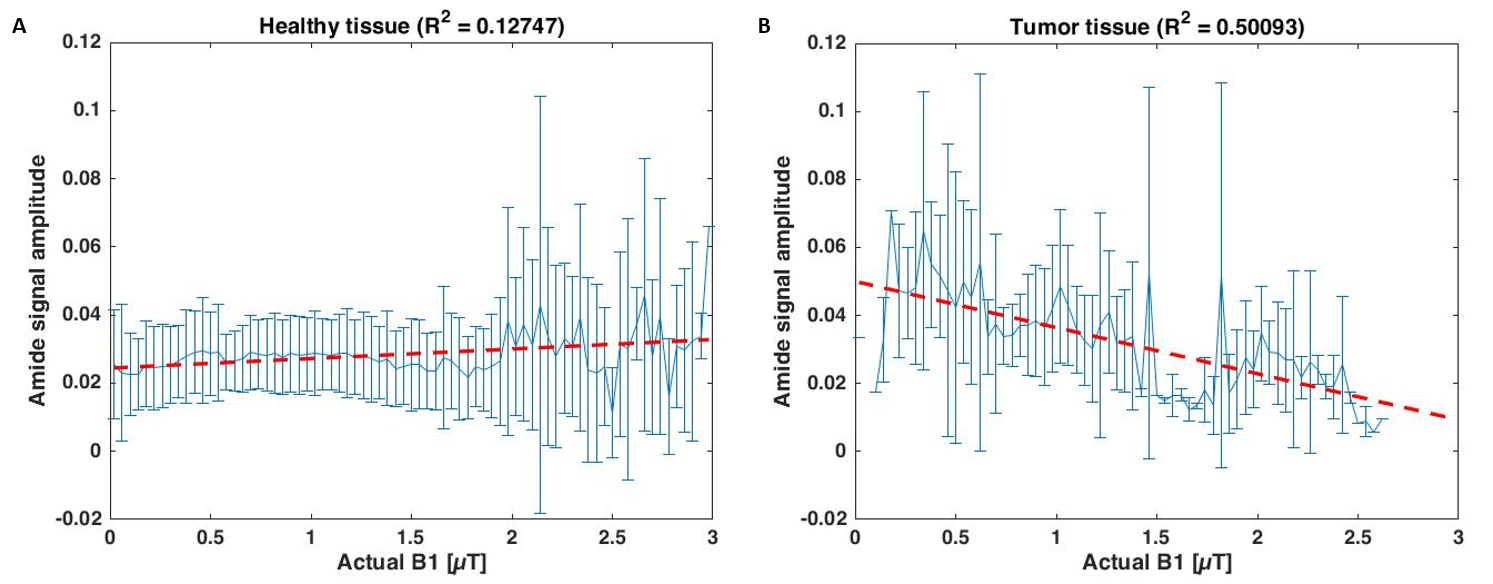
Figure
3: Correlation between APT signal and actual B1 (obtained from B1 template
registered to CEST image and scaled with measured B1 map) in healthy tissue (A)
versus tumor tissue (B).
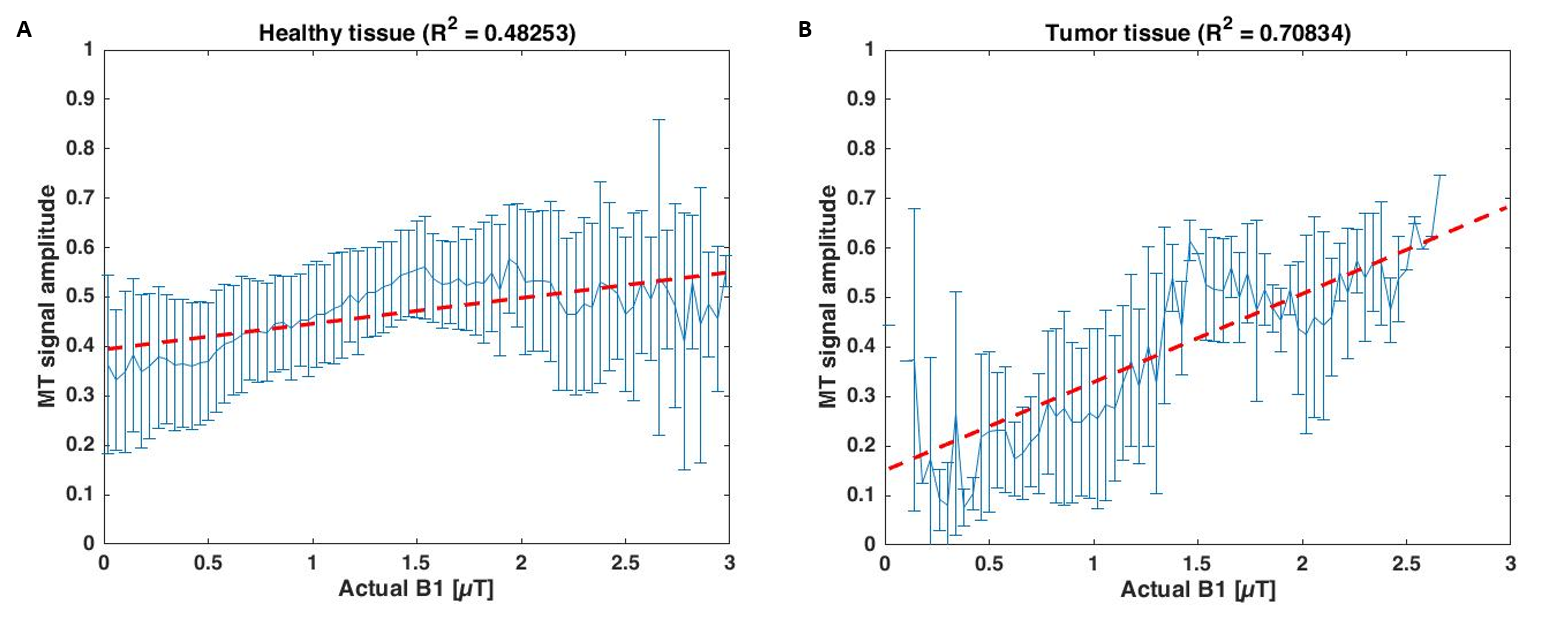
Figure 4: Correlation
between MT signal and actual B1 (obtained from B1 template registered to CEST
image and scaled with measured B1 map) in healthy tissue (A) versus tumor
tissue (B).