3145
An Analysis of Post-Radiation Response in DU145 Prostate Tumour Xenografts Using Magnetization Transfer MRI1Physical Sciences, Sunnybrook Research Institute, Toronto, ON, Canada
Synopsis
The response to radiation treatment of DU145 prostate tumour xenografts was studied by comparing magnetization transfer-weighted Z-spectra before and after treatment. ROIs were drawn in homogenous sections of the tumour and analyzed based on corresponding TUNEL histology images. MTR decreased more than 1 week post-treatment in tumours that responded to treatment but was unchanged for non-responding tumours. The technique introduced in this study could potentially introduce a non-invasive way of determining treatment efficacy based on tumour necrosis/apoptosis.
Introduction
Prostate cancer is the second most prevalent cancer in men with almost a third of high-risk prostate cancer patients developing recurrence after radiation treatment1. It is known that insufficient apoptosis occurs in malignant tumours and, thus, increasing apoptosis is one goal of cancer treatment2. Non-invasive detection of apoptosis will provide an early marker of treatment response.Magnetization transfer (MT)-prepared pulse sequences are sensitive to magnetization exchange between water and semisolid macromolecules, such as lipid bilayers3. Therefore, the magnitude of the MT effect seen in the active regions of a tumour is sensitive to cell membrane permeability and changes in membrane structure and integrity. Apoptosis affects cell membrane permeability and should therefore cause changes in MT.
The current study investigated the MT effect as a response to radiation treatment. The goal of this work is to find a non-invasive method to measure the response to radiation therapy based on the presence of necrosis/apoptosis that can predict whether or not a given tumour is responding to radiation treatment.
Methods
Approximately 3 × 10⁶ DU145 human prostate adenocarcinoma cells4 were injected in the hind limbs of female athymic nude mice (n = 6). After 4-6 weeks of growth, tumours were imaged at 7T (BioSpec 70/30 USR). T2-weighted structural images were acquired (RARE; TR = 2500 ms; TE = 9.2 ms; FOV = 20 mm × 20 mm × 7.5 mm; slice thickness = 0.5 mm; matrix = 128 × 128; RARE factor = 12; bandwidth = 33 kHz; averages = 4; 6 min, 40 s). Saturation transfer images, with saturation B1s of 3 and 6 μT at 11 logarithmically spaced offsets between 300 and 3 ppm, were processed to obtain Z-spectra sensitive to the direct water saturation effect and MT from macromolecules.Tumours were treated with a single dose of radiation at 6.3 Gy for 3.5 min to simulate a standard human dose. MRI was done 24-72 h before treatment, 48-72 h after treatment, and again 8-20 days after treatment. Tumours were excised and histologically stained for structure (H+E) and necrosis/apoptosis (TUNEL).
Two distinct regions of interest (ROIs) were drawn on the T2-weighted images in relatively homogenous sections of the tumour and were consistent between time points. MT spectra in the ROI voxels were analyzed and fitted to a two-pool quantitative MT model5. This model was fitted to the T1 map and Z-spectra with B1 = 3 and 6 μT. The free parameters were: T2 of the water pool (T2,L), exchange rate from the MT pool to the water pool (R), initial magnetization of the MT pool relative to the water pool (M0,MT), and T2 of the MT pool (T2,MT). Tumour volumes were calculated based on the structural T2-weighted images.
Results
Not all tumours responded to the radiation treatment. Figure 1 shows representative T2-weighted images for responders and non-responders at all time points, along with corresponding H+E- and TUNEL-stained histology sections. ROIs selected for quantitative analysis are shown on the T2-weighted images. The total volume of each tumour increased linearly over the course of the study (not shown).Figure 2 shows MT spectra acquired pre- and post-treatment at 3 and 6 μT for both representative tumours.
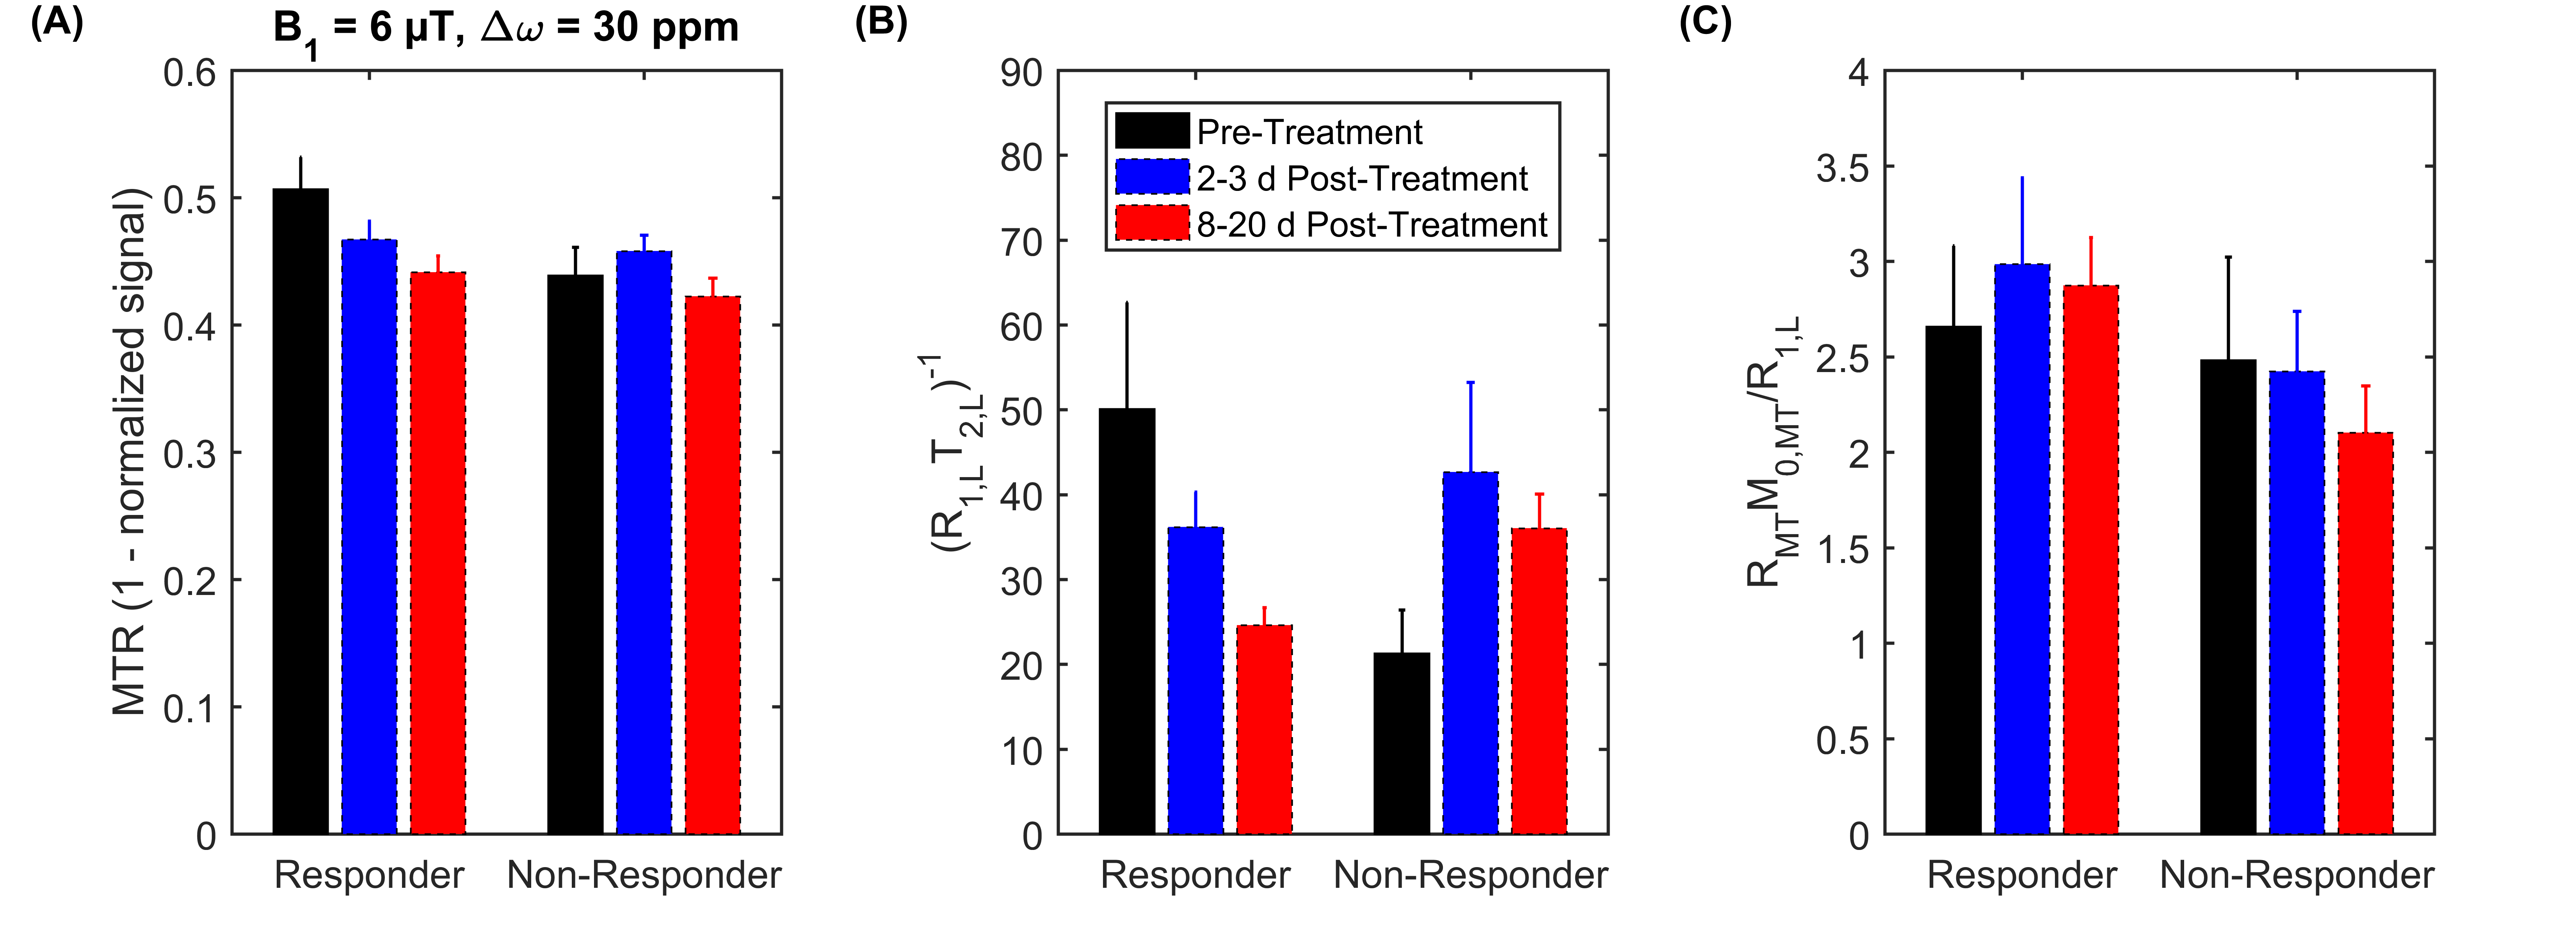
Magnetization Transfer Ratio (MTR) decreased more than 1 week post-treatment in tumours responding to treatment but was unchanged for non-responding tumours (Figure 3A). The qMT model parameter of (R1,LT2,L)-1 decreased >1 week post-treatment for responding tumours, but increased for the same time period in non-responders (Figure 3B). RMTM0,MT/R1,L slightly increased >1 week post-treatment in responders, but decreased in non-responders (Figure 3C).
Discussion
The presence of TUNEL staining corresponds to necrosis/apoptosis, which indicates a positive response to radiation treatment. The histology image of the responder showed a large amount of TUNEL staining, signifying that this tumour responded to the radiation treatment. Correspondingly, the MTR decreased over time (see Responder data in Figure 3A). Those changes in MTR are mostly related to a decrease in the quantitative MT parameter (R1,LT2,L)-1, which is proportional to the full width at half maximum of the direct effect. All of the remaining MT parameters did not change over treatment indicating that the observed changes are due to changes in tumour T1 and T2 relaxation.As expected, the effects of treatment were not reflected by a decrease in overall tumour size within the time frame of this experiment. With a single dose of radiation, it may be possible to see a reduction in tumour volume over the course of a few months, but is unlikely to be seen within 3 weeks.
This type of experiment is difficult to conduct using ROI-based analysis of single slice images. It is challenging to keep ROIs consistent between images acquired at different time points and to ensure proper image registration between MRI and histology.
Conclusion
This experiment suggests that MTR and quantitative MT fitting are a sensitive and specific marker of treatment response. The technique presented in this study could potentially introduce a non-invasive way of determining treatment efficacy based on tumour necrosis/apoptosis.Acknowledgements
The authors thank the Canadian Institutes of Health Research (grant number PJT148660) and Terry Fox Research Institute (grant number 1083) for funding.References
1. Viani GA, Stefano EJ, Alfonso SL. Higher-than-conventional radiation doses in localized prostate cancer treatment: a meta-analysis of randomized, controlled trials. Int J Radiat Oncol Biol Phys 2009;74(5):1405-1418.
2. Wong RSY. Apoptosis in cancer: from pathogenesis to treatment. J Exp Clin Cancer Res 2011;30(1):87.
3. Wolff SD, Balaban RS. Magnetization transfer contrast (MTC) and tissue water proton relaxation in vivo. Magn Reson Med 1989;10(1):135-144.
4. Fotouhi Ghiam A, Taeb S, Huang X, et al. Long non-coding RNA urothelial carcinoma associated 1 (UCA1) mediates radiation response in prostate cancer. Oncotarget 2017;8(3):4668-4689.
5. Lam WW, Oakden W, Murray L, et al. Differentiation of Normal and Radioresistant Prostate Cancer Xenografts Using Magnetization Transfer-Prepared MRI. Sci Rep 2018;8:10447.
Figures