3144
Distinguishing between macromolecular-driven magnetization transfer (MTSAT) and direct water saturation (MTDIR)1Bio-medical Engineering, Tel Aviv University, Tel Aviv, Israel, 2Sagol School of Neuroscience, Tel Aviv University, Tel Aviv, Israel, 3Center for Advanced Imaging Innovation and Research (CAI2R), New-York University Langone Medical Center, New York, NY, United States
Synopsis
Mapping of T2 values is highly valuable for a wide range of applications. Still, accurate mapping is challenging due to the inherent bias of rapid Multi-Echo Spin-Echo (MESE) protocols by stimulated echoes, and also by magnetization transfer (MT). In this work, we investigate the different effects of macromolecular-driven MT (MTSAT) and direct water saturation (MTDIR) mechanisms on MESE signals, and their respective influence on T2 values. The investigation includes quantitative MT measurements between protocols with different scan settings and protocol schemes, aiming to isolate the individual roles of MTSAT and MTDIR.
Introduction
To date, Multi-Echo Spin-Echo (MESE) protocols constitute the most effective tool for quantifying T2 relaxation times in vivo. Nevertheless, the extensive use of radiofrequency (RF) pulses in MESE schemes leads to magnetization transfer (MT) related bias of the measured signal, and potential distortion of the measured T2 values1,2. Traditionally, MT ratio (MTR) measures the total relative signal loss between an MT-free protocol, e.g. Single-echo SE (SSE), and an RF intensive protocol, e.g. MESE, instigating MT effects. The measured MTR includes two distinct mechanisms: macromolecular-driven MT (MTSAT) and direct water saturation (MTDIR)3 and is calculated according to: $$$MTR=\frac{S_{MT-free}-S_{saturated}}{S_{MT-free}}$$$.MTSAT refers to the transfer of magnetization between the saturated macromolecular pool (MMP) and the free water pool and can occur via cross-relaxation or chemical exchange phenomena4. MTDIR, on the other hand, refers to signal attenuation that originates from partial recovery of water protons between consecutive TRs, or from incidental irradiation of neighboring slices due to imperfect slice profile (i.e. slice crosstalk)5.
Previously we investigated the influence of MT on quantitative mapping of T2 values and showed that MT effect on MESE decay curve is constant and does not depend on scan settings. Still, MTSAT occurring within the imaged slice does distort the measured T2 values in comparison to SSE6. In this work we further explore the individual roles of MTSAT and MTDIR in MESE acquisitions, and quantify the effect of slice ordering on the measured signal and the ensuing T2 values. Since SSE and MESE signals are essentially different7,8, we analyze the evolution of MT along the respective echo trains, rather than echo-to-echo comparison.
Methods
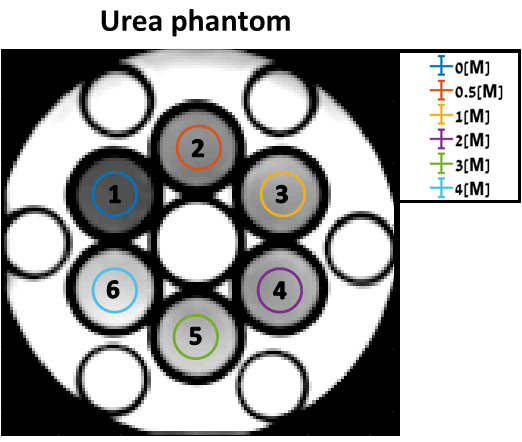
Phantom preparation: six tubes were doped with 0.25 [mM] of MnCl2 and a unique urea concentrations of 0, 0.5, 1, 2, 3, and 4 Molars (Fig. 1). The urea molecule [CO(NH)2] is favorable for studying MT due to the high saturation efficiency of the amide groups9, and the spectral characteristics, which allows to design targeted experiments for probing MTDIR and MTSAT10.MRI Scans were performed on a whole-body 3T Siemens Prisma scanner and included MRS analysis (STRESS), quantitative T1 (IR) and T2 (SSE and MESE) measurements, and estimation of MTR. Scan parameters for the T2-encoding protocols: TR/TE=3000/10 ms; Nechoes =1 (SSE), 10-30 (MESE), resolution=0.8x0.8 mm ; slice=4 mm; BW=200 Hz/Px ; Nslices =1-9; inter-slice gap= 0-200%; acceleration =2xGRAPPA;
Post-processing: Quantitative T2 maps were generated using mono-exponential fit to the SSE data, and using the Echo-Modulation-Curve (EMC) algorithm for the MESE data11–13.
MTSAT evaluation was based on the single-slice T2 dispersion between SSE and MESE protocols.
MTDIR was also estimated for MESE vs. SSE, and for different variants of MESE using varying ETL, TR, number of slices, inter-slice gap, and slice ordering schemes.
Results and Discussion
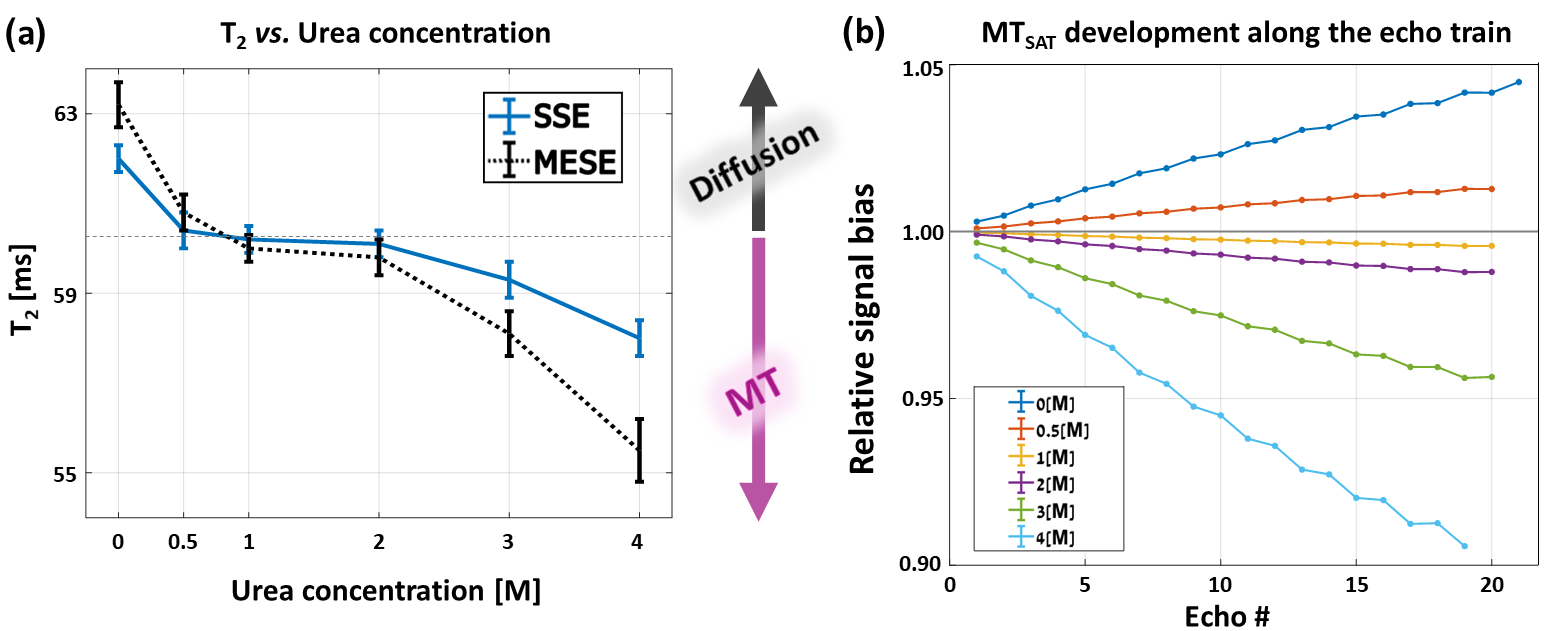
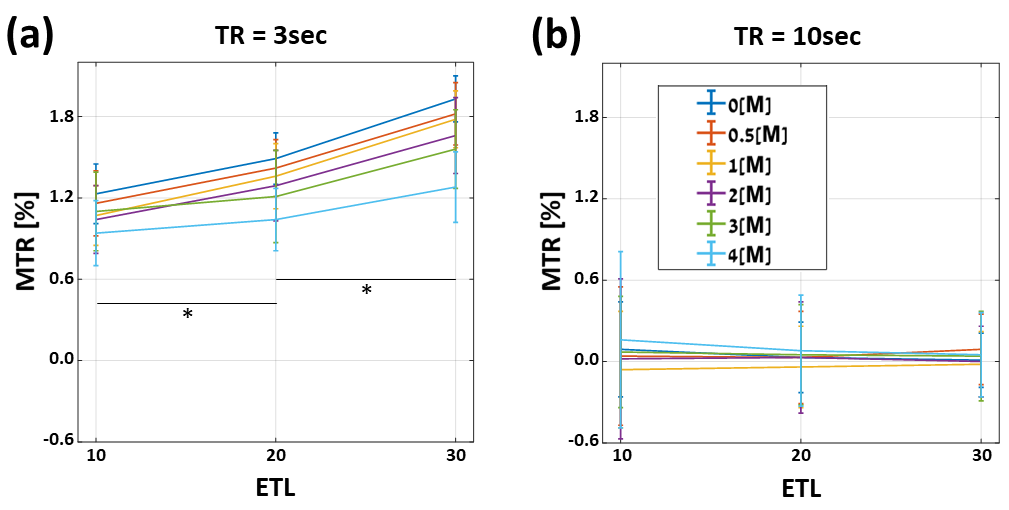
Fig. 2 shows the different effects of diffusion and MTSAT on SSE and MESE signals and T2 values. An expected decrease in baseline T2 is observed due to interactions with the urea molecules14. While SSE-T2 is lower at zero concentration due to diffusion effects, MTSAT dominates at higher concentrations, causing MESE-T2 values to be underestimated. Diffusion and MTSAT effects, which correspondly cause a positive and negative signal dispersion, shortens the measured T2 values and therefore depend on the pulse scheme and the MMP content (i.e. causing the MESE signal to be higher or lower).The individual contribution of MTDIR in this case is presented in Fig. 3, where the 1st echo MTR was measured between single-slice SSE and MESE scans with different ETLs and TRs. Full transverse relaxation occurred between consecutive sequence repetitions (T2 << T1), thus the increased MTR baseline involves only MTDIR, which, in turn, depends on the T1/T2 ratio and the absolute T1 value of each tube15. Due to the shorter recovery time in short-TR experiments, the MTDIR increases with longer ETLs (*P<0.001). Consequently, MTDIR was not present for longer TRs. For any TR, the T2 values remained stable for increasing ETLs (not shown), indicating that MTSAT attenuation build up at a constant rate along the echo train.
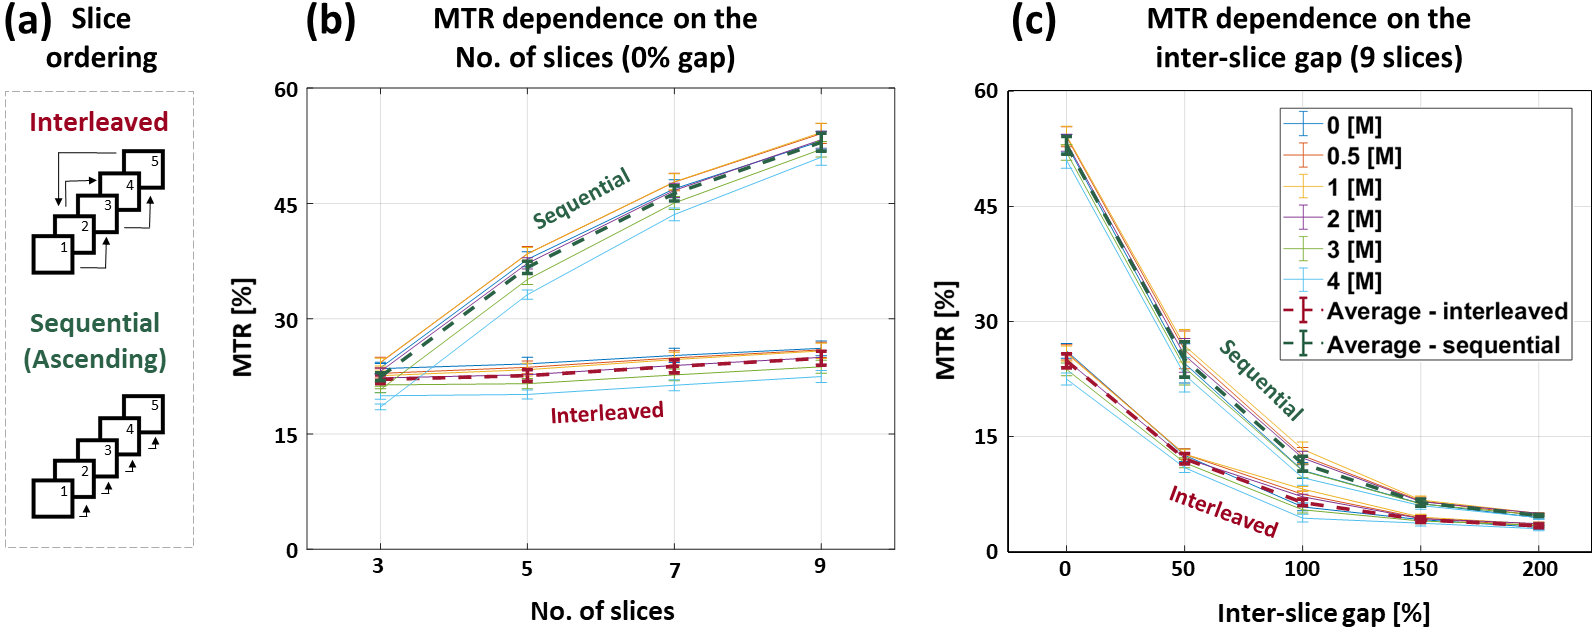
Fig. 4 shows the effect of slice ordering in MESE scans. Sequential ordering yields higher MTDIR, compared to the interleaved mode, due to increased slice crosstalk effect (i.e. allowing minimal recovery time before scanning adjacent slices)5,16,17. The MTR increased with the number of slices in both ordering schemes, while increasing inter-slice gap exhibits an inverse correlation with MTR. This result indicates MTDIR changes, as the urea protons are excited in the boundaries of the central slice solely (i.e. confined spectral width), thereby off-resonance MTSAT is neglected. The T2 values (result not shown) are independent of the slice ordering, number of acquires slices or the gap between them, as MTDIR causes to a uniform signal attenuation, thereby not affecting the relative decay pattern6.
Conclusions
Herein we investigate the individual contribution of MTSAT and MTDIR to the signal and T2 bias in MESE protocols. This study is also relevant for Turbo-SE schemes, and can be generalized to any sequence where multiple RF pulses are applied in a series. More ex vivo and in vivo experiments will shed light on the effect and extent of MT mechanisms in quantitative MRI measurements, and will expand the understanding on the macromolecular regime.Acknowledgements
ISF Grant 2009/17References
1. Majumdar S, Orphanoudakis SC, Gmitro A, O’Donnell M, Gore JC. Errors in the measurements of T2 using multiple-echo MRI techniques I. Effects of radiofrequency pulse imperfections. Magn Reson Med. 1986;3(3):397-417.
2. Deoni SCL, Rutt BK, Peters TM. Rapid combined T1 and T2 mapping using gradient recalled acquisition in the steady state. Magn Reson Med. 2003;49(3):515-526.
3. Henkelman RM, Stanisz GJ, Graham SJ. Magnetization transfer in MRI: A review. NMR Biomed. 2001;14(2):57-64.
4. van Zijl PCM, Lam WW, Xu J, Knutsson L, Stanisz GJ. Magnetization Transfer Contrast and Chemical Exchange Saturation Transfer MRI. Features and analysis of the field-dependent saturation spectrum. Neuroimage. 2018;168:222-241.
5. Santyr GE. Magnetization transfer effects in multislice MR imaging. Magn Reson Imaging. 1993;11(4):521-532.
6. Radunsky D, Blumenfeld‐Katzir T, Volovyk O, et al. Analysis of magnetization transfer (MT) influence on quantitative mapping of T2 relaxation time. Magn Reson Med. 2019;82(1):145-158.
7. Lebel RM, Wilman AH. Transverse relaxometry with stimulated echo compensation. Magn Reson Med. 2010;64(4):1005-1014.
8. Constable RT, Anderson AW, Zhong J, Gore JC. Factors influencing contrast in fast spin-echo MR imaging. Magn Reson Imaging. 1992;10(4):497-511.
9. Van Zijl PCM, Yadav NN. Chemical exchange saturation transfer (CEST): What is in a name and what isn’t? Magn Reson Med. 2011;65(4):927-948.
10. Dagher AP, Aletras A, Choyke P, Balaban RS. Imaging of urea using chemical exchange-dependent saturation transfer at 1.5 T. J Magn Reson Imaging. 2000;12(5):745-748.
11. Ben-Eliezer N, Sodickson DK, Shepherd T, Wiggins GC, Block KT. Accelerated and motion-robust in vivo T2 mapping from radially undersampled data using bloch-simulation-based iterative reconstruction. Magn Reson Med. 2016;75(3):1346-1354.
12. Ben-Eliezer N, Sodickson DK, Block TK. Rapid and Accurate T2 mapping from Multi Spin Echo Data Using Bloch-Simulation-Based Reconstruction. Magn Reson Med. 2015;73(2):809-817.
13. Shepherd TM, Kirov II, Charlson E, et al. New rapid, accurate T2 quantification detects pathology in normal-appearing brain regions of relapsing-remitting MS patients. NeuroImage Clin. 2017;14:363-370.
14. Edzes HT, Samulski ET. The measurement of cross-relaxation effects in the proton NMR spin-lattice relaxation of water in biological systems: Hydrated collagen and muscle. J Magn Reson. 1978;31(2):207-229.
15. Vavasour IM, Whittall KP, Li DK, MacKay a L. Different magnetization transfer effects exhibited by the short and long T(2) components in human brain. Magn Reson Med. 2000;44(6):860-866.
16. Crawley AP, Henkelman RM. Errors in T2 estimation using multislice multiple‐echo imaging. Magn Reson Med. 1987;4(1):34-47.
17. Dixon WT, Engels H, Castillo M, Sardashti M. Incidental magnetization transfer contrast in standard multislice imaging. Magn Reson Imaging. 1990;8(4):417-422.
Figures