3142
Quantification of Magnetization Transfer and Inhomogeneous Magnetization Transfer with an MPRAGE sequence and an MTsat Approach
David C Alsop1, Fanny Munsch1, Gopal Varma1, Olivier Girard2, and Guillaume Duhamel2
1Radiology, Beth Israel Deaconess Medical Center and Harvard Medical School, Boston, MA, United States, 2CRMBM, Aix Marseille Univ, CNRS, Marseille, France
1Radiology, Beth Israel Deaconess Medical Center and Harvard Medical School, Boston, MA, United States, 2CRMBM, Aix Marseille Univ, CNRS, Marseille, France
Synopsis
Methods for quantification of Inhomogeneous Magnetization Transfer (ihMT), are not yet well established. This is especially true for ihMT prepared sequences such as ihMT MPRAGE, where no steady state solution is available. Here we adapt the MTsat approach to quantification of MT and ihMT in an MPRAGE sequence.
Introduction
Magnetization transfer (MT) imaging typically quantifies the MT effect with a simple ratio of an image with saturation to an image without that depends not just on tissue parameters but also the timing details of the sequence, RF amplitudes and their spatial uniformity. More easily acquired parameters, such as T1 relaxation times, have a major MT independent effect on the ratios. Recognizing this limitation, two general strategies to better quantify MT have been proposed. The first, often referred to as qMT, uses a complete simulation of both the imaging sequence and the MT model to derive quantitative tissue parameters1. Typically, this involves acquiring a number of MT images at different RF power and frequency combinations, though these have been reduced to as few as just one if fewer tissue parameters are desired and approximate values are acceptable2. However, the challenge of fitting these complex models can degrade image quality and increase analysis time. Finally, the use of new models, such as including dipolar order effects to explain inhomogeneous MT (ihMT)3, and more unusual sequences, such as MT prepared MPRAGE, require new methods.A second approach to MT quantification is to quantify the attenuation due to a single off-resonance RF pulse on the free magnetization4. This approach, sometimes referred to as MTsat measurement, provides a method to separate the MT related effects of the saturation from T1, sequence timings, and RF nonuniformities. In the limit of fast exchange relative to the pulse repetition rate, these MTsat measures are independent of acquisition and can be input into a second stage of qMT models if needed. Here we report the adaptation of the MTsat approach to an ihMT MPRAGE acquisition.
Methods
Sequence model: The MPRAGE sequence consists of 1s MT or T1 preparation followed by a 90 pulse gradient echo readout (TR 4.6ms, nominal flip angle of 10°), and then a recovery period for a total repetition time of 2s. Two reference images were acquired: one with no RF during the 1s preparation period, and another with 25° on resonance pulses applied with RF spoiling every 25ms.In accordance with the MTsat approach, the effect of an MT RF pulse was modeled as a fractional attenuation of the free pool by the factor (1-delta), figure 1. A simple forward model for the spoiled gradient echo excitations during readout and the MT RF pulses (or the 25° pulses used for the second reference), as a function of T1 and B1 (calculated as the spatially dependent variation of the RF amplitude relative to the one nominally prescribed) was implemented.
Acquisition: MT preparation consisted of ten 5ms Tukey shaped pulses applied at 100ms spacing. Separate acquisitions with +7kHz, -7kHz, or dual ±7kHz irradiation achieved by cosine modulation were used. Unmodulated MT RF pulses had 140mG peak amplitude. Along with the MT acquisitions, a quick low resolution B1 map was acquired with a Bloch Siegert sequence previously described5.
20 healthy adult volunteers were imaged according to a protocol approved by our local review board following written informed consent.
Fitting: Because voxel by voxel multiparameter fitting can be slow and result in artifacts due to poor convergence in some regions, we chose to fit individual parameters sequentially. We also used a bisection fitting algorithm with guaranteed convergence for inverting the sequence models, which are monotonic functions of their parameters. Using the measured B1 maps, the ratio of two reference images was first fit to determine T1 in each voxel. Then using the B1 and T1, the ratio of the MT saturated image to the 0° reference images was fit to determine a delta value for each MT experiment. The B1 corrected dipolar order independent MT measure, MTsat, and the ihMT measure, ihMTsat, were then calculated according to the formulas in figure 2 assuming a quadratic dependence on B16.
Results
All ihMT acquisitions were successfully quantified. A whole brain calculation required less than 4 minutes within MATLAB on an iMac Pro computer. Relative to MTR and ihMTR, the delta values were more insensitive to B1 and showed greater gray white matter contrast. A previously proposed approximate algebraic measure7, ihMTRinv , showed similar insensitivity to B1 but residual T1 effects for the non steady state MPRAGE sequence over-removed T1 effects and enhanced gray white contrast relative to the delta measures.Discussion
Our proposed MTsat and ihMTsat quantification approach provides a quantitative measure of RF MT effects while removing B1, T1, and sequence timing effects. By separating RF MT effects from the detailed sequence timing, it supports a range of non steady state sequence methods and provides a mechanism for comparison of MT effects across different sequence implementations. qMT and qIHMT modeling can then be pursued by modeling RF saturation effects on the bound pool.Acknowledgements
No acknowledgement found.References
1. Sled JG. NeuroImage 182:128-135 (2018)
2. Yarnykh V.L. Magn. Reson. Med. 68:166–178 (2012)
3. Varma G et al. Magn Reson Med. 73:614-22 (2015)
4. Helms G et al. Magn Reson Med 60:1396–1407 (2008)
5. Sacolick LI et al. Magn Reson Med. 63(5):1315-22 (2010)
6. Varma G et al. J Magn Reson. 296:60-71 (2018)
7. Varma G et al. ISMRM 2019: 4911
Figures
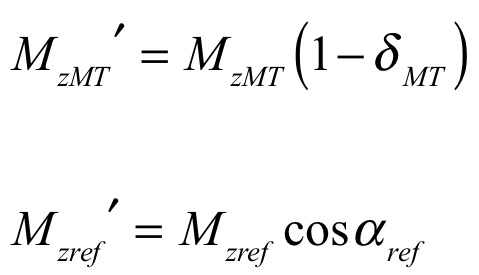
Figure 1: The single pool approximation of the MTsat model. MT
effects appear through the attenuation of magnetization by a factor delta after
each MT RF pulse. A similar attenuation occurs from application of on resonance
pulses for the 25° reference.
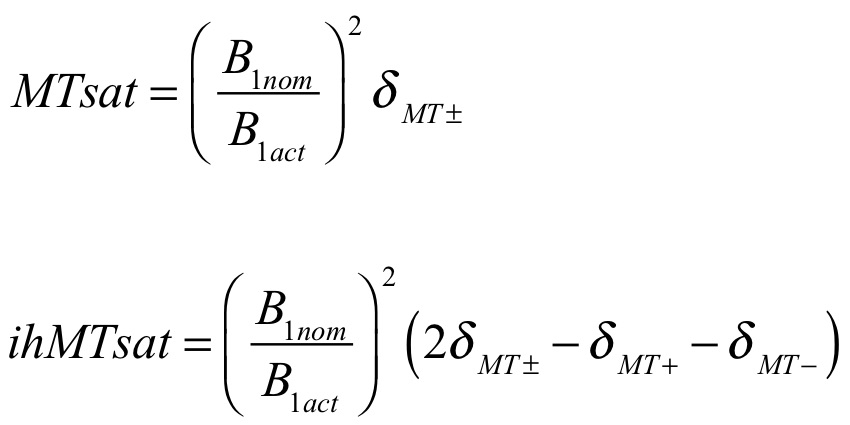
Figure 2: Definition of the MTsat and ihMTsat measures based
on the delta values derived from each MT experiment. The B1 factor, where nom indicates the nominally prescribed B1 and act indicates the actual measured B1, corrects for
quadratic B1 dependence of MT.
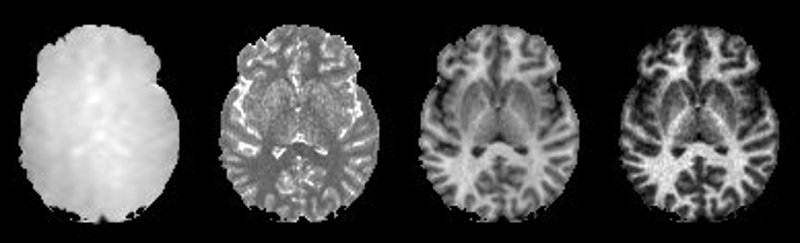
Figure 3: B1, T1, dual MTsat, and ihMTsat maps calculated
from a representative subject.
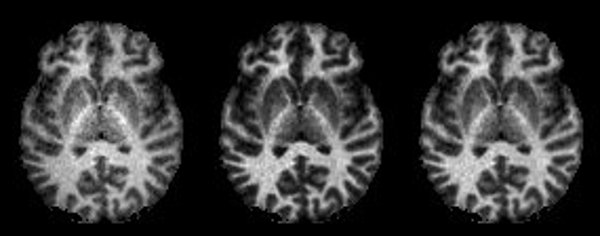
Figure 4: Comparison of ihMTR, left, ihMTRinv, center, and
the proposed ihMTsat, right. ihMTR shows center brightening from B1
nonuniformity and lower gray white contrast than ihMTsat. ihMTRinv, an
approximate method to remove T1 and B1, overcompensates slightly for this
MPRAGE data relative to the more complete model solution of ihMTsat.