3141
Magnetization transfer contrast (MTC) suppressed relayed nuclear Overhauser enhancement (rNOE) imaging at 3 T1Department of Biomedical Engineering, City University of Hong Kong, Hong Kong, China, 2Russell H. Morgan Department of Radiology and Radiological Science, The Johns Hopkins University School of Medicine, Baltimore, MD, United States, 3F.M. Kirby Research Center for Functional Brain Imaging, Kennedy Krieger Research Institute, Baltimore, MD, United States
Synopsis
Relayed nuclear Overhauser enhancement (rNOE) imaging indirectly detects the aliphatic groups of biomolecules and can be used to diagnose protein or lipid signals and related pathology involving such signals. Current rNOE imaging has been studied mainly on high-field MRI scanners (≥7T). When implementing the technique on low clinical MRI fields (≤3T), rNOE contrast is more obscured by semisolid magnetization transfer contrast (MTC) and water direct saturation (DS). We developed a pulsed-CEST/MT method at 3T MRI that can suppress MTC and DS efficiently, not compromising rNOE contrast.
Introduction
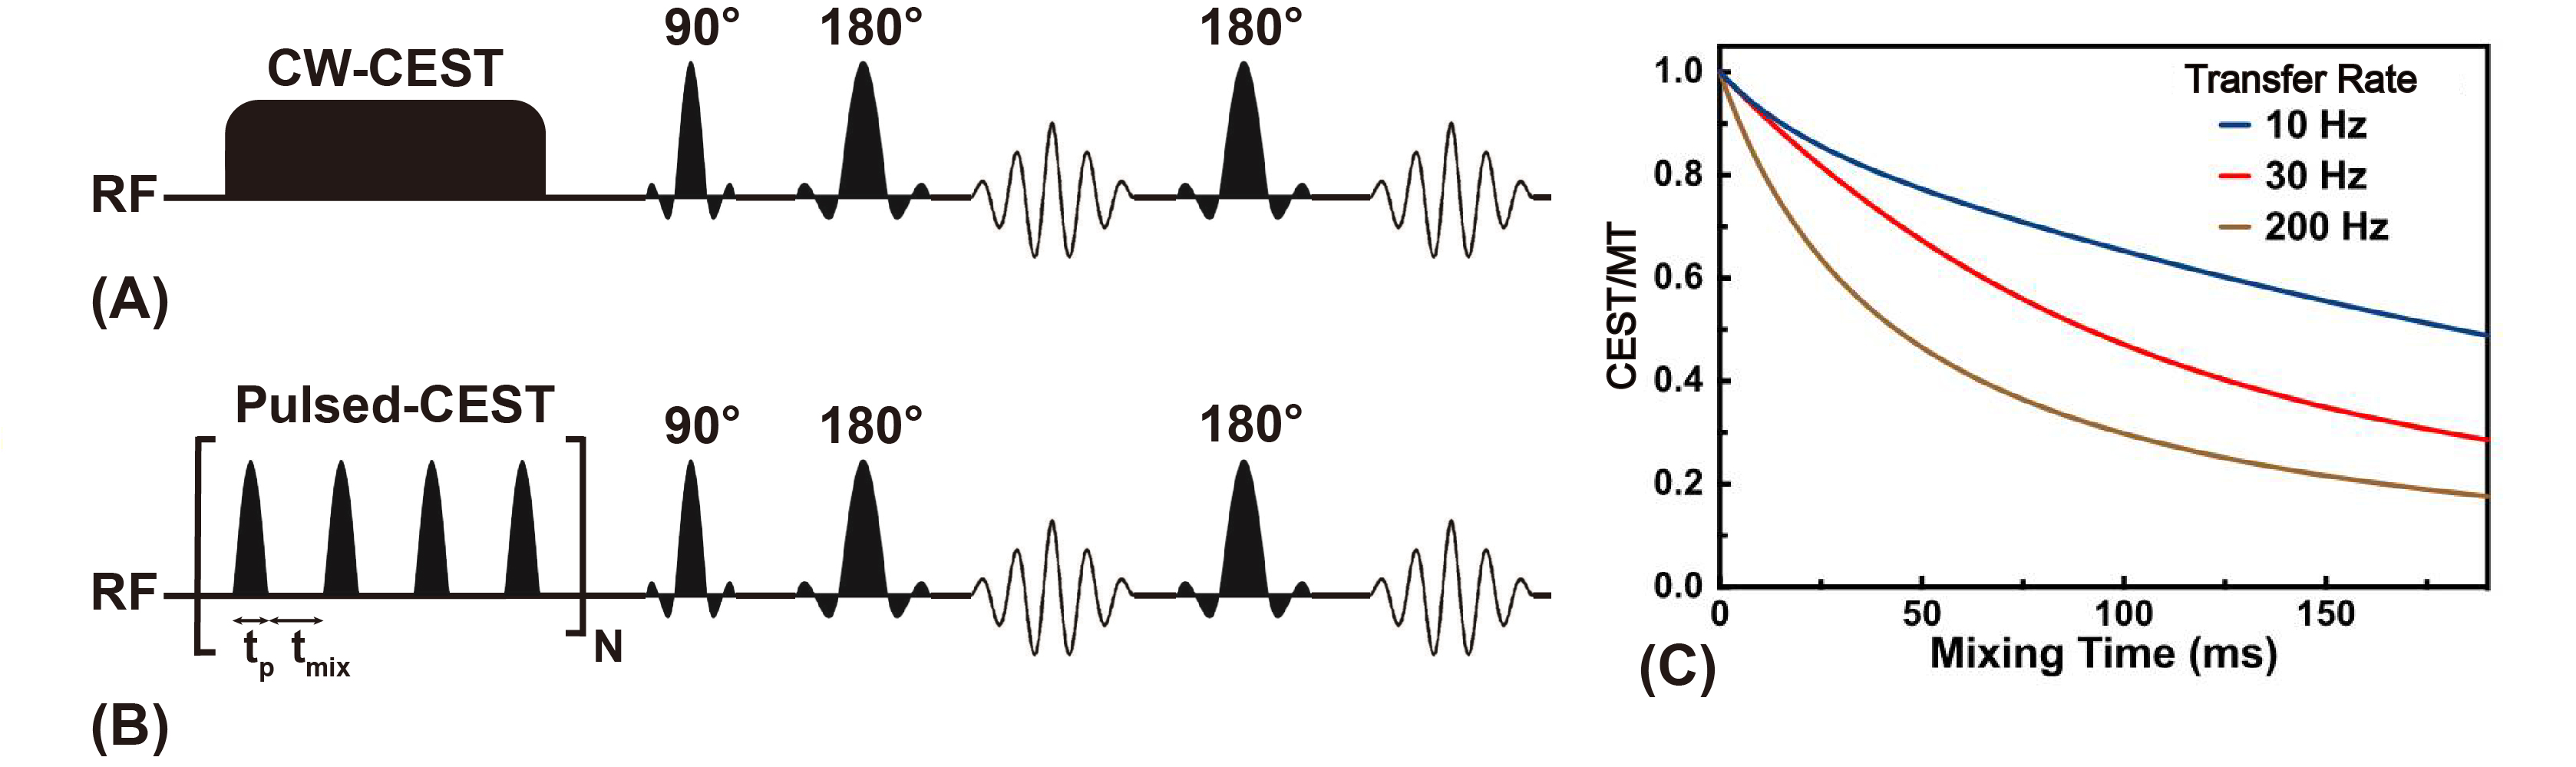
Relayed Nuclear Overhauser enhancement (rNOE) is a magnetization transfer contrast (MTC) at 0-5 ppm upfield from the water signal (1-3). rNOE signals in Z-spectra arise from aliphatic protons of mobile proteins and lipids (4,5), and are characterized a slow magnetization transfer rate (<20Hz). This unique property makes it suitable for applications on clinical scanners (≤3T). Moreover, rNOE effects reflect the MT properties of unique set of protons in tissues and has been applied to image Alzheimer’s disease (6), tumor (7) and stroke (8). Similar to CEST studies, MTC and water direct saturation (DS) are two confounding effects in rNOE signal. Recently, we proposed a simple solution to acquire rNOE signals in vivo by assuming the combined MTC and DS effects to be a linear function between -3.5ppm and -12.5ppm at low saturation powers at high-fields MRI (6). Here, we aim to study MTC suppressed rNOEs at 3T by using a pulsed-CEST/MT method with long mixing times (Fig. 1C) (3). First, we will investigate the MTC/DS suppression method in phantoms with lactic acid (Lac) in cross-linked bovine serum albumin (BSA) (9), where the binding of lactate to a solid-like matrix causes an intermolecular rNOE that is then relayed to water, called the IMMOBILISE mechanism (10). Then, we will apply this new scheme to monitor the degradation of hydrogel injected in mouse brain (11,12).Methods
All MRI experiments were performed on a horizontal bore 3T Bruker BioSpec system (Bruker, Germany). MRI protocols can be found in Figs. 1A,B. A phantom including three NMR tubes was prepared to optimize and demonstrate the proposed method. One tube was 200 mM Lac mixed with cross-linked bovine serum albumin (BSA) (20%w/w, pH=7.0) (Lac+crossBSA), the second the cross-linked BSA alone (20%w/w, pH=7.0) (crossBSA), and the third BSA solution (20%w/w, pH=7.0). Four adult female NOD/scid mice (age two months) were used for in vivo experiments. The rNOE (IMMOBILISE) signal acquired with continuous wave (CW) CEST/MT method on the same phantom will be used to evaluate the labeling efficiency of proposed method. The pulse width, saturation power and inter-pulse delay of pulsed-CEST/MT approach (3) will be optimized on phantom successively to achieve most MTC/DS attenuation, while retaining sufficiently high rNOE (IMMOBILISE) effect. The Lac signal was extracted by subtracting Z(-3.4ppm) between Lac+crossBSA and crossBSA. The MTC signal of phantom was calculated by subtracting the Z(-3.4ppm) from Z(-8ppm) of crossBSA. High-resolution rNOE images on mouse brain with hydrogel injection were acquired by collecting 12 interleaved labeling (-3.5ppm) and two control (-8, -12.5 ppm) images. The regional rNOE difference signals were determined on mouse brain with hydrogel to verify that the rNOE effect is sensitive enough to monitor the hydrogel degradation. By assuming the MTC/DS background is a linear function between -3.5ppm to -12.5ppm, the rNOE maps of mouse brain were calculated by:$$Z(rNOE)=2\cdot Z(-8ppm)-Z(-3.5ppm)-Z(-12.5ppm)$$The CNR was defined as (13): $$CNR=\frac{S_{contr}-S_{gel}}{std_{contr}}$$Results and Discussion
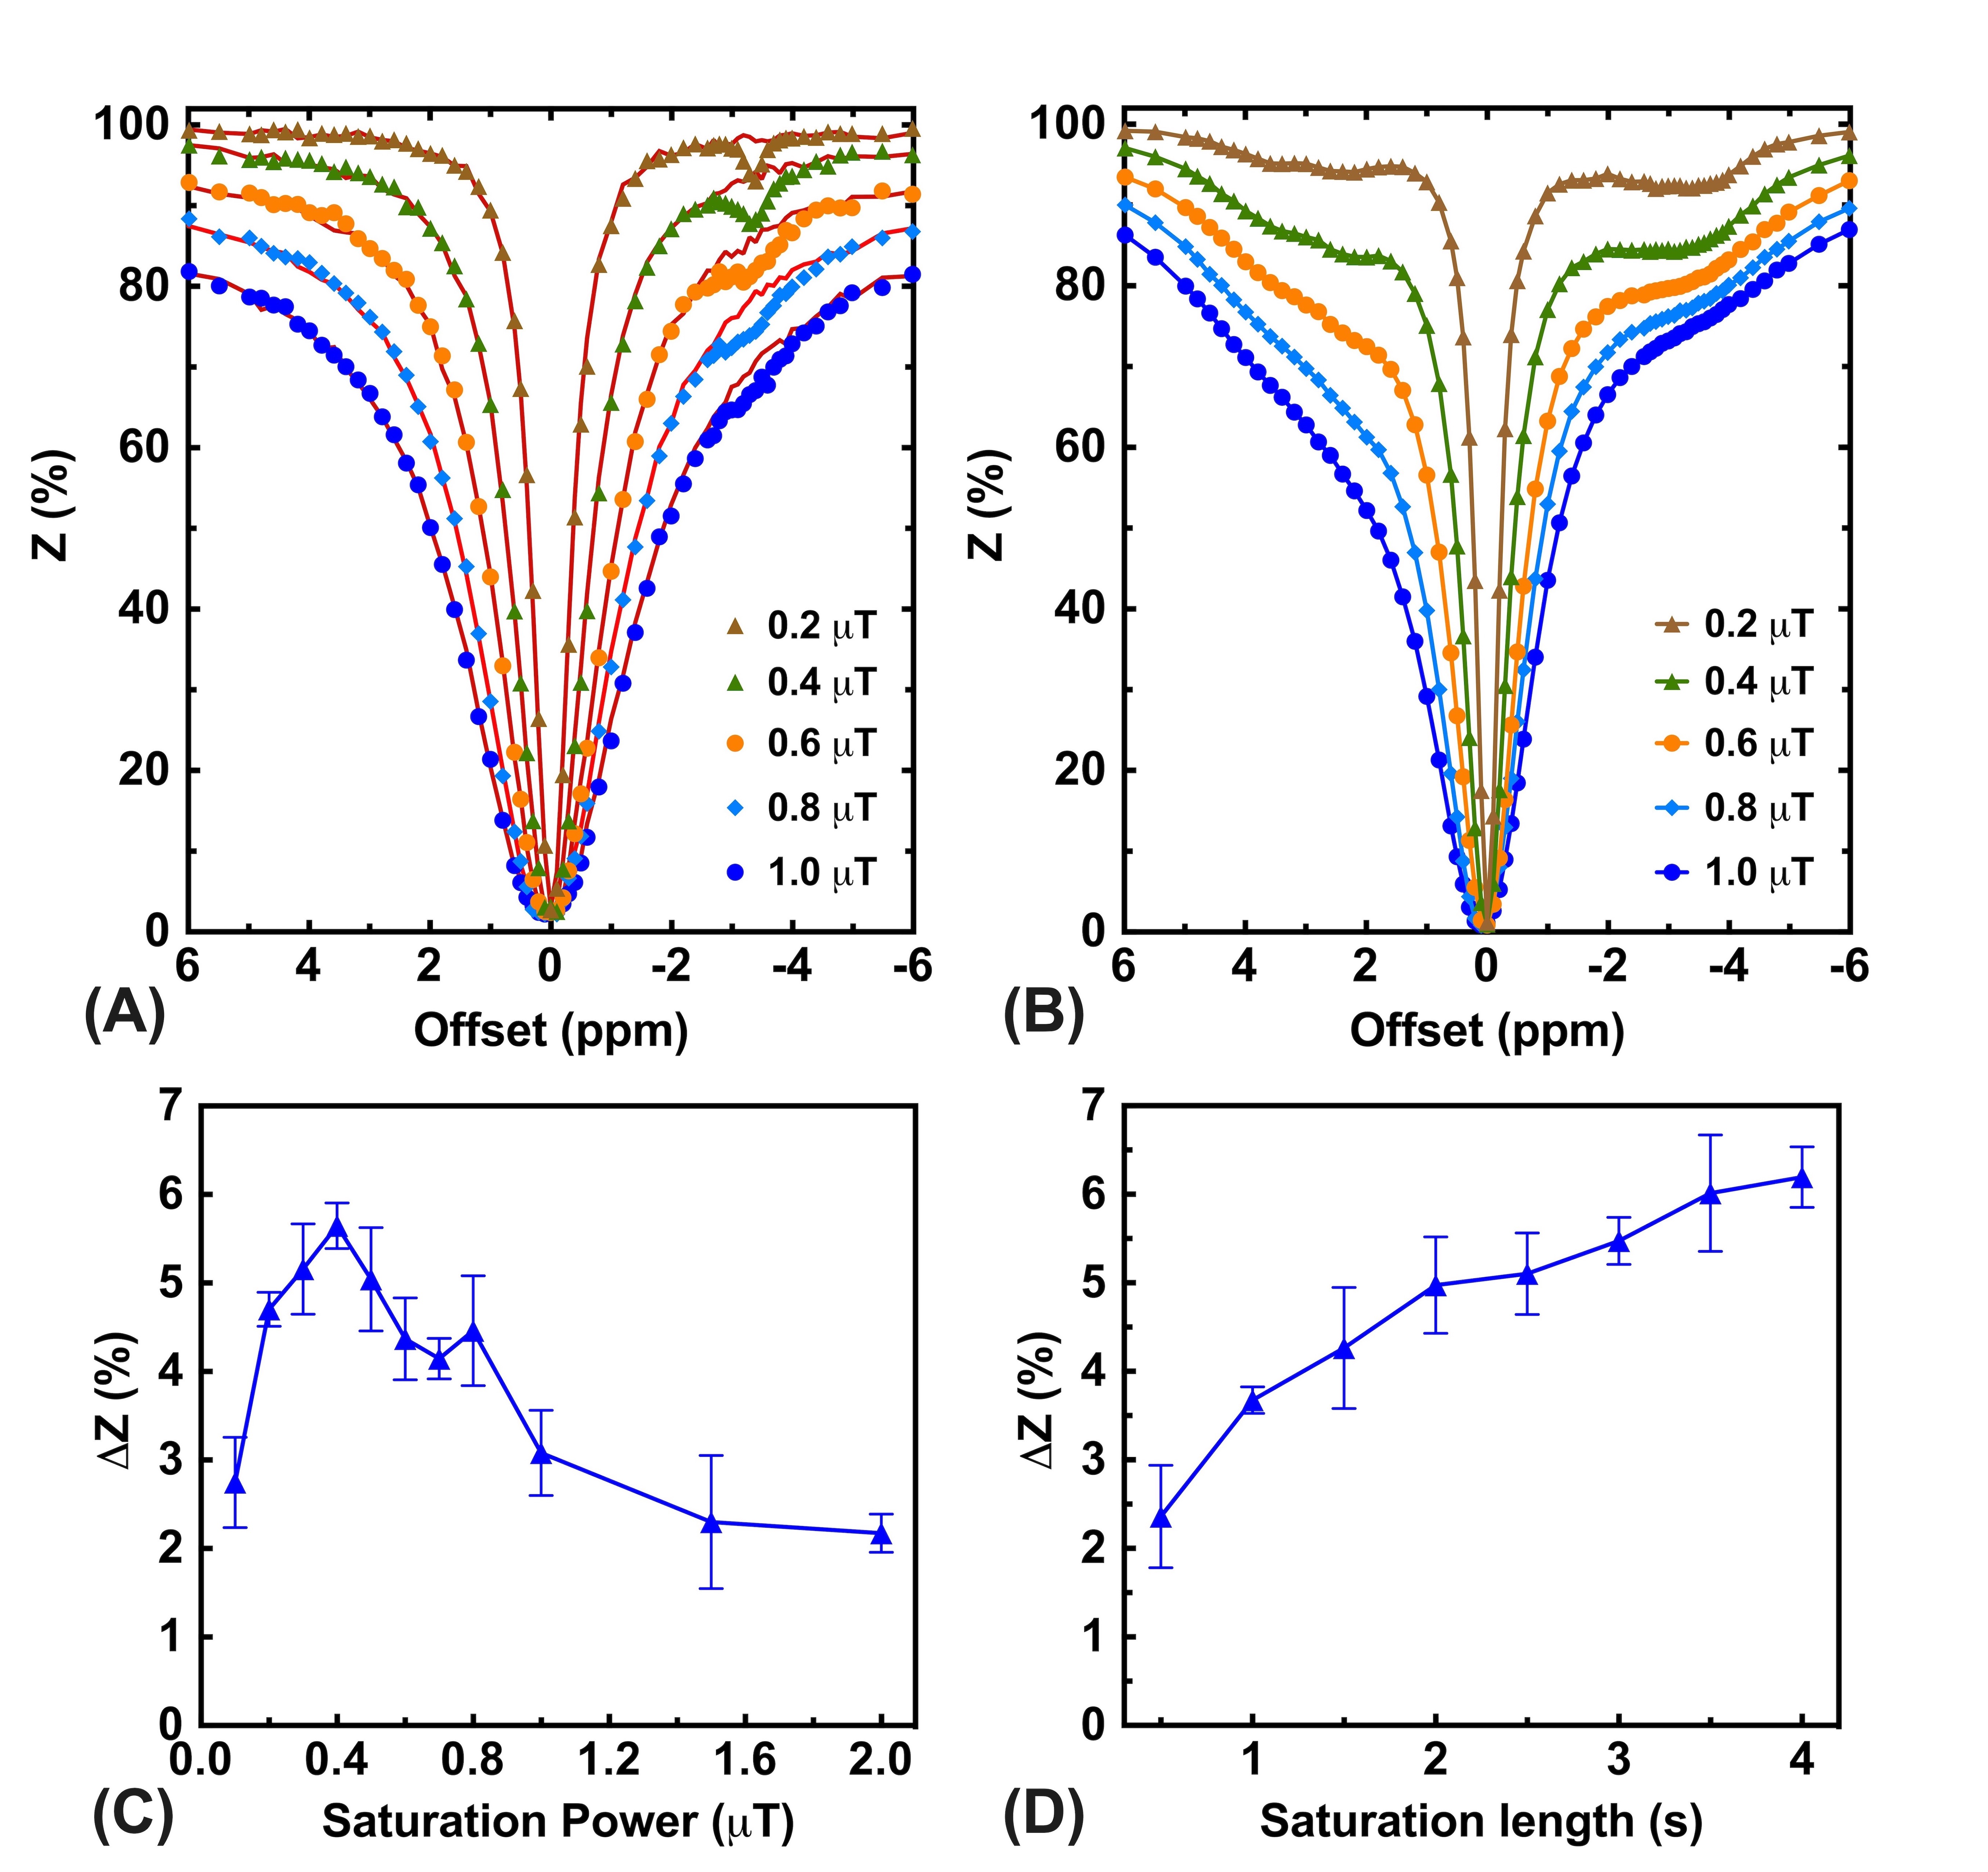
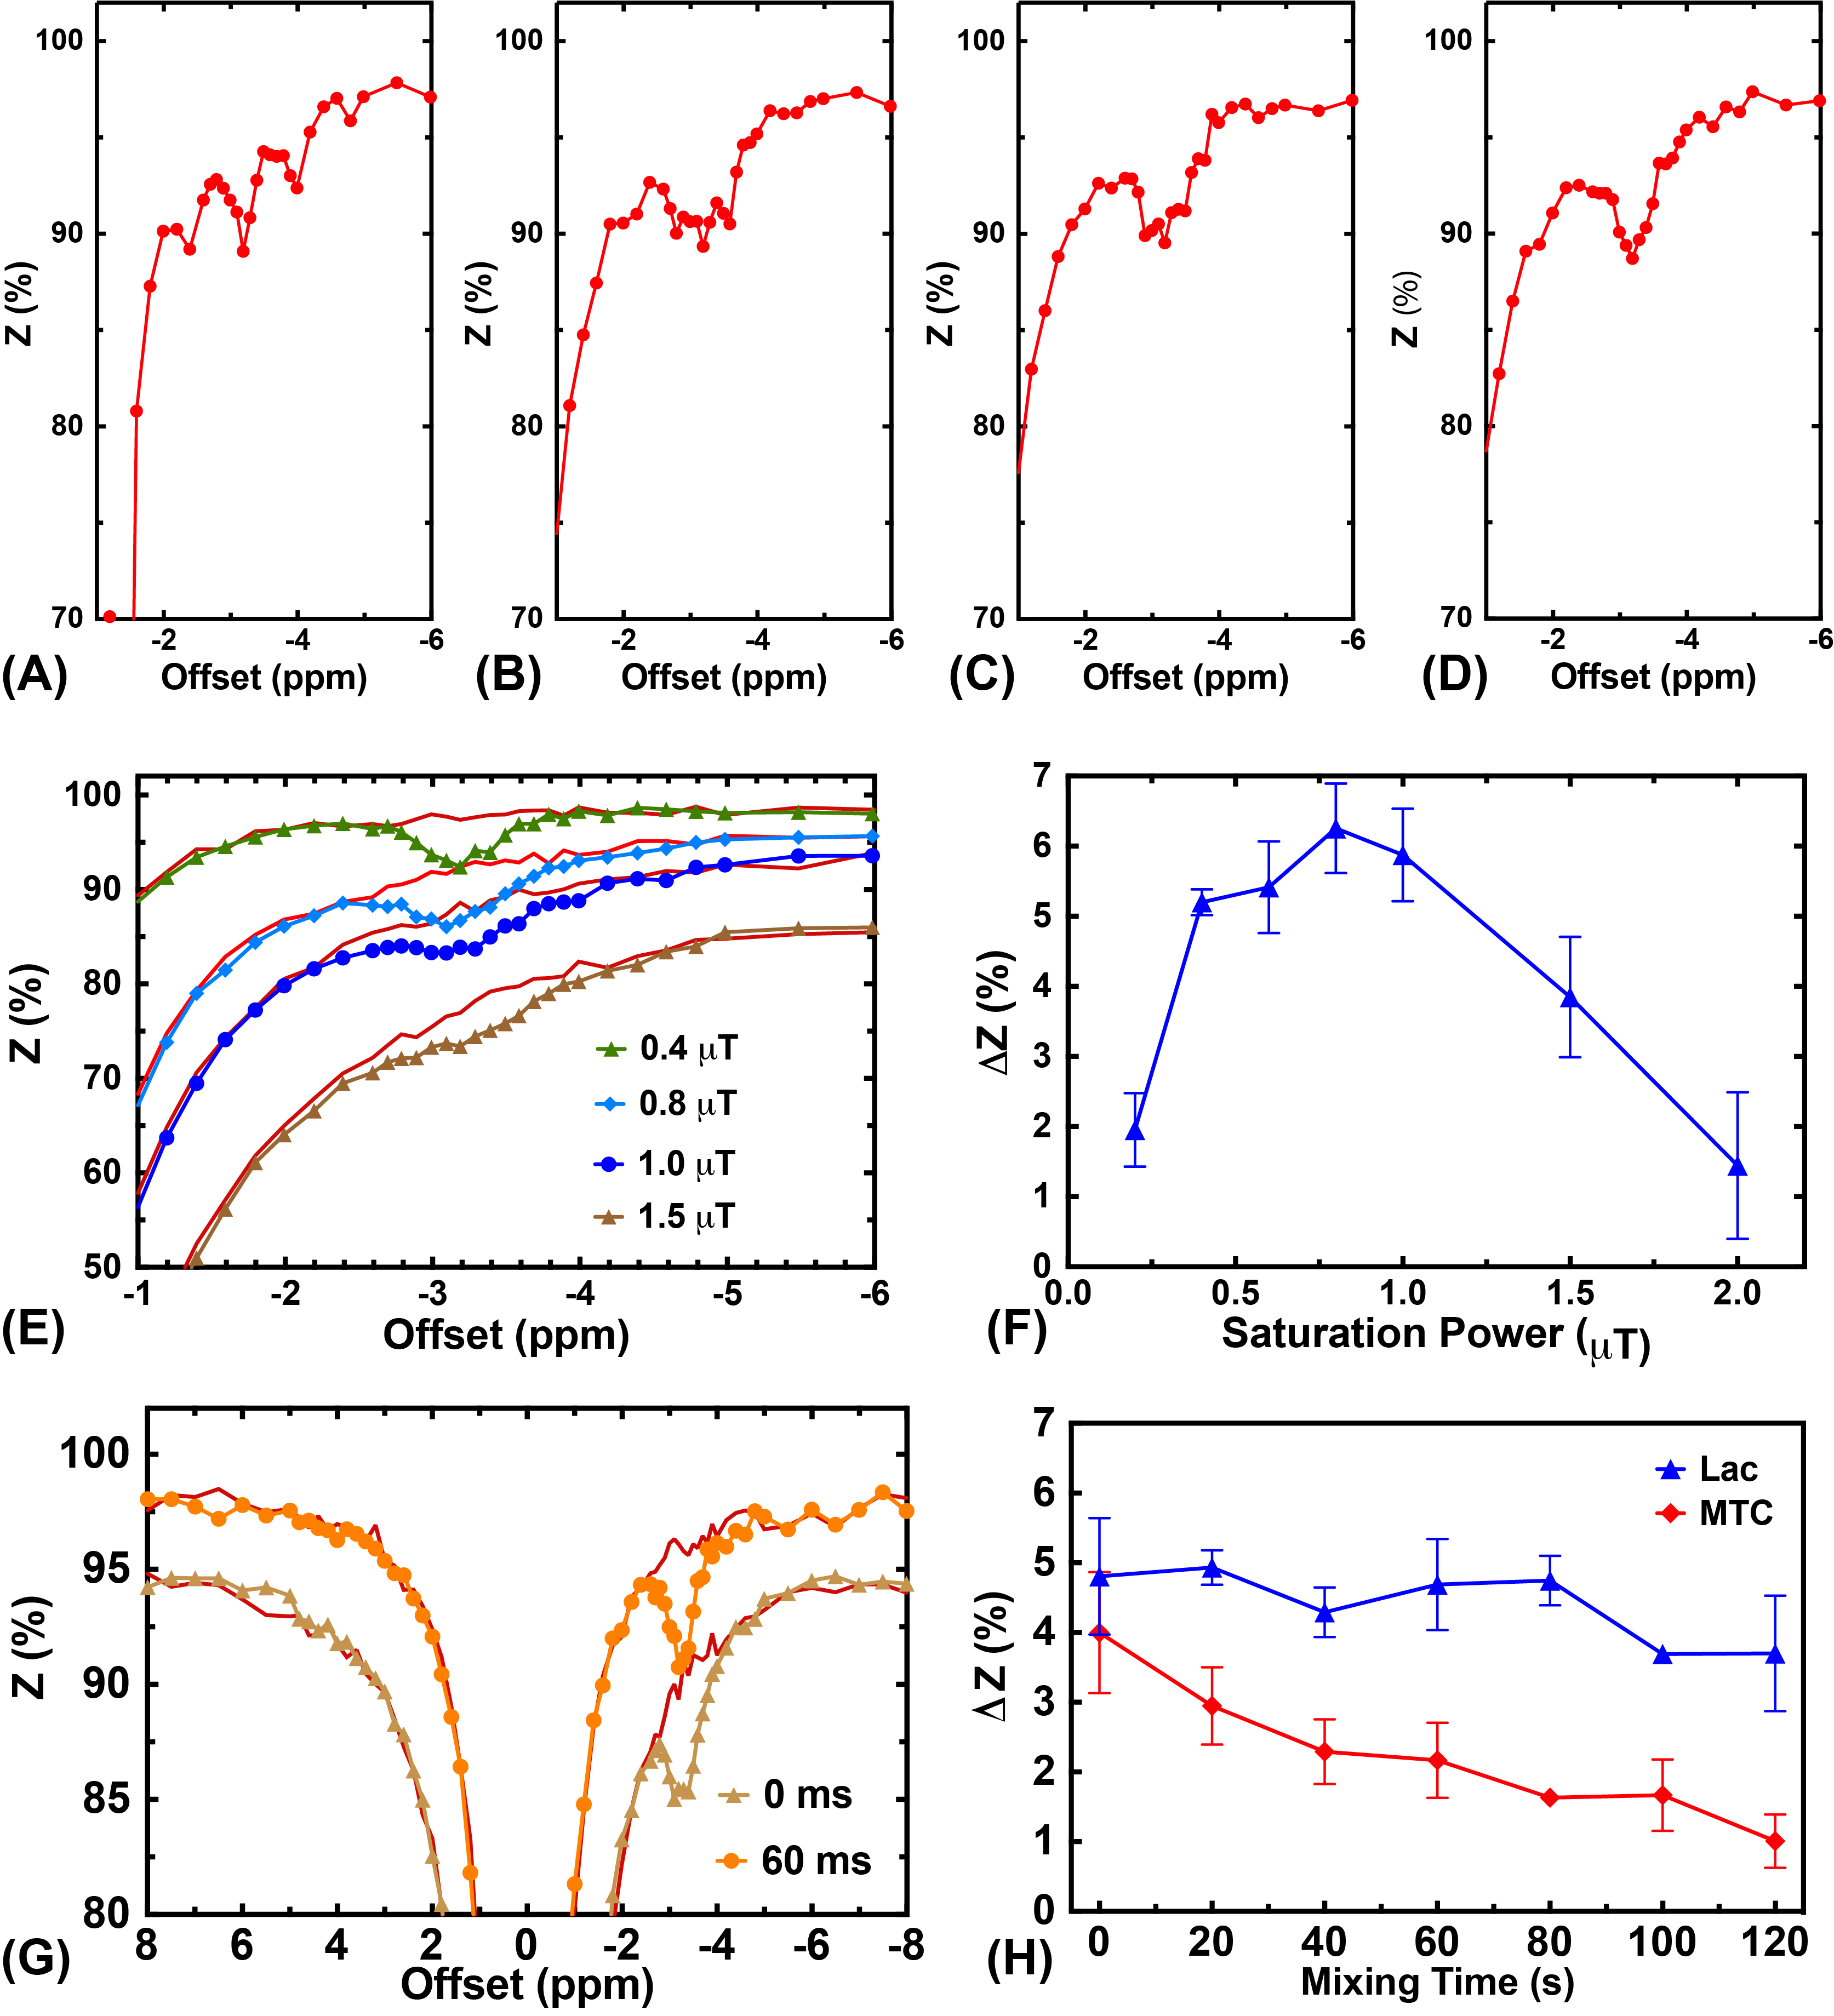
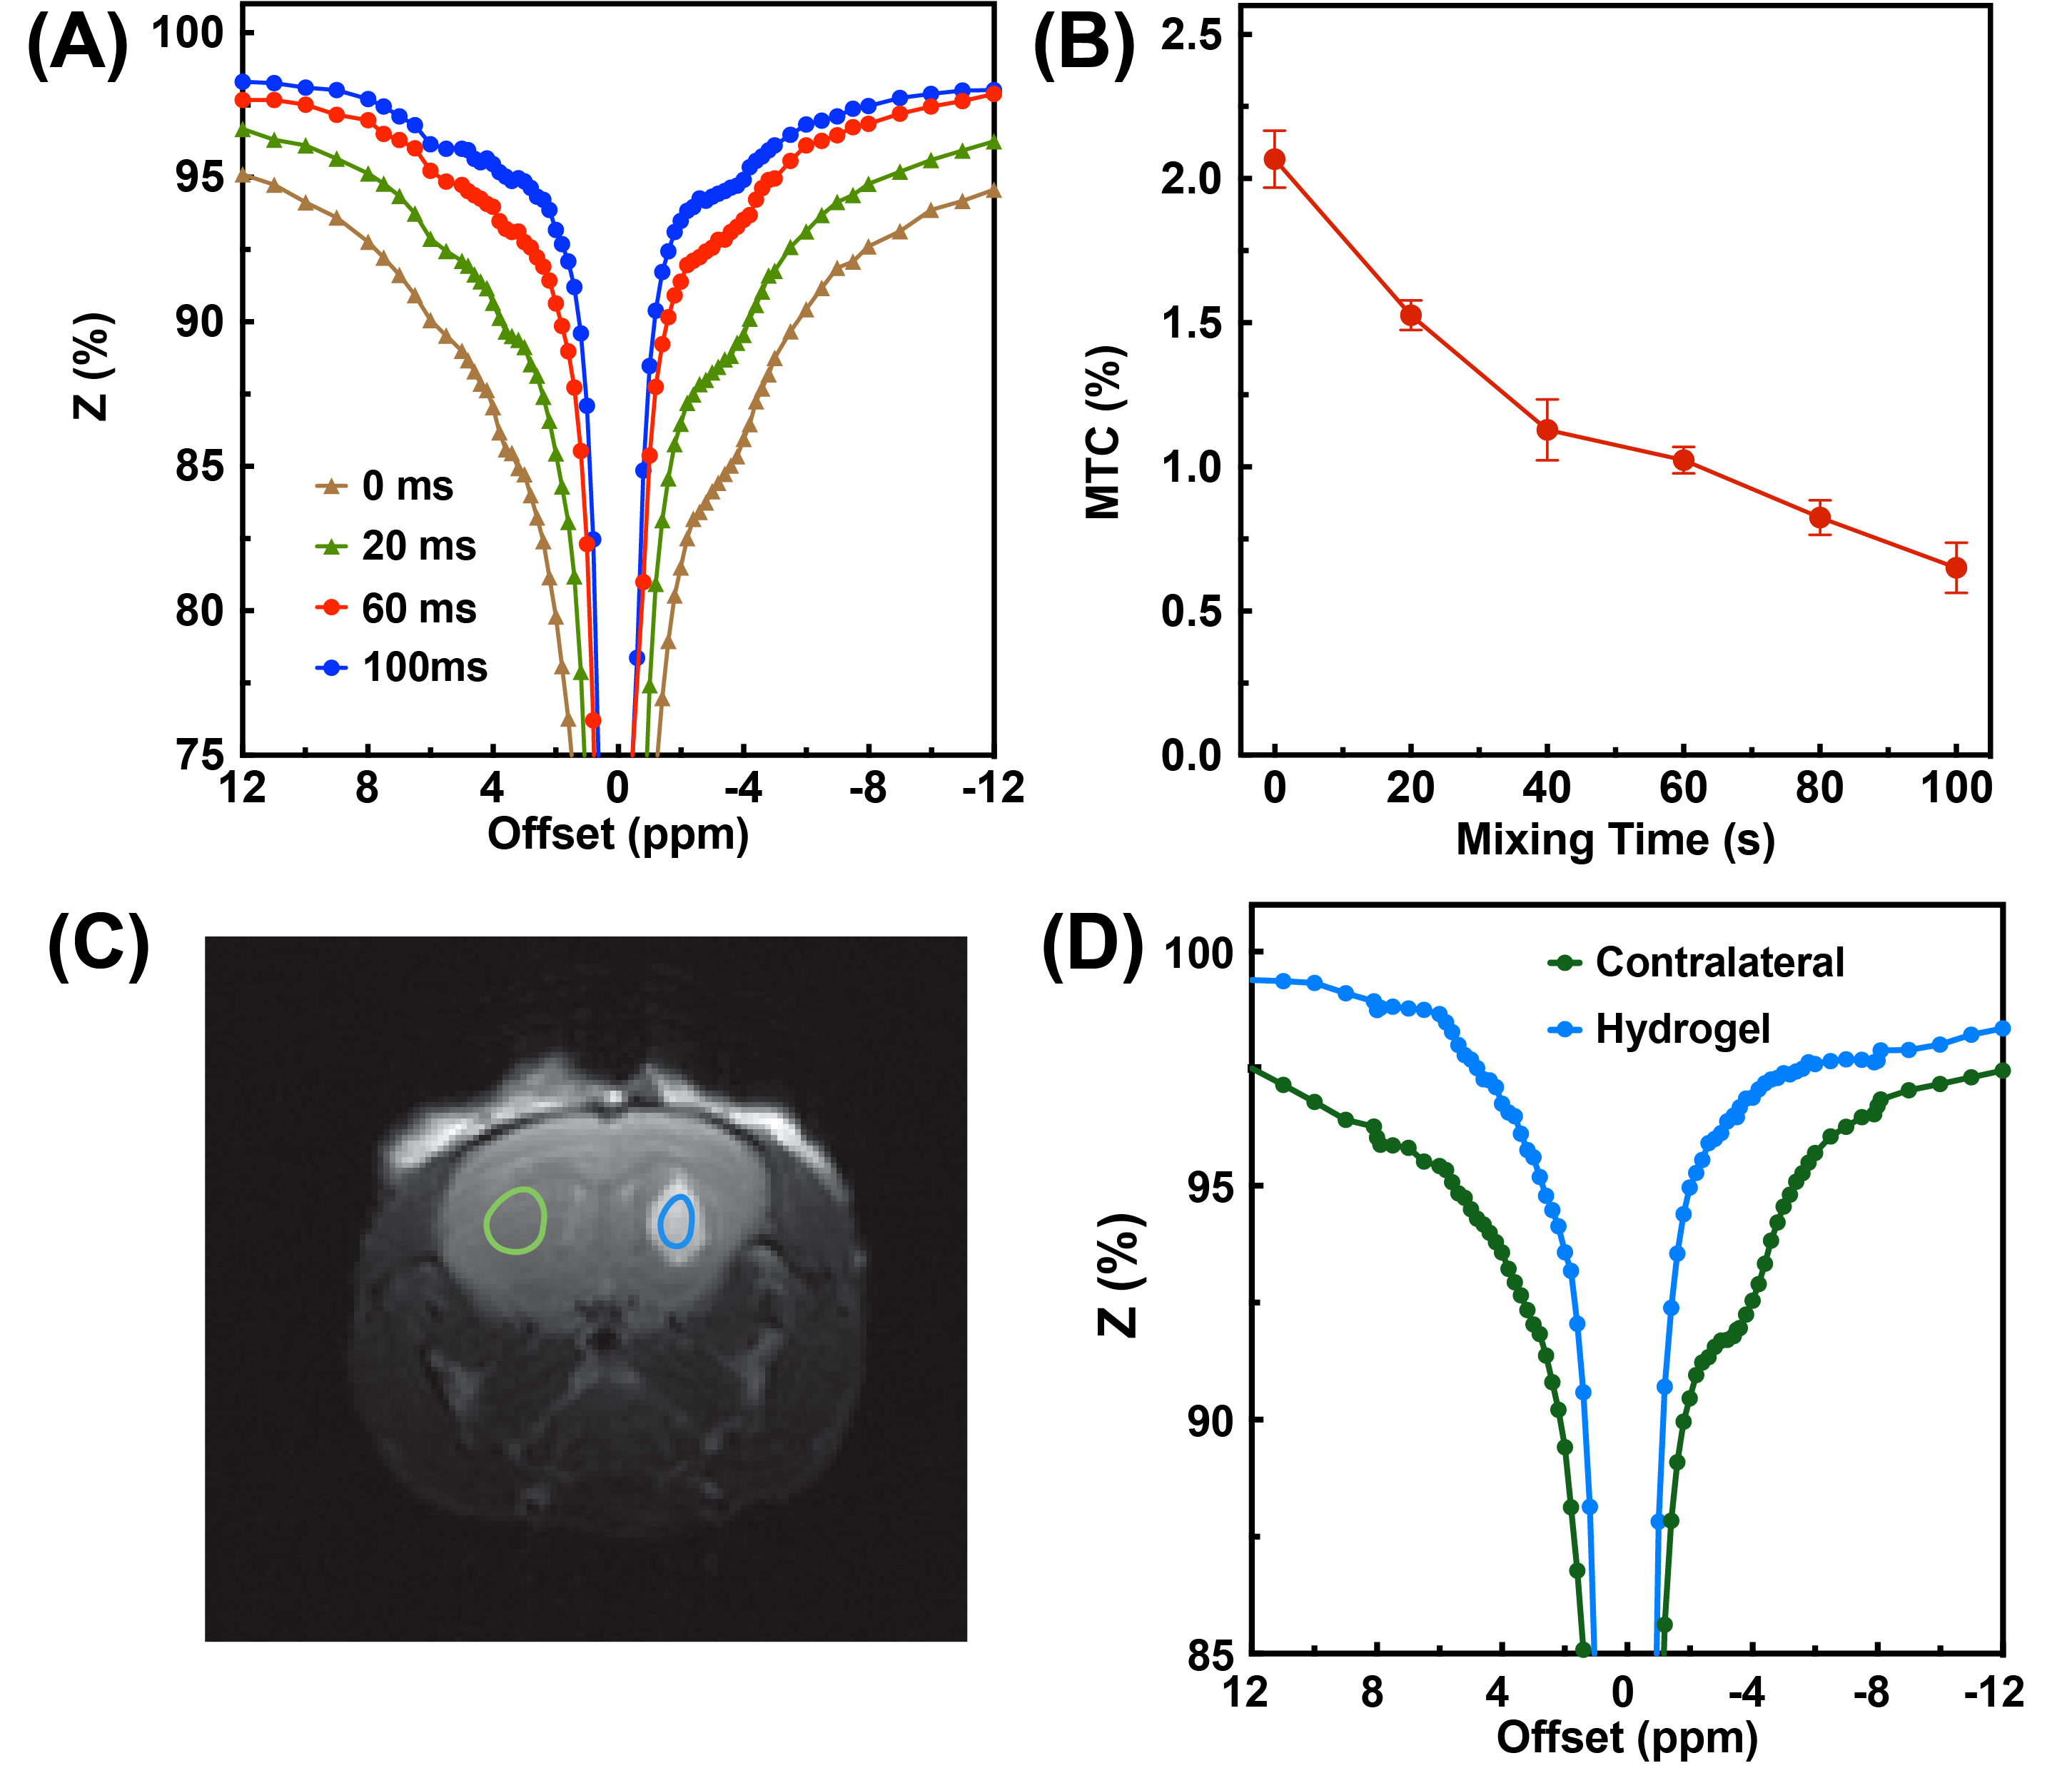
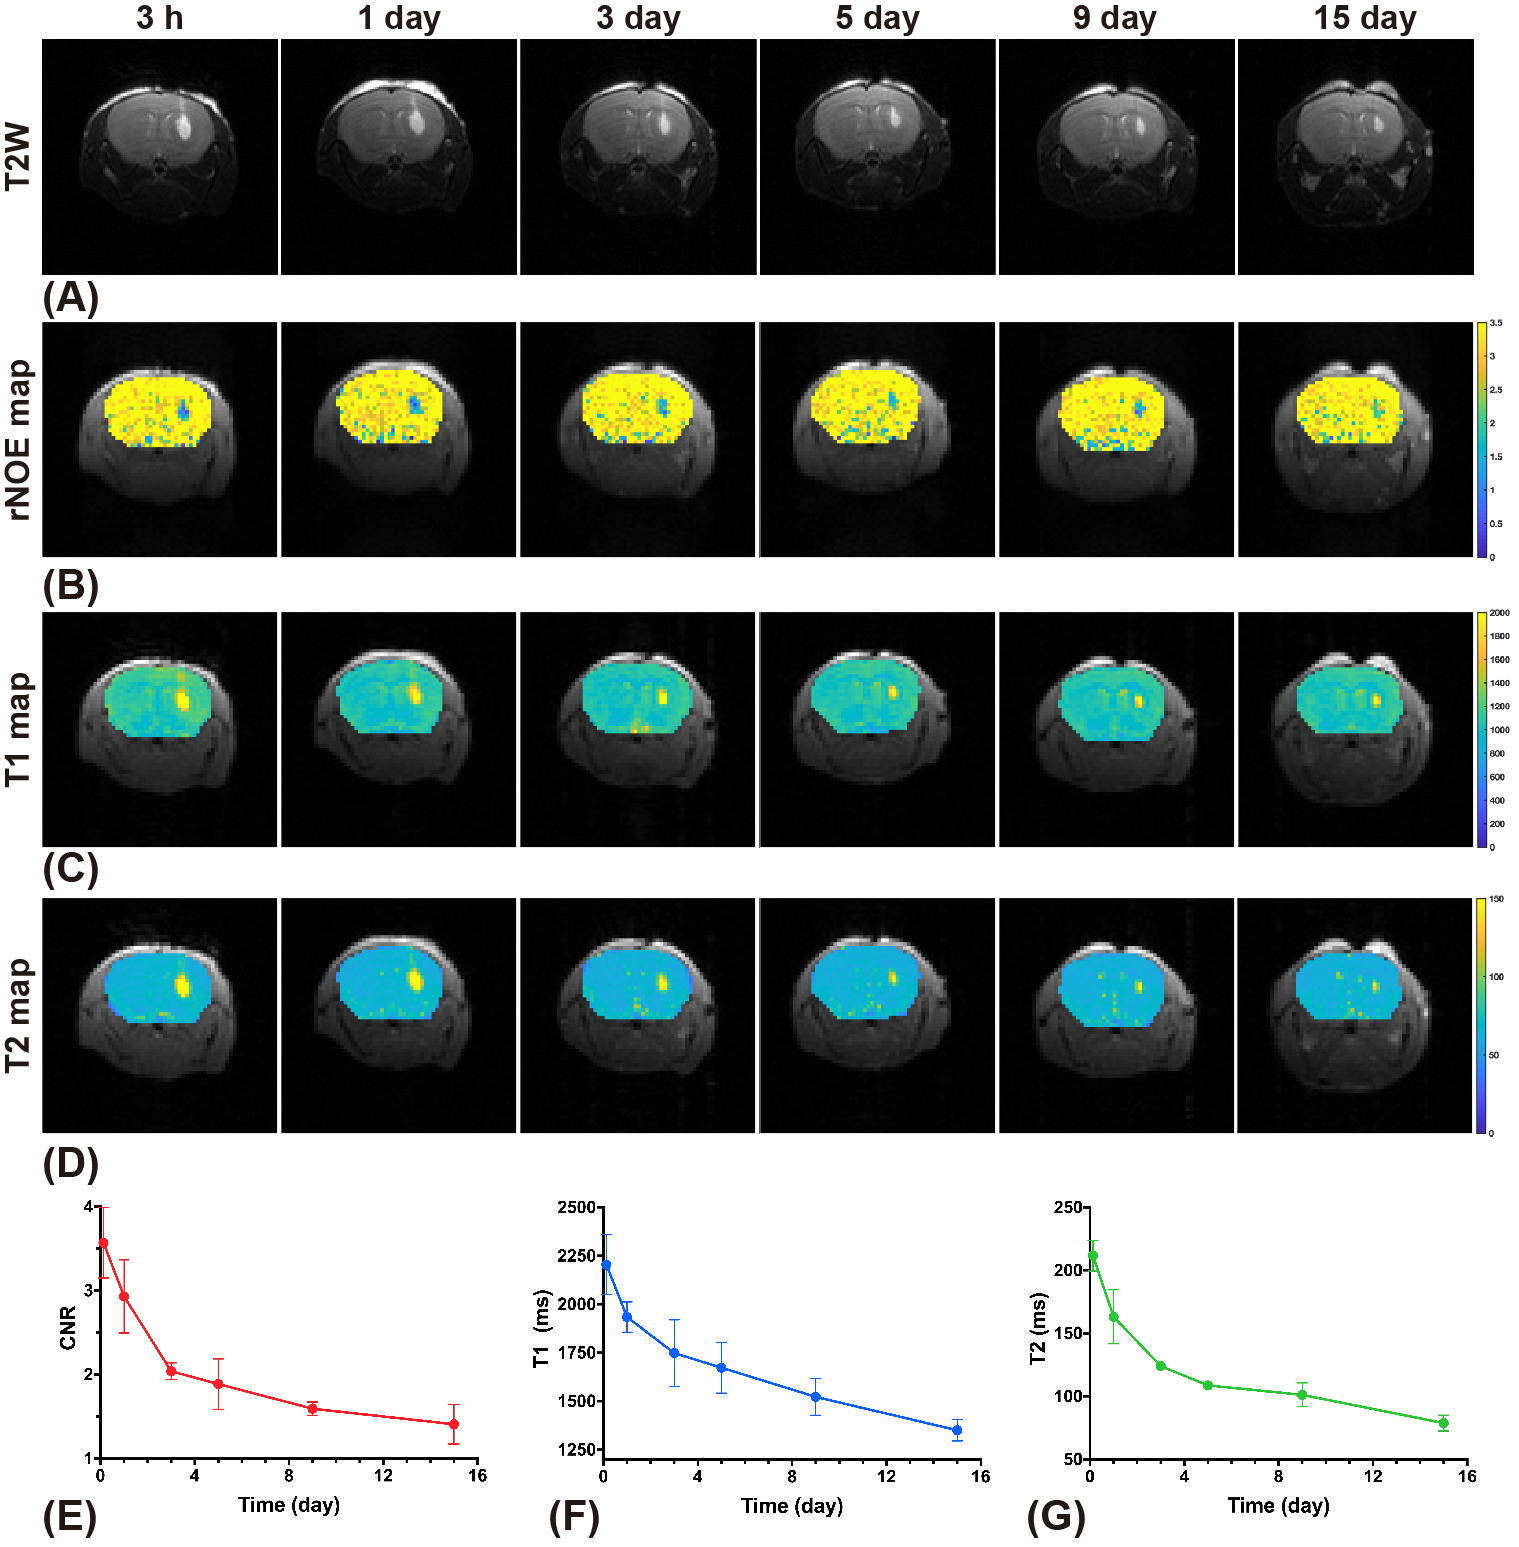
In CW-CEST/MT phantom experiments (Fig. 2), the saturation power dependent Lac(-3.4 ppm) peaks (Fig. 2C) showed the maximum Lac(-3.4 ppm) signal (5.7±0.2%) was achieved with a saturation power of 0.4 μT, similar to earlier studies (10). A saturation time of 3s is close to the steady-state CEST/MT contrast (6.1±0.3%) (Fig. 2D). In pulsed-CEST/MT experiments, a pulse width of 40 ms allowed the detection of a well-defined Lac(-3.4ppm) peak (Fig. 3D), and was used in the pulsed-CEST/MT studies. Maximum Lac(-3.4ppm) (6.3%±0.5%) was achieved with a saturation power of 0.8 μT (Fig. 3F), which is consistent to the CW-CEST/MT result considering the averaged saturation power for the pulsed-CEST/MT (0.8 μT) is 0.35 μT. The MTC decreased dramatically with respect to the mixing time, namely from 4.0±0.9% to 2.2±0.5% for a 60 ms mixing time, while Lac(-3.4ppm) signal did not change with mixing time (4.8±0.8% vs 4.7±0.7%). Thus, a mixing time of 60 ms was used in the following studies. The mixing time optimization results for normal mice (Figs. 4A,B) also showed that MTC/DS background between -5 to -12.5ppm depends strongly on the mixing time and reduced significantly for a 60 ms mixing time compared to zero mixing time (0.97±0.05% vs 2.08±0.10%, respectively). The alginate hydrogel in brain showed no a small asymmetic MTC signal (Fig. 4D), while the brain generated a larger asymmetric MTC and an apparent rNOE signal between -2ppm to -4ppm (Figs. 4A-D). This difference in contrast can be used to monitor the hydrogel degradation. The hydrogel degradation could also be observed in T2 weighted images, T1/T2 maps and rNOE maps, and corresponding quantitative curves (Figs. 5). The volume of hydrogel decreased rapidly over the first three days, followed by a slower decrease in later time points. In rNOE images, the signal is close to zero in the center, with increasing signal to the boundary, which is not observed in T1/T2 maps. This indicates that rNOE has higher specificity of monitoring the change of aliphatic protons of mobile proteins and lipids.Conclusion
Here, we developed a pulsed-CEST/MT acquisition scheme to obtain rNOE maps rapidly at 3T. As demonstrated in Lac+CrossBSA phantom and mouse brain with injected hydrogel, this method can effectively suppress MTC and DS while maintaining strong rNOE signal.Acknowledgements
We are grateful to receive funding support from the RGC [9042620], NSFC [81871409], City University of Hong Kong [9610362, 7200516, 7004859, 6000660].References
1. Cai K, Singh A, Poptani H, Li W, Yang S, Lu Y, Hariharan H, Zhou XJ, Reddy R. CEST signal at 2 ppm (CEST@ 2ppm) from Z‐spectral fitting correlates with creatine distribution in brain tumor. NMR Biomed 2015;28(1):1-8.
2. Jones CK, Huang A, Xu J, Edden RA, Schär M, Hua J, Oskolkov N, Zacà D, Zhou J, McMahon MT. Nuclear Overhauser enhancement (NOE) imaging in the human brain at 7 T. NeuroImage 2013;77:114-124.
3. Xu X, Yadav NN, Zeng H, Jones CK, Zhou J, van Zijl PC, Xu J. Magnetization transfer contrast–suppressed imaging of amide proton transfer and relayed nuclear overhauser enhancement chemical exchange saturation transfer effects in the human brain at 7T. Magn Reson Med 2016;75(1):88-96.
4. Desmond KL, Moosvi F, Stanisz GJ. Mapping of amide, amine, and aliphatic peaks in the CEST spectra of murine xenografts at 7 T. Magn Reson Med 2014;71(5):1841-1853.
5. Zhou IY, Wang E, Cheung JS, Zhang X, Fulci G, Sun PZ. Quantitative chemical exchange saturation transfer (CEST) MRI of glioma using Image Downsampling Expedited Adaptive Least-squares (IDEAL) fitting. Sci Rep 2017;7(1):84.
6. Chen L, Wei Z, Chan KW, Cai S, Liu G, Lu H, Wong PC, van Zijl PC, Li T, Xu J. Protein aggregation linked to Alzheimer's disease revealed by saturation transfer MRI. NeuroImage 2019;188:380-390.
7. Zaiss M, Windschuh J, Goerke S, Paech D, Meissner JE, Burth S, Kickingereder P, Wick W, Bendszus M, Schlemmer HP. Downfield‐NOE‐suppressed amide‐CEST‐MRI at 7 Tesla provides a unique contrast in human glioblastoma. Magn Reson Med 2017;77(1):196-208.
8. Zhang XY, Xie J, Wang F, Lin EC, Xu J, Gochberg DF, Gore JC, Zu Z. Assignment of the molecular origins of CEST signals at 2 ppm in rat brain. Magn Reson Med 2017;78(3):881-887.
9. Swanson SD. Protein mediated magnetic coupling between lactate and water protons. J Magn Reson 1998;135(1):248-255.
10. Yadav NN, Yang X, Li Y, Li W, Liu G, van Zijl PC. Detection of dynamic substrate binding using MRI. Sci Rep 2017;7(1):10138.
11. Hoffman AS. Hydrogels for biomedical applications. Adv Drug Deliver Rev 2012;64:18-23.
12. George M, Abraham TE. Polyionic hydrocolloids for the intestinal delivery of protein drugs: alginate and chitosan—a review. J Control Release 2006;114(1):1-14.
13. Xu X, Xu J, Chan KW, Liu J, Liu H, Li Y, Chen L, Liu G, van Zijl PC. GlucoCEST imaging with on‐resonance variable delay multiple pulse (onVDMP) MRI. Magn Reson Med 2019;81(1):47-56.
Figures