3139
Estimation of Glutamate-weighted CEST Contrast after Removal of Magnetization Transfer Effect in Human Brain and Rat Brain with Tumor1Centre for Biomedical Engineering, Indian Institute of Technology Delhi, New Delhi, India, 2Center for Magnetic Resonance & Optical Imaging, University of Pennsylvania, Philadelphia, PA, United States, 3Department of Biomedical Engineering, All India Institute of Medical Science, New Delhi, India
Synopsis
Asymmetry in MT causes erroneous GluCEST computation. The study focuses on removal of MT effects from Z-spectra for better quantification of GluCEST contrast using in-vivo human volunteer at 7T and rat brain with tumor at 9.4T. Different lineshapes for modelling and fitting broad MT spectrum has been compared. Lorentzian lineshape provided significant difference between GluCEST contrast before and after MT removal and also preserves the gray-matter to white-matter glutamate concentration ratio validated with MR spectroscopic based estimation. After removal of MT effect using Lorentzian lineshape, the specificity of GluCEST to glutamate concentration increases which can helps better diagnosis of diseases.
Introduction
Alternations in glutamate level have been observed in various neurological disorders1,2. Cai et al3 demonstrated an advanced and non-invasive MRI technique based on chemical exchange saturation transfer (CEST) for in vivo molecular mapping of glutamate with higher resolution compared to 1H MRS and PET. The computation of glutamate-weighted CEST (GluCEST) contrast using CEST asymmetry3,4 analysis is challenging due to confounding effects such as magnetization transfer (MT)5 from semi-solid macromolecules. The contribution of MT underestimates GluCEST contrast and there is no systematic study reported for removal of confounding effects to accurately measure GluCEST. Several studies6,7 reported fitting of MT spectrum at far off-resonance frequencies using different lineshapes. The primary objective of the study was estimation of GluCEST contrast after removal of MT contribution from Z-spectra. This study also focused on investigation of the appropriate lineshape to model MT pool for the given set of saturation pulse parameters used for GluCEST imaging.Methods
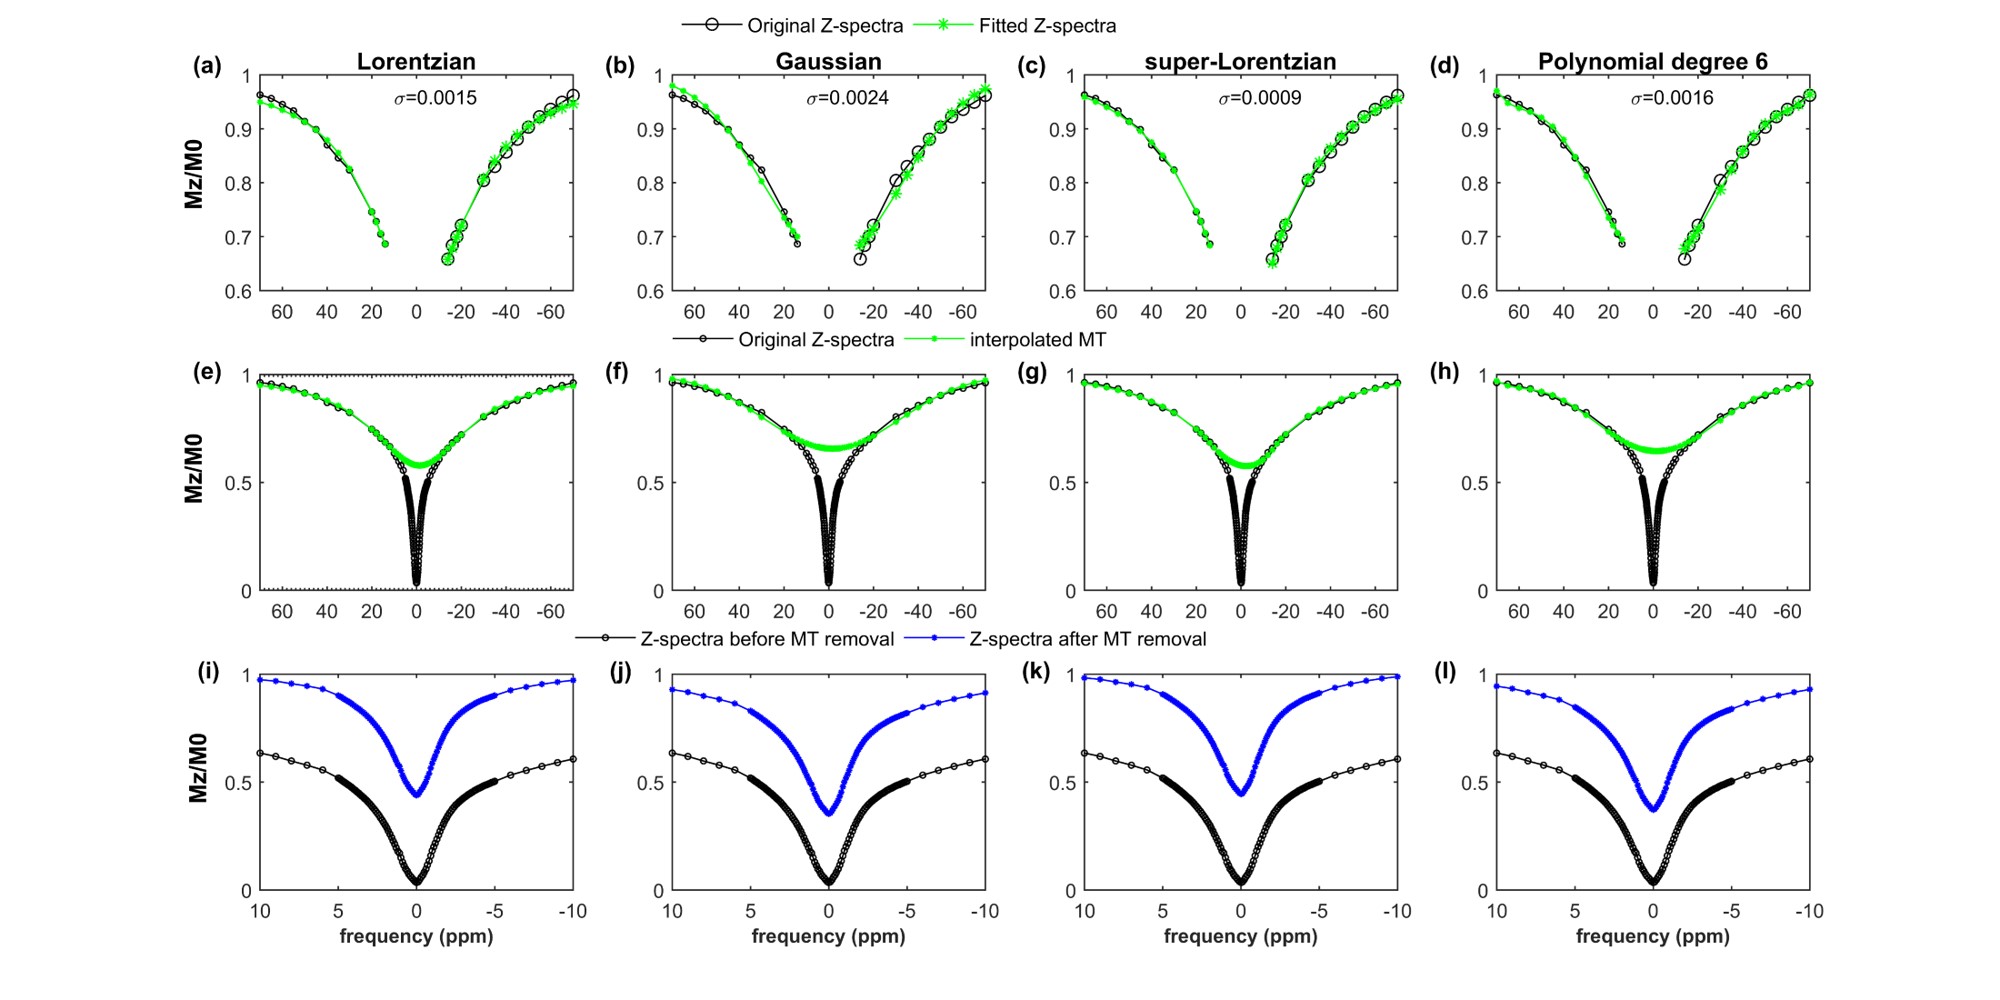
Human study: Six asymptomatic human volunteers (M:F=5:1;35±14.5years) were scanned at 7T MRI scanner (Siemens) at the University of Pennsylvania. The study protocol consisted of the following steps: three-plane localizer, WASSR8, CEST and B1 map data collection using pulse sequence reported previously3. 1H MRS was also carried out for three out of six healthy human volunteers on the same slice location as used in CEST data and spectra was acquired for voxels positioned on gray-matter (GM) and white-matter (WM) tissues. The acquired spectra were analyzed using LC model9 to compute the concentration of glutamate in GM and WM. For GluCEST imaging, Z-spectral data used in the current study were acquired from human brain at B1rms=2.9µT and duration=800ms. Partial Z-spectra at offset-frequencies (±100ppm to ±14ppm) were fitted to model semi-solid MT component with Lorentzian, Gaussian, super-Lorentzian and 6th degree polynomial function lineshapes. Average residual errors per pixel (σ) were calculated. The fitted MT component was interpolated over the whole offset frequency range and was removed from Z-spectra. GluCEST contrast was computed from modified Z-spectra (without MT component) at B1rms=2.9µT using equations (i),(ii)$$$ GluCEST_{M0} = \frac{M_{sat(-{\triangle}w)} - M_{sat(+{\triangle}w)}} { M_{0} }$$$ ..(i)
$$$GluCEST_{Neg} = \frac{M_{sat(-{\triangle}w)} - M_{sat(+{\triangle}w)}} { M_{sat(-{\triangle}w)} }$$$ .. (ii)
Msat(+∆ω) and Msat(-∆ω) are the signal intensities (SI) with (∆ω=3ppm) downfield and upfield with respect to water resonance. M0 is the SI without RF saturation. The difference between GluCEST maps before and after MT removal was compared using T-test (p<0.05 is significant). The Lorentzian, Gaussian and super-Lorentzian lineshapes6 are described in equation (iii),(iv),(v)
$$$g_{i}(2\pi(w-w_{0})) =A \times \frac{1} { 1+(2\pi(w-w_{0})\times T_{2m})^{2} }$$$ ..(iii)
$$$g_{i}(2\pi(w-w_{0})) =A \times e^{\frac{-(2\pi(w-w_{0})\times T_{2m})^{2}}{2}} $$$ ..(iv)
$$$g_{i}(2\pi(w-w_{0})) =A\times \int_{0}^{\frac{\pi}{2}}\frac{\sin\theta}{|3(\cos\theta)^{2}-1|} \times e^{\frac{-2\times (2\pi(w-w_{0})\times T_{2m})^{2}}{|3(\cos\theta)^{2}-1|^{2}}} d\theta $$$ ..(v)
w=offset-frequency from water-resonance, w0=offset-frequency of MT pool, $$$\theta$$$=dipolar Hamiltonian-angle, A=scaling-factor. T2m characterizes the linewidth of MT pool6. T2m, w0, A are parameters of fit.
Animal study: Preliminary study was performed at University of Pennsylvania. Rat gliosarcoma cells (9L) were injected on a Syngeneic female Fisher rat (F344/NCR, four-six weeks old). After 5 weeks of injection, the rat was scanned on 9.4T animal scanner (Varian) at B1rms=5.9µT, duration=1s. CEST images were collected at multiple frequencies (ppm) ±100, ±50, ±25, ±12 to ±6 with step-size of 2, ±5 to ±0 with step-size of 0.25ppm.
Results
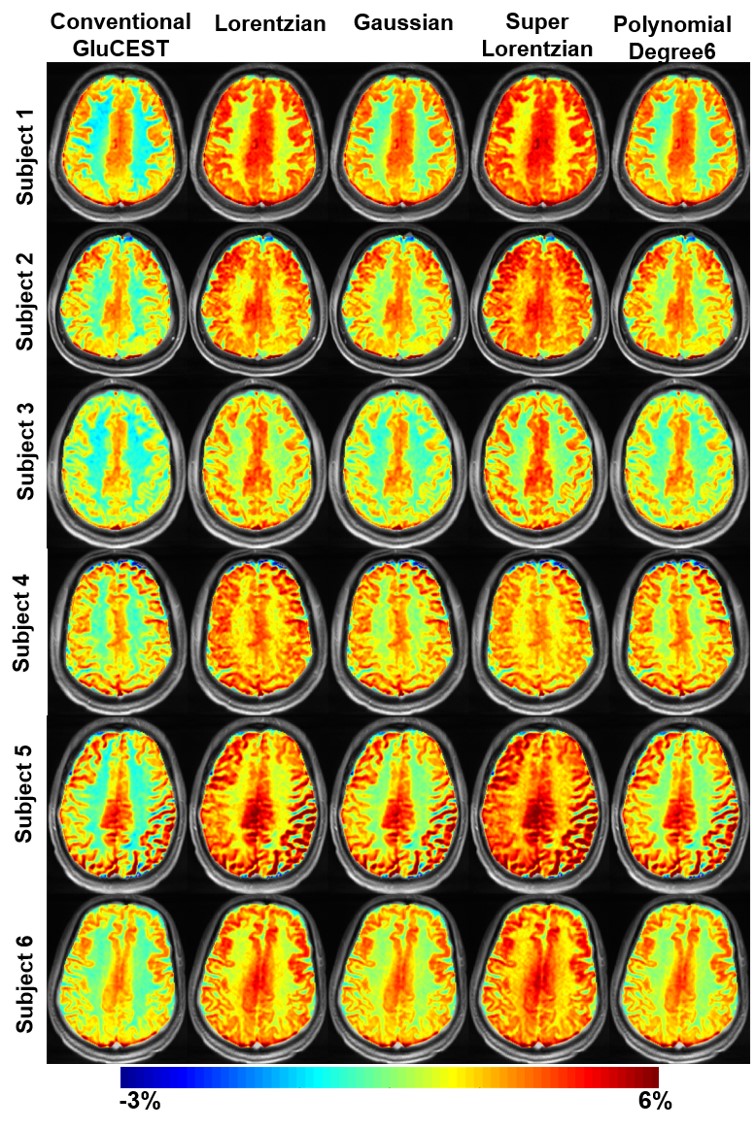
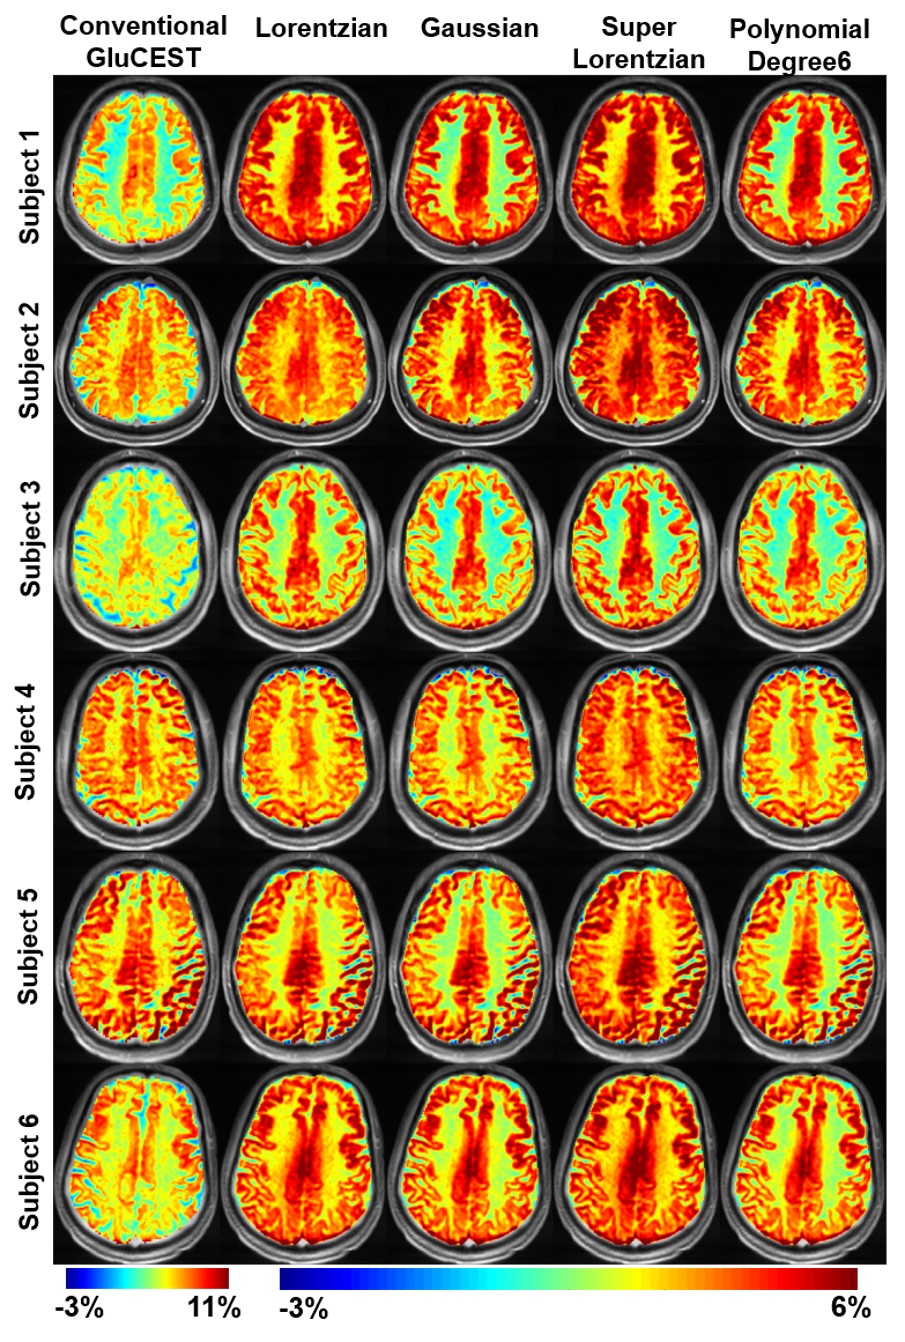
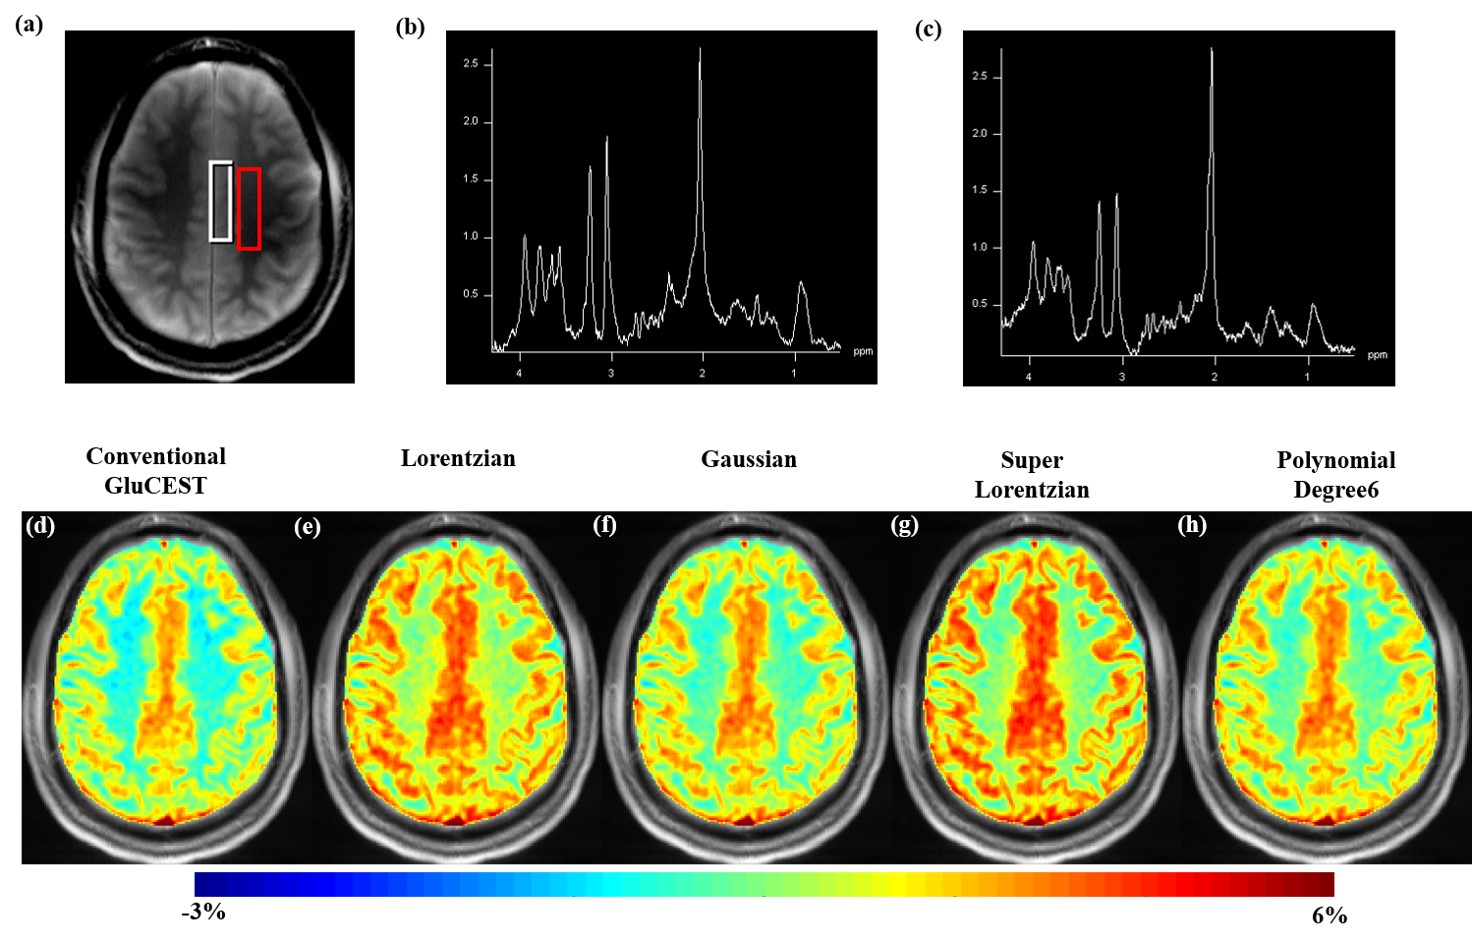
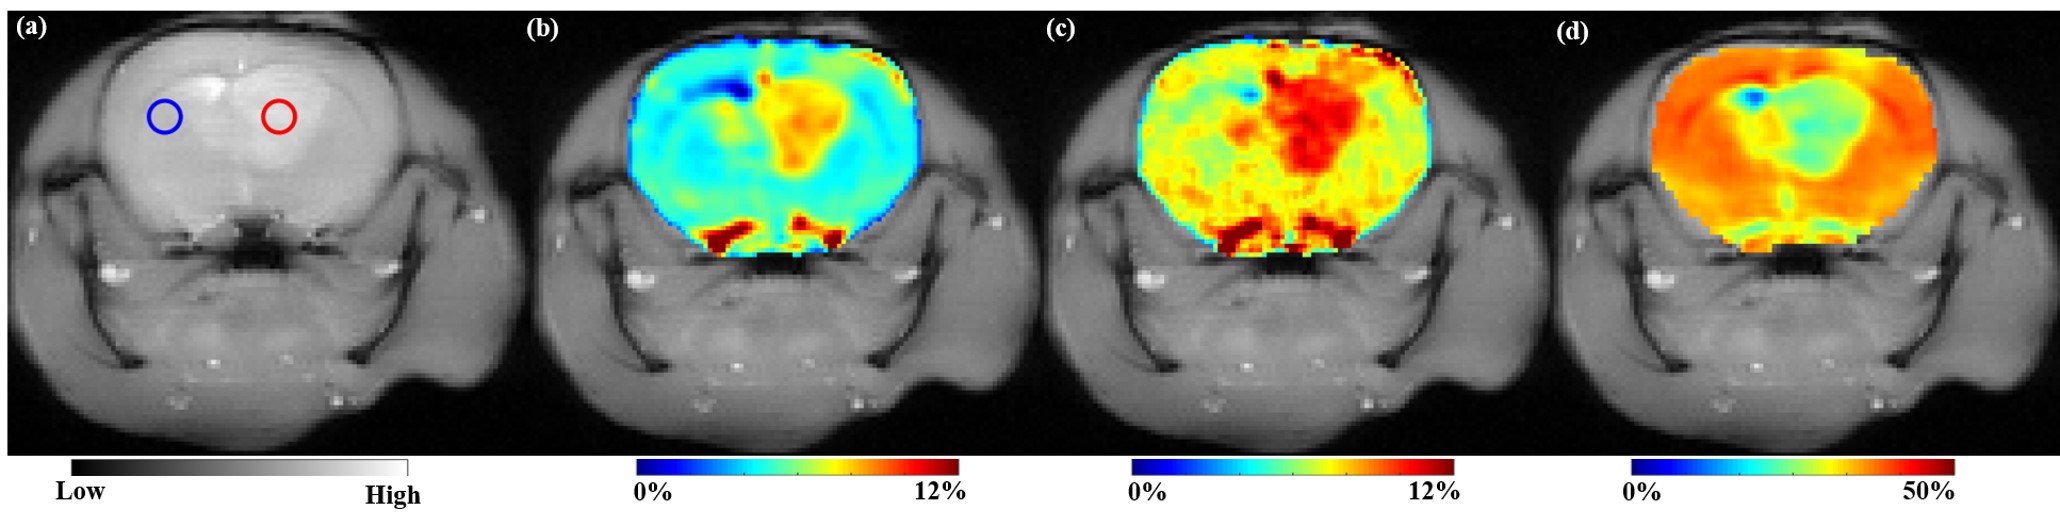
Better accuracy of fitting far-off resonance Z-spectra was achieved with super-Lorentzian (σ=0.0009) and Lorentzian (σ=0.0017) compared to other lineshapes (Fig.1). After MT removal, there was significant (p<0.01) increase in GluCESTM0 (Fig.2) and decrease in GluCESTNeg contrast (Fig.3). Spectroscopic results (Fig.4) showed that the glutamate concentration ratio in GM/WM was 1.6±0.13. After MT removal, GluCESTNeg and GluCESTM0 contrast-ratio in GM/WM was 1.47±0.35 and 1.52±0.26 respectively using Lorentzian lineshape, which is closest to spectroscopic result compared to other linehshapes. Before MT removal, the GluCESTM0 contrast in the tumor region was 8.59% compared to contra-lateral region (4.71%) (Fig.5b). After MT removal using Lorentzian lineshape, GluCESTM0 contrast was 10.72% the tumor region compared to contra-lateral region (7.19%) (Fig.5c).Discussion
MT effect produces inherent asymmetry10 in the Z-spectra causing a systematic contamination in the quantification of GluCEST. At the saturation parameters of GluCEST imaging, contribution of CEST effects from amide, creatine, glucose, myoinositol, etc is significantly less11,12. Thus the major confounding effect to GluCEST contrast is asymmetry in MT and is quite important to remove from Z-spectra while computing GluCEST. Though super-Lorentzian fits better to model MT component, the quantity of the MT removed from Z-spectra is appropriate using Lorentzian due to preservation of GluCEST contrast-ratio. The amount of MT removed from Z-spectra is overestimated using super-Lorentzian and underestimated using Gaussian and polynomial. The pre-clinical application showed importance of removal of MT component. MT uncorrected GluCESTM0 contrast is 82% higher in tumor than contra-lateral normal region. Due to MT, GluCESTM0 map shows false elevation of contrast in tumor region. After MT removal, accurate GluCESTM0 contrast was estimated and was 50% higher in tumor region compared with normal region.Conclusion
The improved estimation of GluCEST contrast is feasible after removal of MT component. This increases the specificity of GluCEST to glutamate concentration which might have potential in diagnosis and treatment monitoring of diseasesAcknowledgements
This study was supported by Indian Institute of Technology Delhi, Fortis hospital and University of Pennsylvania. This study was partially supported by funding support from MATRICS, SERB-DST Grant number: MTR_2017_001021. The authors acknowledge Dr. Puneet Bagga for technical discussions and Deepa Thakuri for data acquisition.References
1. Marsman A, Van DHMP, Klomp DWJ, et al. Glutamate in schizophrenia: A focused review and meta-analysis of 1H-MRS studies. Schizophrenia Bulletin 2013; 39:120–129
2. Rupsingh R, Borrie M, Smith M, et al. Reduced hippocampal glutamate in Alzheimer disease. Neurobiol Aging 2011; 32:802–810
3. Cai K, Haris M, Singh A, et al. Magnetic resonance imaging of glutamate. Nat med 2012; 18:302–306
4. Kogan F, Singh A, Debrosse C, et al. Imaging of glutamate in the spinal cord using GluCEST. NeuroImage 2013;77:262–267
5. Sled JG. Modelling and interpretation of magnetizaion transfer imaging in the brain. Neuroimage 2018. 182 128-135
6. Morrison C, Stanisz G, Henkelman RM. Modeling Magnetization Transfer for Biological-like Systems Using a Semi-solid Pool with a Super-Lorentzian Lineshape and Dipolar Reservoir. J Magn Reson 1995; 108:103–113
7. Tozer D, Ramani A, Barker GJ, et al. Quantitative magnetization transfer mapping of bound protons in multiple sclerosis. Magn Reson Med 2003; 50:83–91
8. Kim M, Gillen J, Landman BA, et al. Water saturation shift referencing (WASSR) for chemical exchange saturation transfer (CEST) experiments. Magn Reson Med 2009;61:1441–1450
9. Provencher SW. Automatic quantitation of localized in vivo 1H spectra with LC Model. NMR Biomed 2001; 14, 260-264.
10. Hua J, Jones CK, Blakeley J ,et al. Quantitative description of the asymmetry in magnetization transfer effects around the water resonance in the human brain. Magn Reson Med 2007; 58:786–793
11. Jin T, Wang P, Zong X, Kim SG. MR imaging of the amide-proton transfer effect and the pH-insensitive nuclear overhauser effect at 9.4 T. Magn Reson Med 2013; 69:760–770
12. Liu D, Zhou J, Xue R, et al. Quantitative characterization of nuclear overhauser enhancement and amide proton transfer effects in the human brain at 7 Tesla. Magn Reson Med 2013; 70:1070–1081
Figures