3136
Inhomogeneous magnetization transfer saturation (ihMTsat): efficient centric-encoded GRE implementation with B1 inhomogeneity correction1Neurology and Neurosurgery, McGill University, Montreal, QC, Canada, 2McConnell Brain Imaging Center, McGill Unversity, Montreal, QC, Canada, 3Techna Institute, University Health Network, Toronto, ON, Canada, 4Department of Biomedical Engineering, McGill Unversity, Montreal, QC, Canada, 5Department of Neurology and Neurosurgery, McGill Unversity, Montreal, QC, Canada, 6Hotchkiss Brain Institute and Departments of Radiology and Clinical Neuroscience, University of Calgary, Calgary, AB, Canada
Synopsis
Inhomogeneous magnetization transfer (ihMT) contrast in the brain has been reported to be a myelin-specific biomarker, but can be impacted by B1 inhomogeneities, reducing its accuracy. ihMT equations incorporating B1 correction assume a single excitation and readout, either a k-space line or plane, per saturation module. Here we use an arbitrary number of readout segments collected after an MT saturation preparation module. T1 and B1 variations are included in the signal equations to increase specificity of the contrast to the microstructure. The resulting implementation yields a balance between acquisition efficiency and contrast resolution for different brain imaging applications.
Introduction
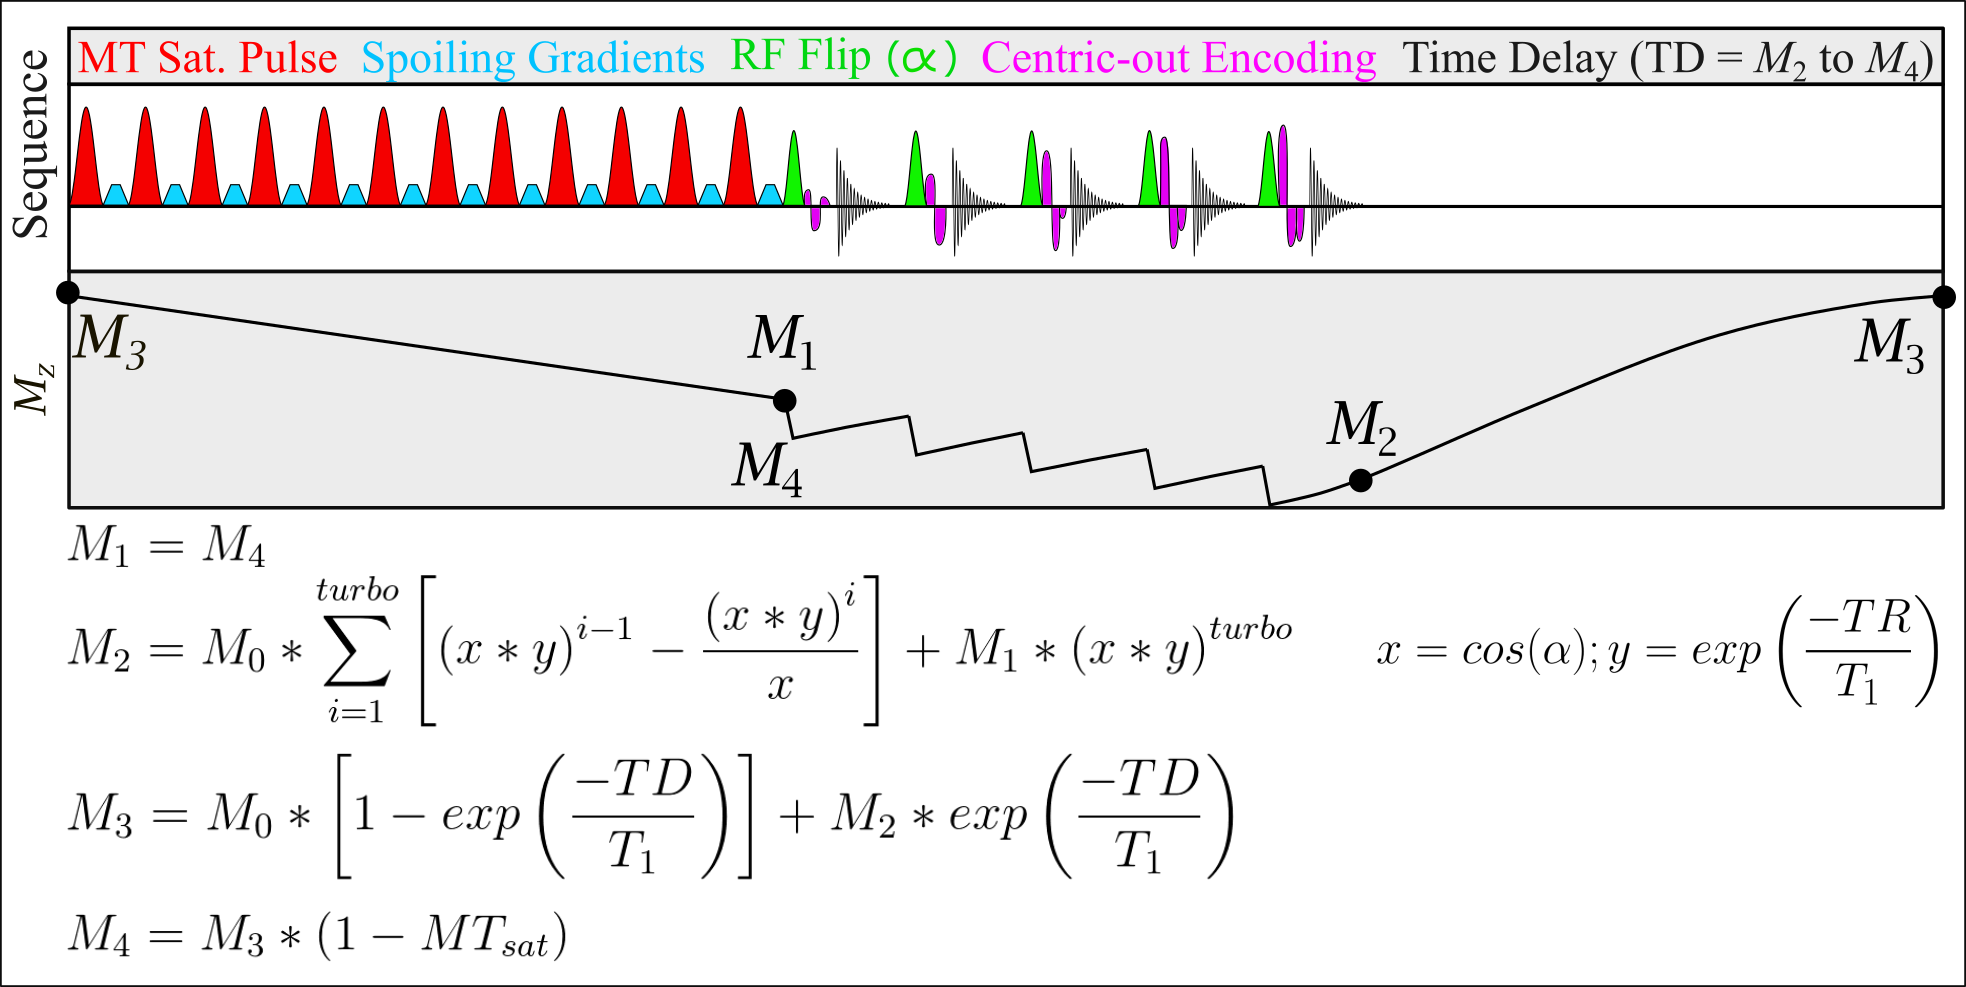
Inhomogeneous magnetization transfer (ihMT) is a novel contrast mechanism that has been reported to have enhanced myelin specificity compared to conventional MT imaging1. The ihMT contrast is primarily driven by the size of the semi-solid dipolar coupled pool, where it is produced during single frequency offset MT saturation but not in dual frequency MT saturation, following from Provotorov theory2. Thus, the difference between dual and single frequency MT-weighted images can provide insight into the dipolar coupled pool. Methylene groups, which are abundant in lipid-rich membranes such as myelin, are a dominant contributor to the dipolar coupled pool in the human brain3, which promotes increased myelin-specificity with decreased contribution to the contrast from proteins. The saturation of a dipolar coupled pool is necessary for the formation of ihMT contrast, which requires the use of strong B1 MT pulses. While multi-echo GRE readouts have been used previously4, there has not been an effort to correct for the decrease in the formation of the dipolar coupled pool, and ultimately the resulting ihMT contrast, due to B1 inhomogeneity. This work addresses the problem by deriving the Bloch equations for a centric-out encoded MT-RAGE sequence (Figure 1), with an arbitrary number of readout lines. Centric-out encoding is important to obtain high MT-weighted contrast in images with longer echo trains. Following the framework of Deichmann et al.5, the magnetization preparation was modified to be a percentage drop in the steady state signal due to the MT pulses (termed here MTsat). Swanson et al. have previously described the equations to calculate the ihMT-ratio (ihMTR) provided the T2B and T1B value for the semisolid pool are known, as well as the dipolar relaxation time (T1D) of the tissue3. Since grey matter (GM) and white matter (WM) have similar T1D values6, the impact of B1 on the formation of the dipolar pool can be approximated and used to restore the ihMT contrast in images.Methods
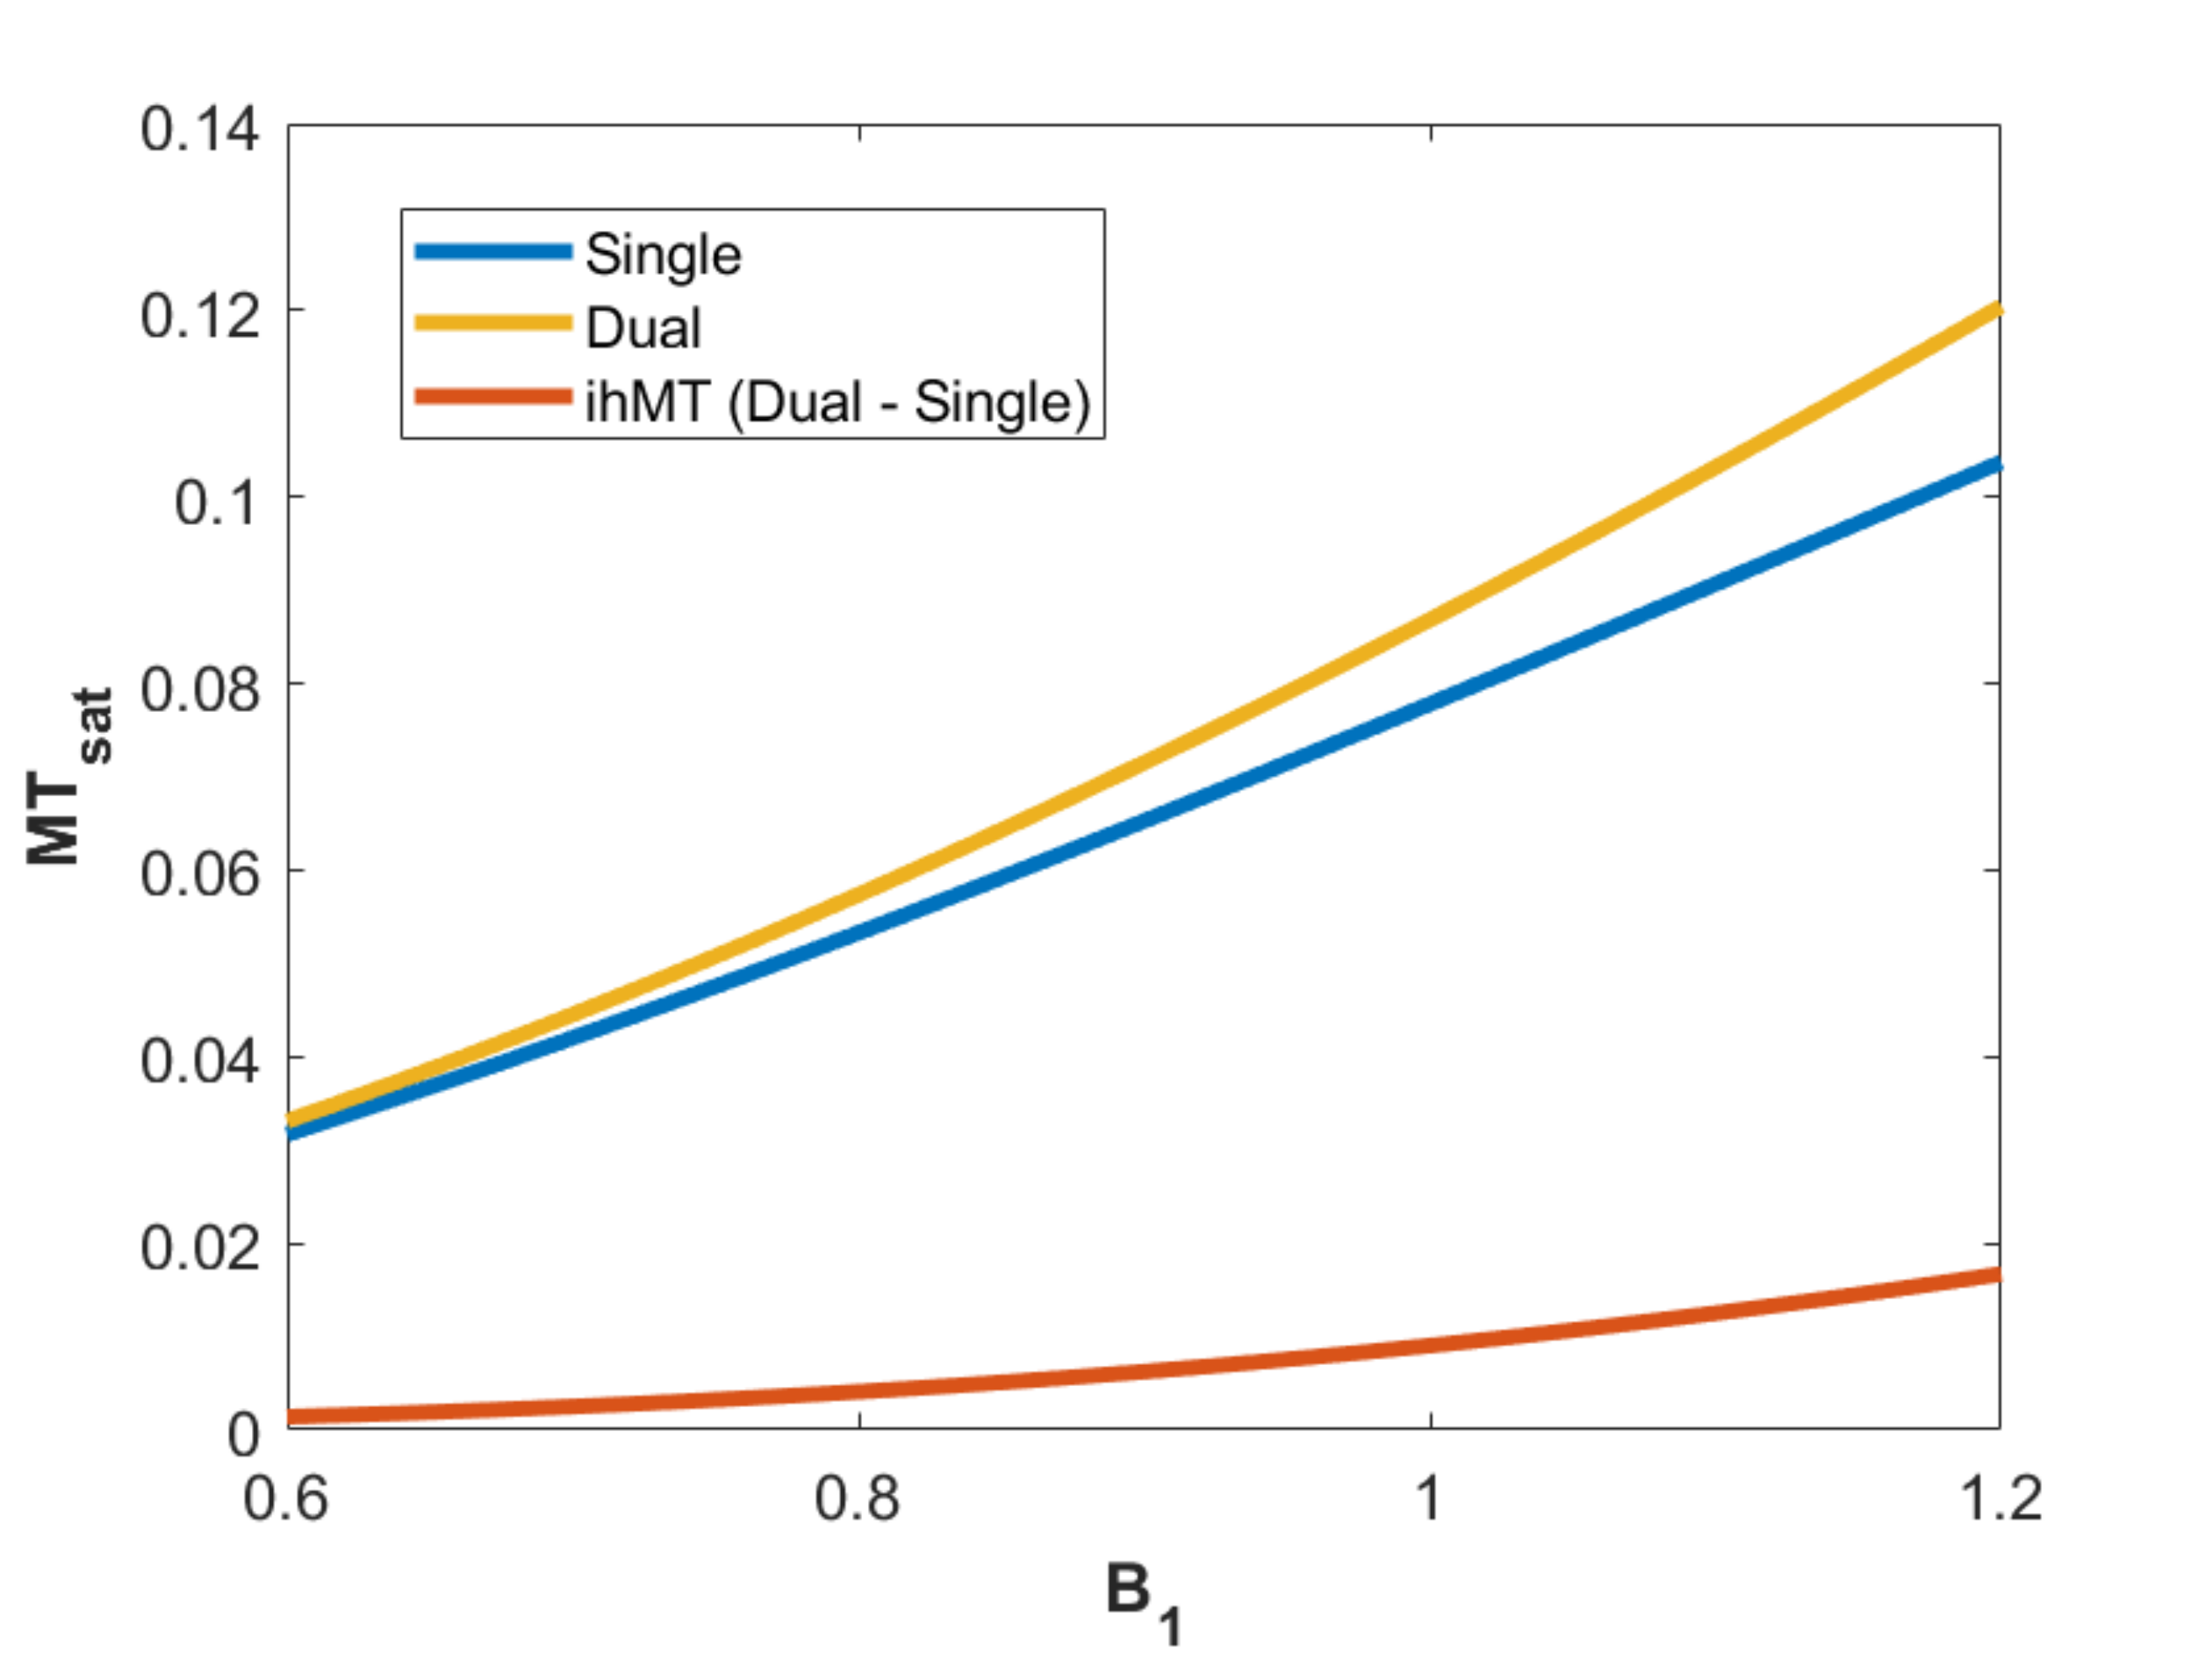
One healthy volunteer was scanned on a 3T Siemens Prisma MRI system with a 64-ch head receive coil. T1 mapping was performed using the variable flip angle method with the following parameters: α1 = 5°, α2 = 20°, TR = 30ms. MT-weighted images were subsequently collected using the following parameters: Δf=7kHz, B1=9.8μT, 12 MT pulses in each preparation module (each RF with 0.96 ms duration, 1.76 ms spacing), α = 5°, 11 readouts per 175ms TR, and 5.3ms echo-spacing for the GRE kernel. The central frequency for the MT pulses was shifted by -100Hz to better align with the center of the lipid pool1. All images were collected with 1.5mm isotropic resolution and 250Hz/px bandwidth. B1 7 and B0 maps were also collected.T1 and M0 values were calculated based on variable flip angle8 analysis of the images without MT contrast. The steady state signal was solved using the equations in Figure 1 in each voxel over a range of MTsat values. This required the following input values for each voxel: T1, M0, B1 values to correct the excitation flip angle α, and the B1 correction factor to address the non-linear impact of B1 on MT saturation. The latter was calculated using the equations from Swanson et al.3, assuming T2B = 12µs 9, T1D = 6ms 6, T1B = 25ms 10, and a super-Lorentzian lineshape. The theoretical MTsat was determined for a range of B1 values, which were normalized by the MTsat value at the relative B1 of 1.
ihMTsat was calculated as the difference between the saturation in the dual vs single offset frequency cases. ihMTR was calculated for comparison by using the 5° flip angle image with no MT preparation from the VFA experiment to normalize the signal change. The brain was manually skull-stripped using ITK-SNAP (http://www.itksnap.org), and GM and WM tissues were segmented using the FANTASM algorithm11 on the masked R1 map. Mid-depth surfaces were generated using CBS tools (www.nitrc.org/projects/cbs-tools/), and MR values were displayed on the cortical surface in MATLAB using Surfstat (www.math.mcgill.ca/keith/surfstat/).
Results and Discussion
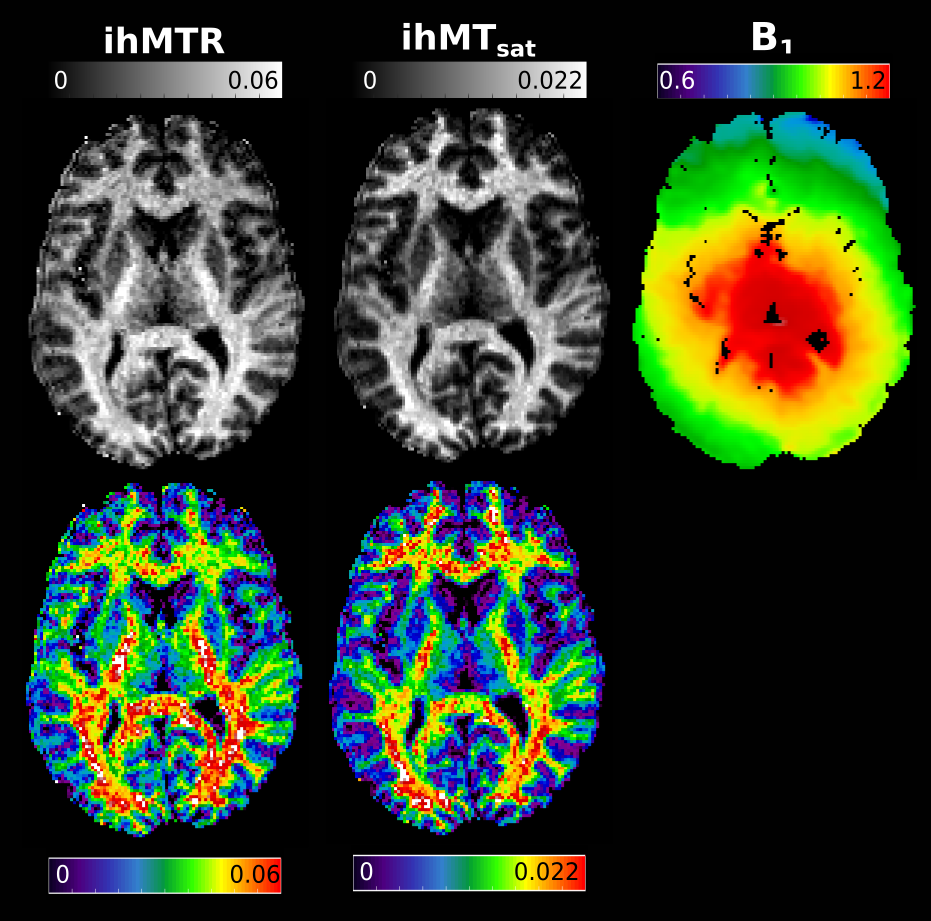
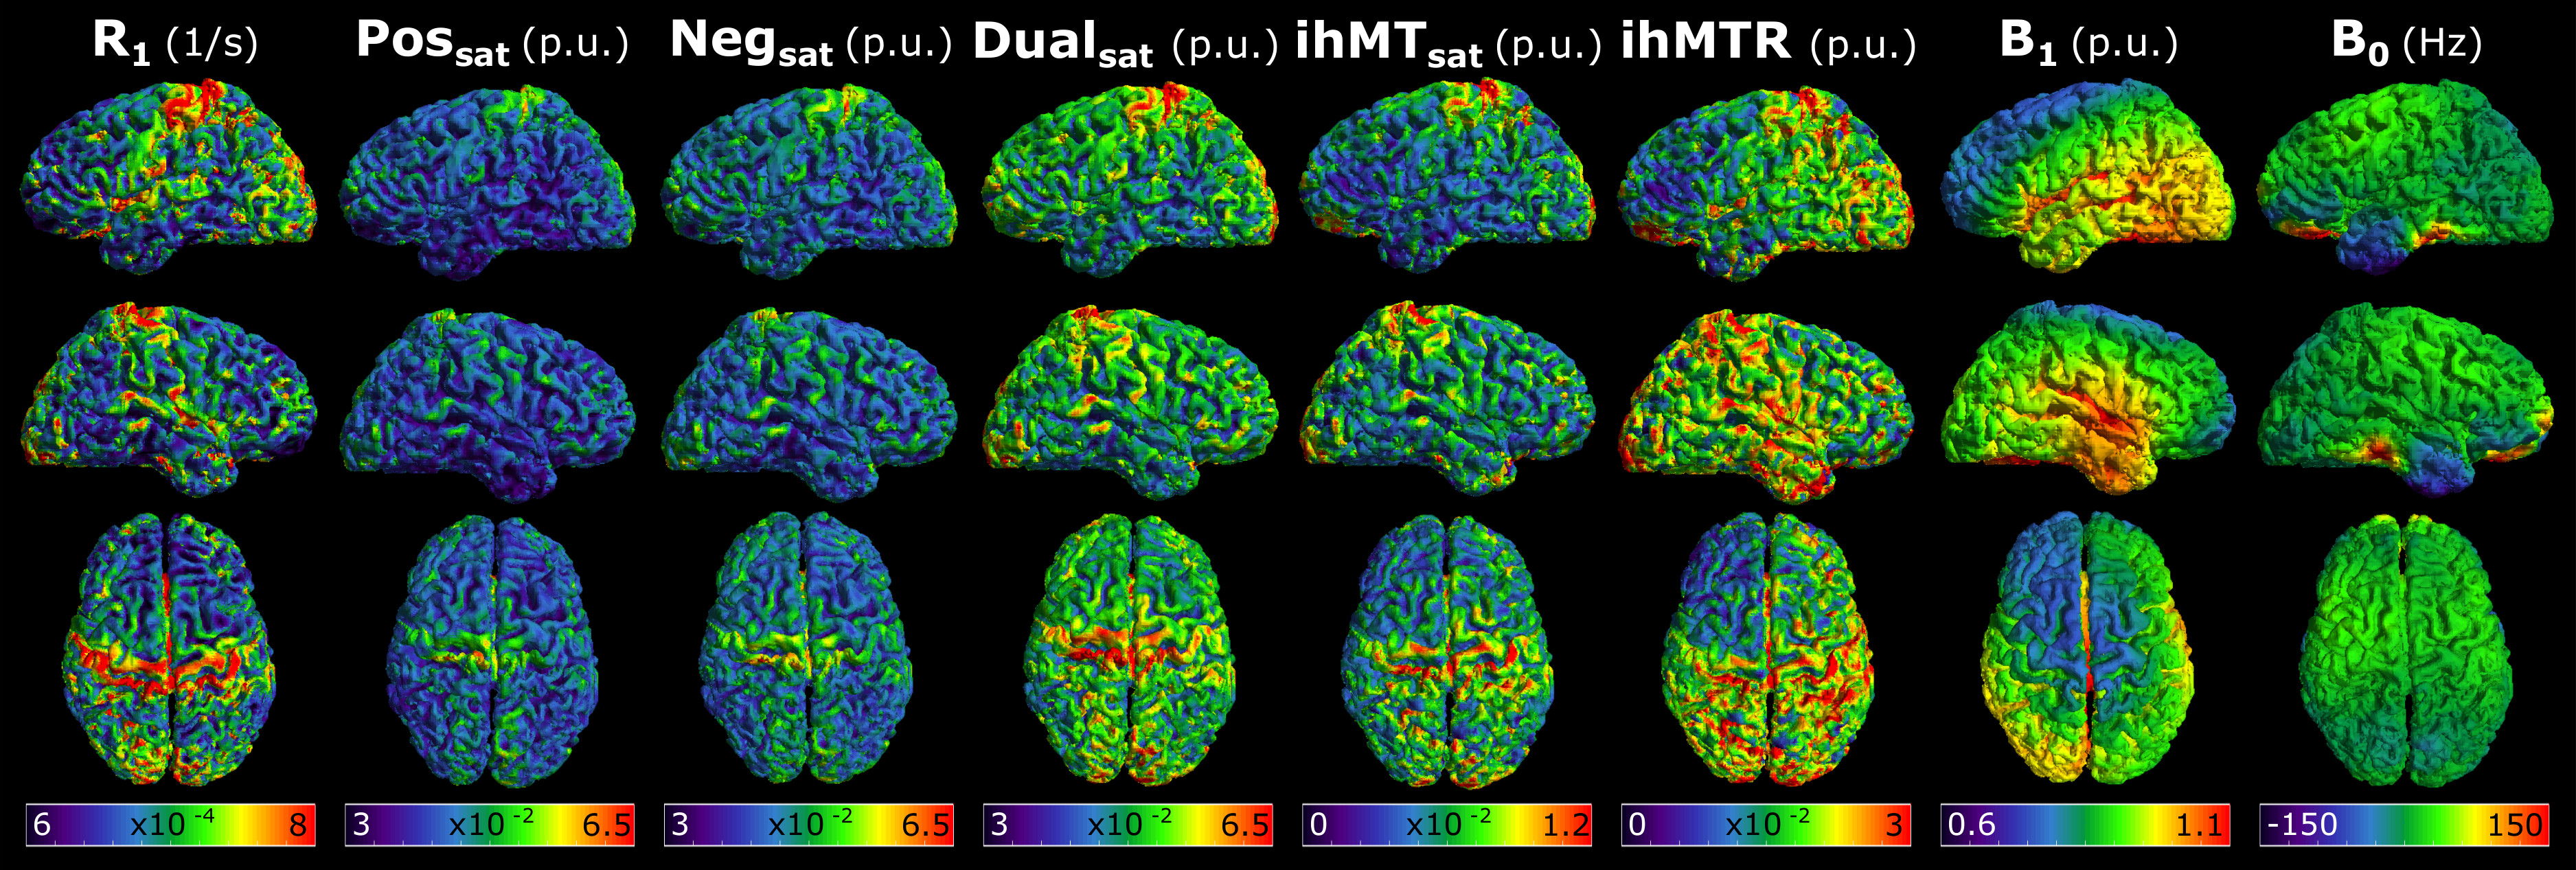
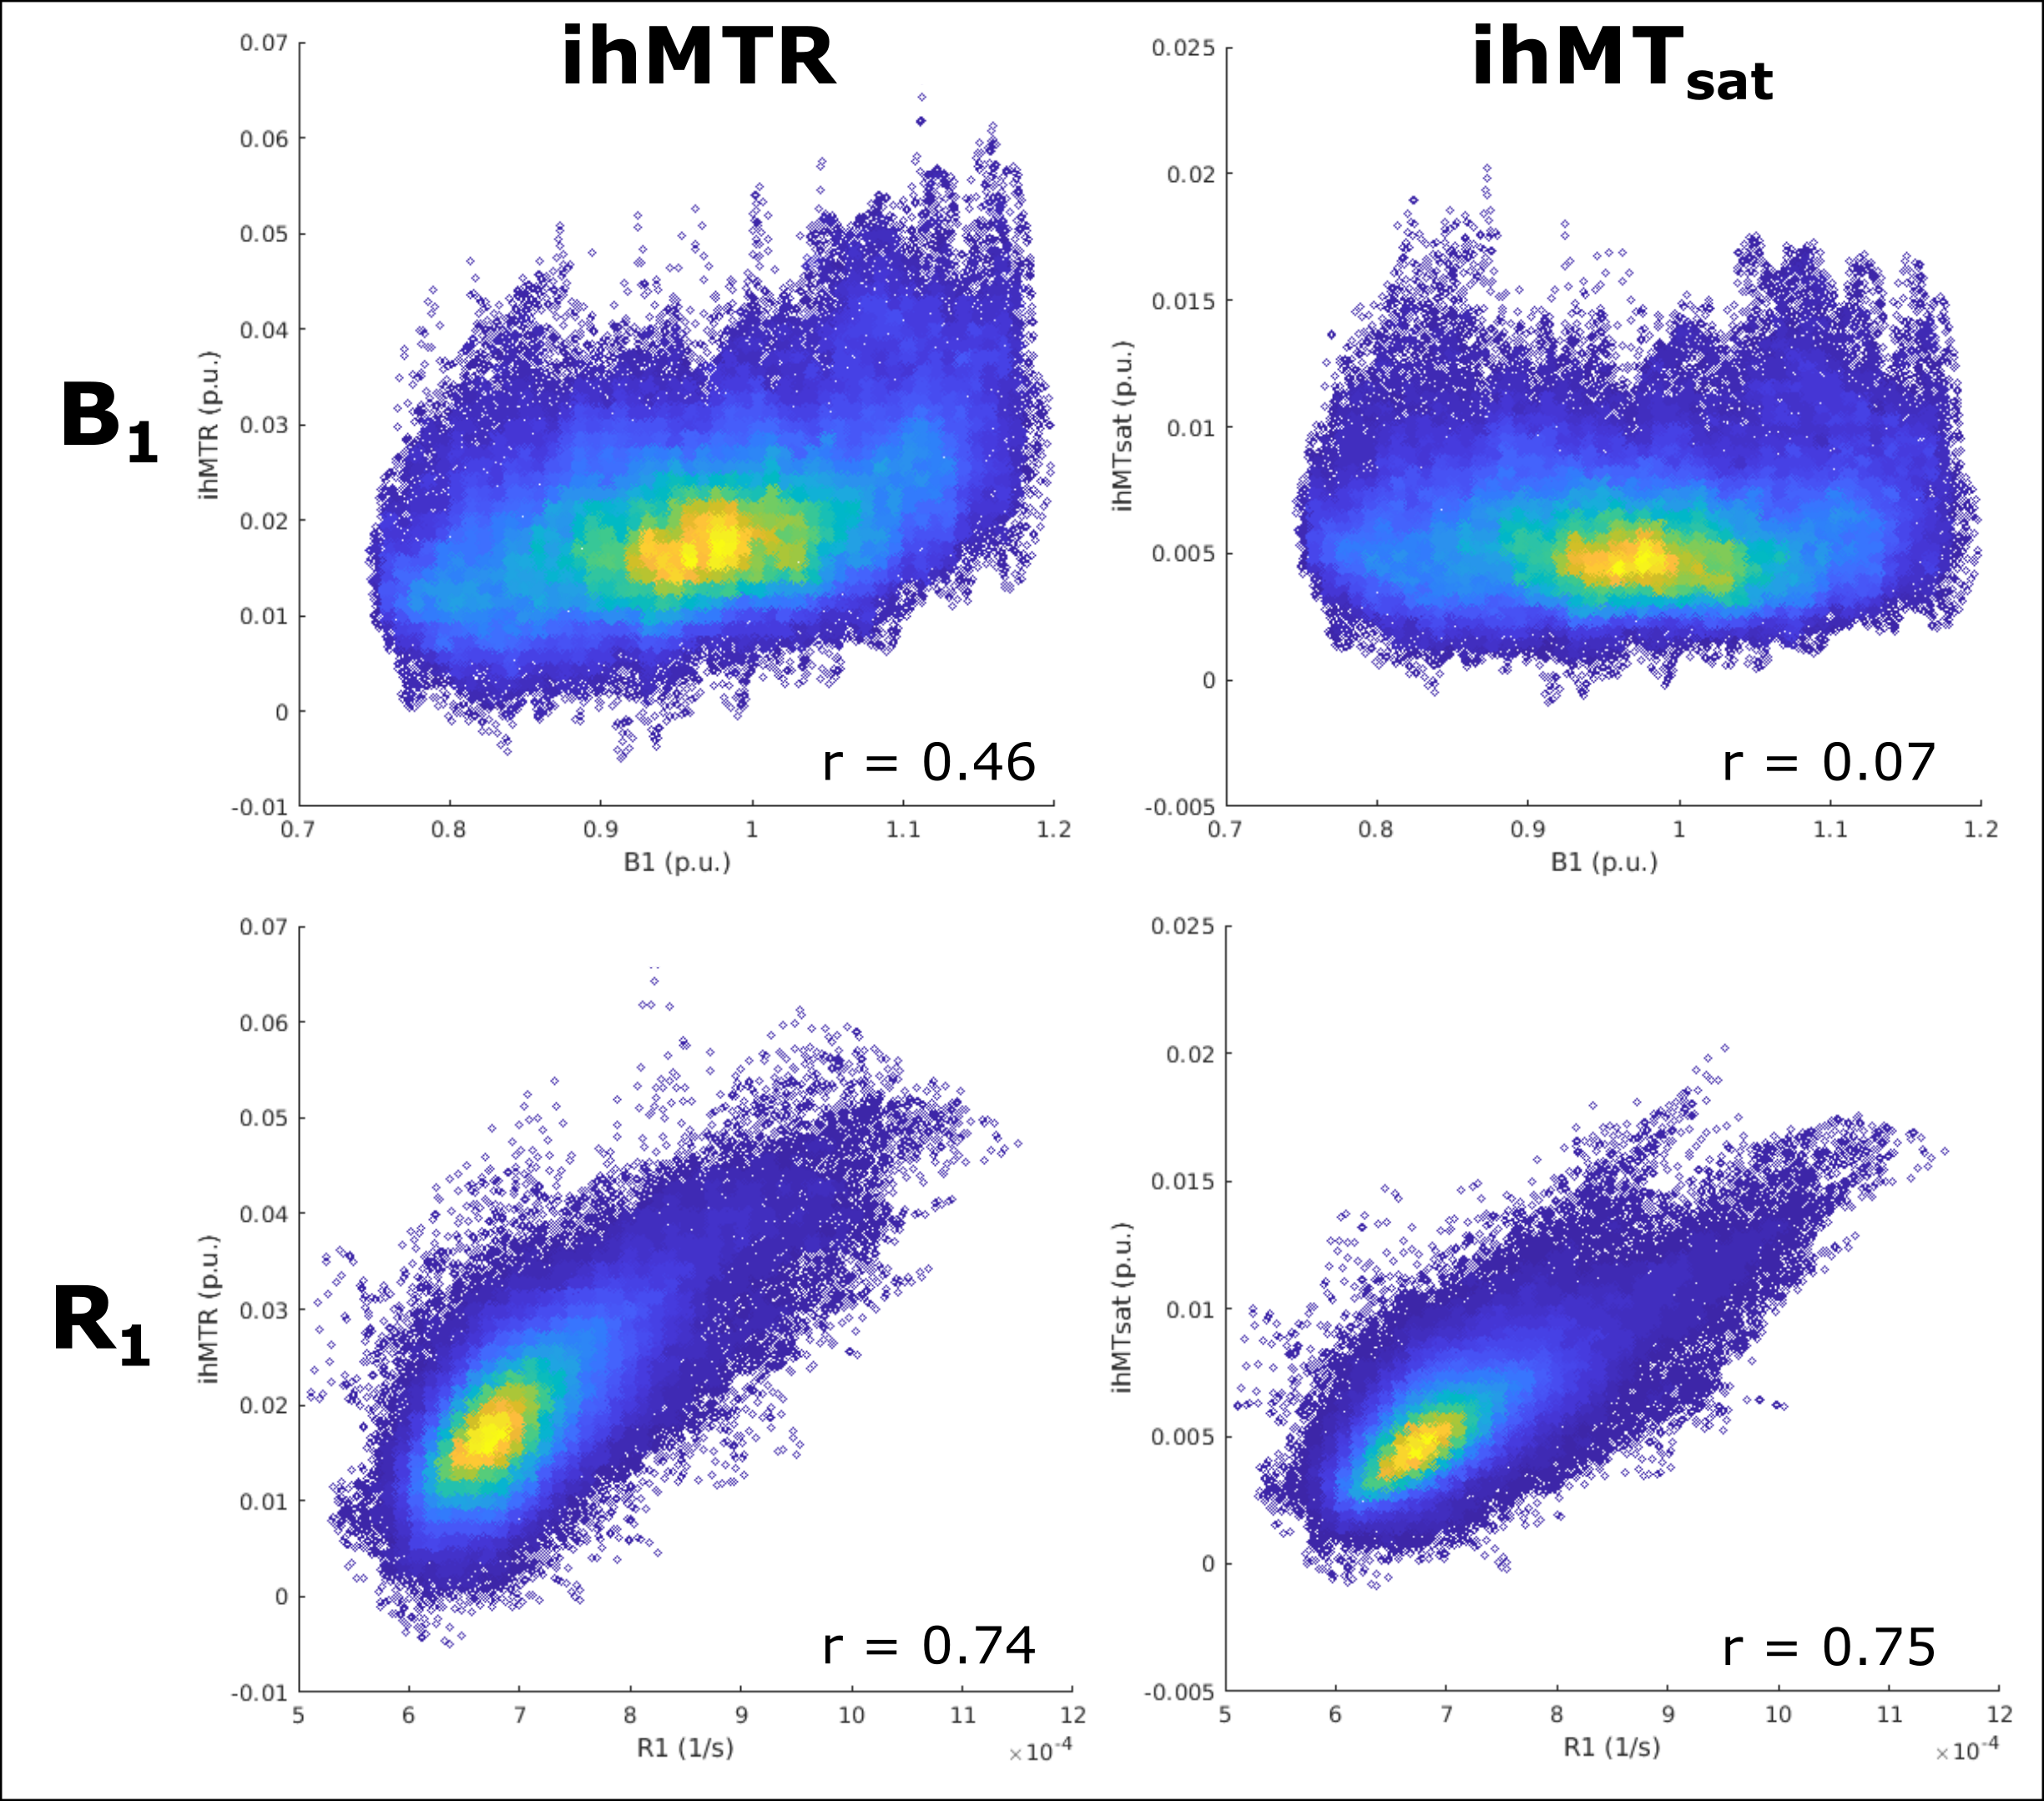
Figure 3 presents ihMTR and ihMTsat values in an axial brain slice for visual comparison of the two metrics, as well as the impact of B1 on each. Figure 4 displays the calculated maps mapped onto the mid-cortical surface, derived from the equations in Figure 1 and smoothed with a 4.5mm kernel. The ihMTsat map follows the myelination patterns across the cortex as suggested by the R1 map. The ihMTR map varies significantly from this pattern, which appears to be due to spatial non-uniformity in B1. Cortical variations in ihMTsat and ihMTR are plotted against B1 and R1 values in Figure 5. Cortical ihMTR is strongly correlated with B1 (r = 0.46), whereas ihMTsat displays no correlation with B1 (r = 0.07). Both ihMTR (r = 0.74) and ihMTsat (r = 0.75) show correlations with the myelin-sensitive metric R1.Conclusion
Our results support that ihMTsat is a sensitive marker of cortical myelination with minimal bias from B1 inhomogeneity. This formulation of ihMT may be more sensitive to the underlying microstructure compared to ihMTR, in particular in high and ultra-high field applications in humans where B1 inhomogeneity and SAR constraints may impact the formation of a large dipolar coupled pool.Acknowledgements
No acknowledgement found.References
1. Duhamel, G. et al. Validating the sensitivity of inhomogeneous magnetization transfer (ihMT) MRI to myelin with fluorescence microscopy. Neuroimage 199, 289–303 (2019).
2. Provotorov, B. N. Theory of double magnetic resonance in solids. Phys. Rev. 128, 75–76 (1962).
3. Swanson, S. D. et al. Molecular, dynamic, and structural origin of inhomogeneous magnetization transfer in lipid membranes. Magn. Reson. Med. 77, 1318–1328 (2017).
4. Mchinda, S. et al. Whole brain inhomogeneous magnetization transfer (ihMT) imaging: Sensitivity enhancement within a steady-state gradient echo sequence. Magn. Reson. Med. 79, 2607–2619 (2018).
5. Deichmann, R., Good, C. D., Josephs, O., Ashburner, J. & Turner, R. Optimization of 3-D MP-RAGE sequences for structural brain imaging. Neuroimage 12, 112–127 (2000).
6. Varma, G. et al. In vivo measurement of a new source of contrast, the dipolar relaxation time, T1D , using a modified inhomogeneous magnetization transfer (ihMT) sequence. Magn. Reson. Med. 78, 1362–1372 (2017).
7. Chung, S., Kim, D., Breton, E. & Axel, L. Rapid B1+mapping using a preconditioning RF pulse with turboFLASH readout. Magn. Reson. Med. 64, 439–446 (2010).
8. Christensen, K. A., Grant, D. M., Schulman, E. M. & Walling, C. Optimal determination of relaxation times of Fourier transform nuclear magnetic resonance. Determination of spin-lattice relaxation times in chemically polarized species. J. Phys. Chem. 78, 1971–1976 (1974).
9. Sled, J. G. & Bruce Pike, G. Quantitative imaging of magnetization transfer exchange and relaxation properties in vivo using MRI. Magn. Reson. Med. 46, 923–931 (2001).
10. Brown, M. F., Ribeiro, A. A. & Williams, G. D. New view of lipid bilayer dynamics from 2H and 13C NMR relaxation time measurements. Proc. Natl. Acad. Sci. U. S. A. 80, 4325–4329 (1983).
11. Pham, D. L. & Prince, J. L. Adaptive Fuzzy Segmentation of Magnetic Resonance Images. 18, 737–752 (1999).
Figures