3135
Quantitative magnetization transfer (MT) of tissue from subjects with multiple sclerosis using inhomogeneous MT (ihMT) data1Division of MR Research, Radiology, Beth Israel Deaconess Medical Center, Harvard Medical School, Boston, MA, United States, 2Department of Pathology, Beth Israel Deaconess Medical Center, Harvard Medical School, Boston, MA, United States, 3CNRS, CRMBM, Aix-Marseille Univ, Marseille, France
Synopsis
Quantitative magnetization transfer (MT) was carried out using inhomogeneous MT (ihMT) data, following optimization of an acquisition protocol. The optimized protocol was applied in ex-vivo brain tissue from a donor with multiple sclerosis (MS), as well as tissue containing an MS plaque. Parameter maps output from quantitative MT showed white and grey matter contrast, as well as a lower restricted or bound pool fraction in the area of the MS plaque from histology. Results from quantitative MT using ihMT were compared with those using selective inversion recovery, as well as quantitative outputs from diffusion tensor MRI.
Introduction
The inhomogeneous magnetization transfer (ihMT) experiment observes the difference between MT sequences applied with single or dual off-resonance RF at the same power1. This makes ihMT sensitive to the dipolar relaxation time, T1d, along with the other parameters associated with quantitative MT2,3. The addition of T1d makes for a more complete MT model and the model allows intrinsic properties of the tissue to be estimated from ihMT data independent of the acquisition details4. Use of ihMT can be more informative of diseases involving myelin than regular MT, as exemplified by application in multiple sclerosis (MS)5. This work concentrates on extraction of quantitative MT parameters from ihMT data in ex-vivo brain tissue samples from subjects with MS. A preliminary comparison to other state-of-the-art MRI techniques for investigating tissue microstructure was also conducted.Methods
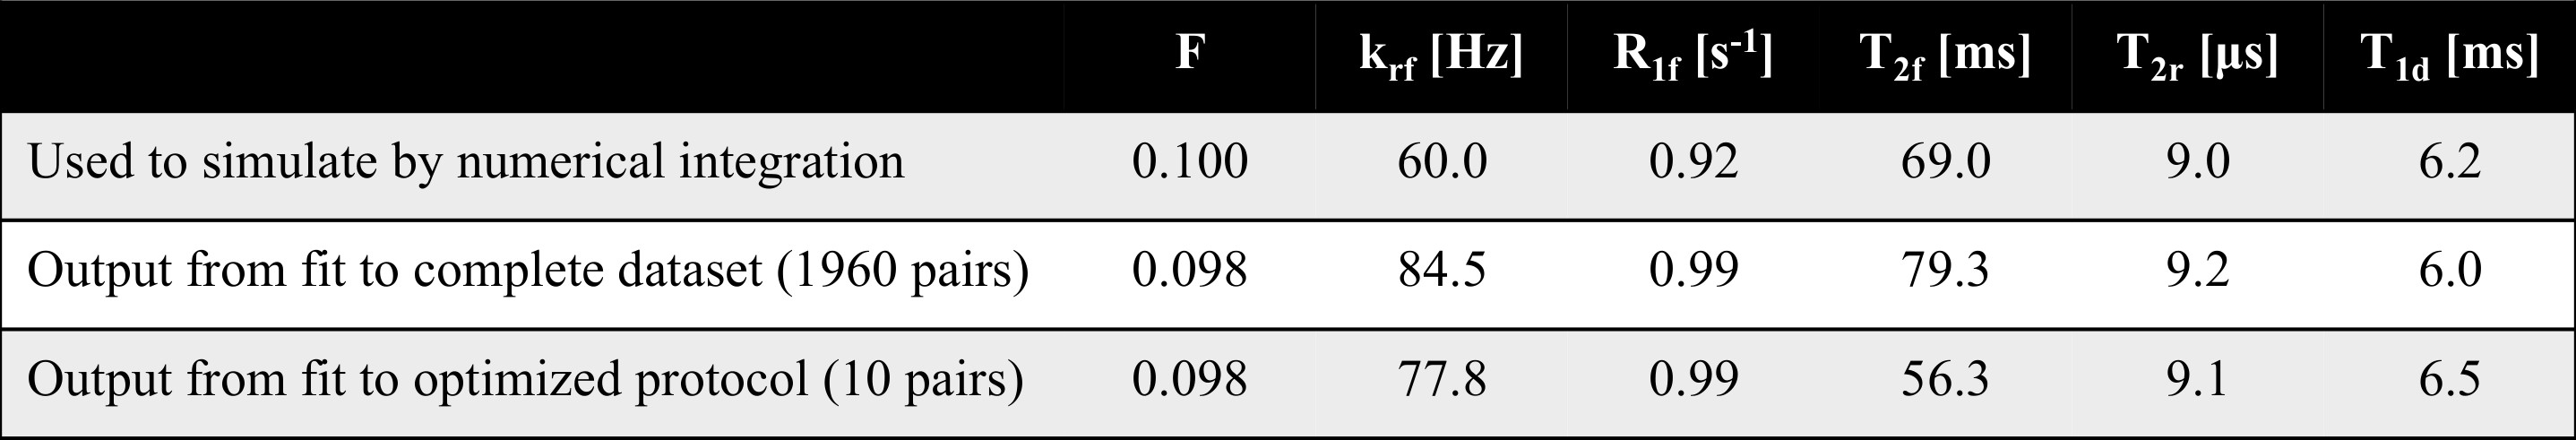
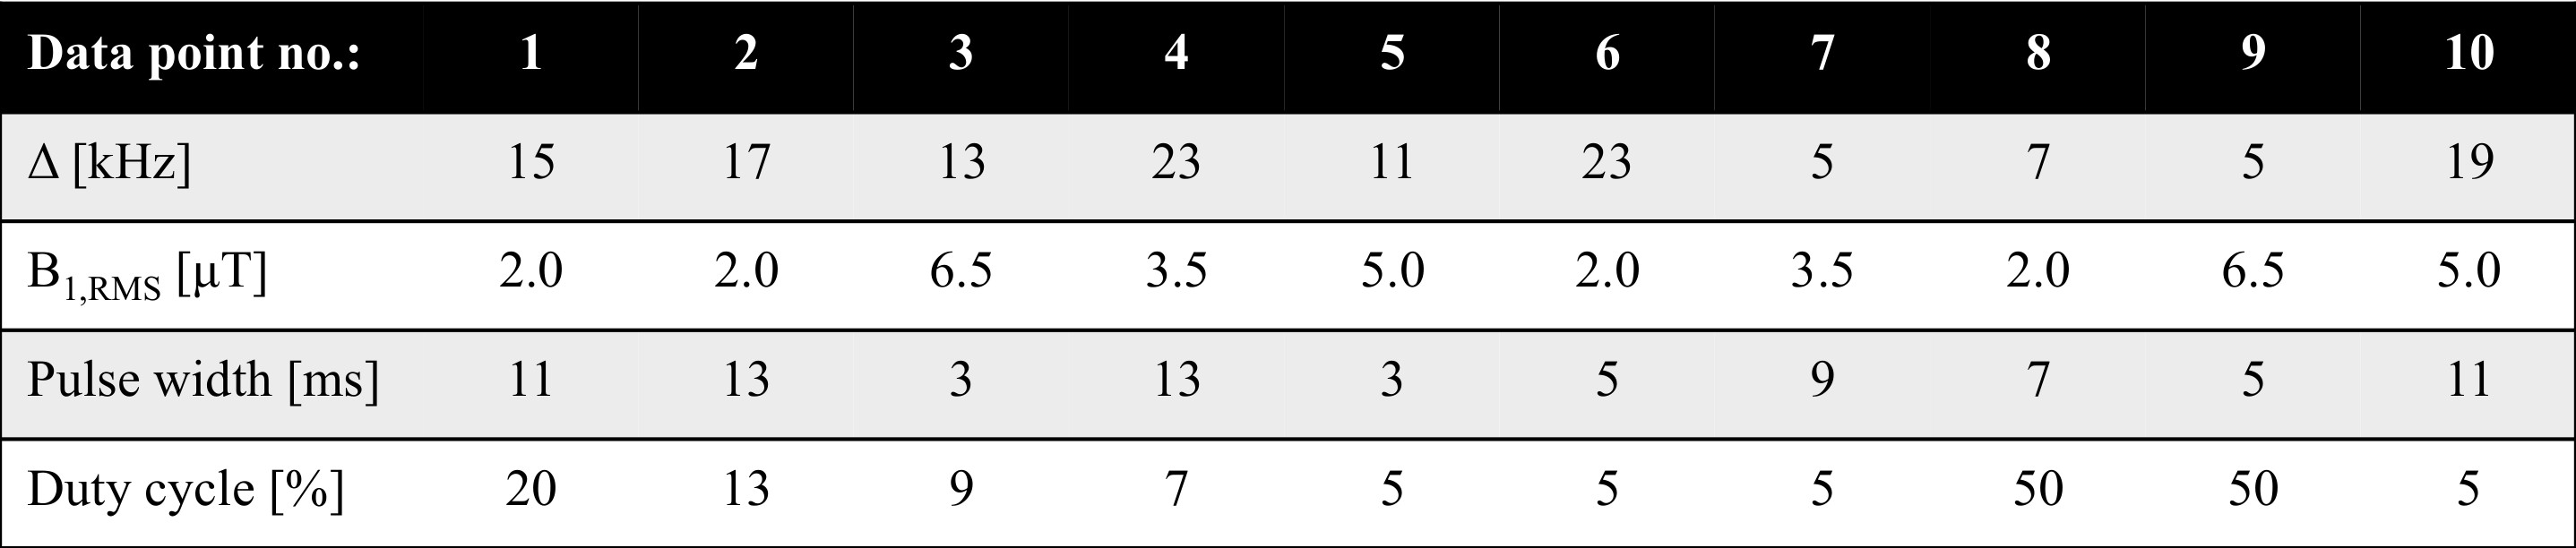
IhMT data within a prepared, MPRAGE style sequence were simulated using numerical integration of the two-pool MT model, with and without the contribution from a dipolar component, and parameters obtained from white matter (WM)6. Specifically a 2s preparation followed by 32 gradient-echo readouts (FA/TR=4°/8.5ms) and recovery period every 4s. Fits to a matrix-based MT model (for faster calculation, and with global optimization) were used to reduce the data to 10 pairs of points (from single and dual frequency RF) based on accuracy of output quantitative ihMT parameters: restricted pool fraction F, longitudinal relaxation rate of free pool R1f, transverse relaxation times of free/restricted pool T2f/T2r, restricted to free pool exchange rate krf, and T1d. Formalin fixed cerebellar tissue from a donor with MS was obtained from the NIH NeuroBioBank for MRI, along with rehydrated, previously paraffin embedded brain tissue with an MS plaque. MRI data were acquired on a 9.4T scanner (Biospec, Bruker) with transmit-receive volume coils and the sample temperature maintained at (36±1)°C, and data processed in Matlab (R2018, Mathworks). IhMT data were collected based on the 3D MPRAGE acquisition simulated (FOV=25.6x25.6x9.6mm3; matrix=64x64x12) and the resultant 10-point protocol for ihMT preparations. Data for diffusion tensor imaging (DTI) were collected with an EPI acquisition (2 segments; 5 A0 images; b-value=670s/mm2; 30 directions; TE/TR=27/3000ms) and processed in Paravision 5.1 to help produce maps of fractional anisotropy (FA) and radial diffusivity (RD). Selective inversion recovery (SIR) data were collected with 23 inversion times ti from 4.7ms to 10s, a fast spin-echo (FSE) readout (FOV=32x32mm2; matrix=128x128; slice=1mm; 16 echoes every 7.4ms), and a delay from the last 180° to next repetition, td = 3.5s7. SIR FSE data were processed using qMRLab 2.3.08,9.Results
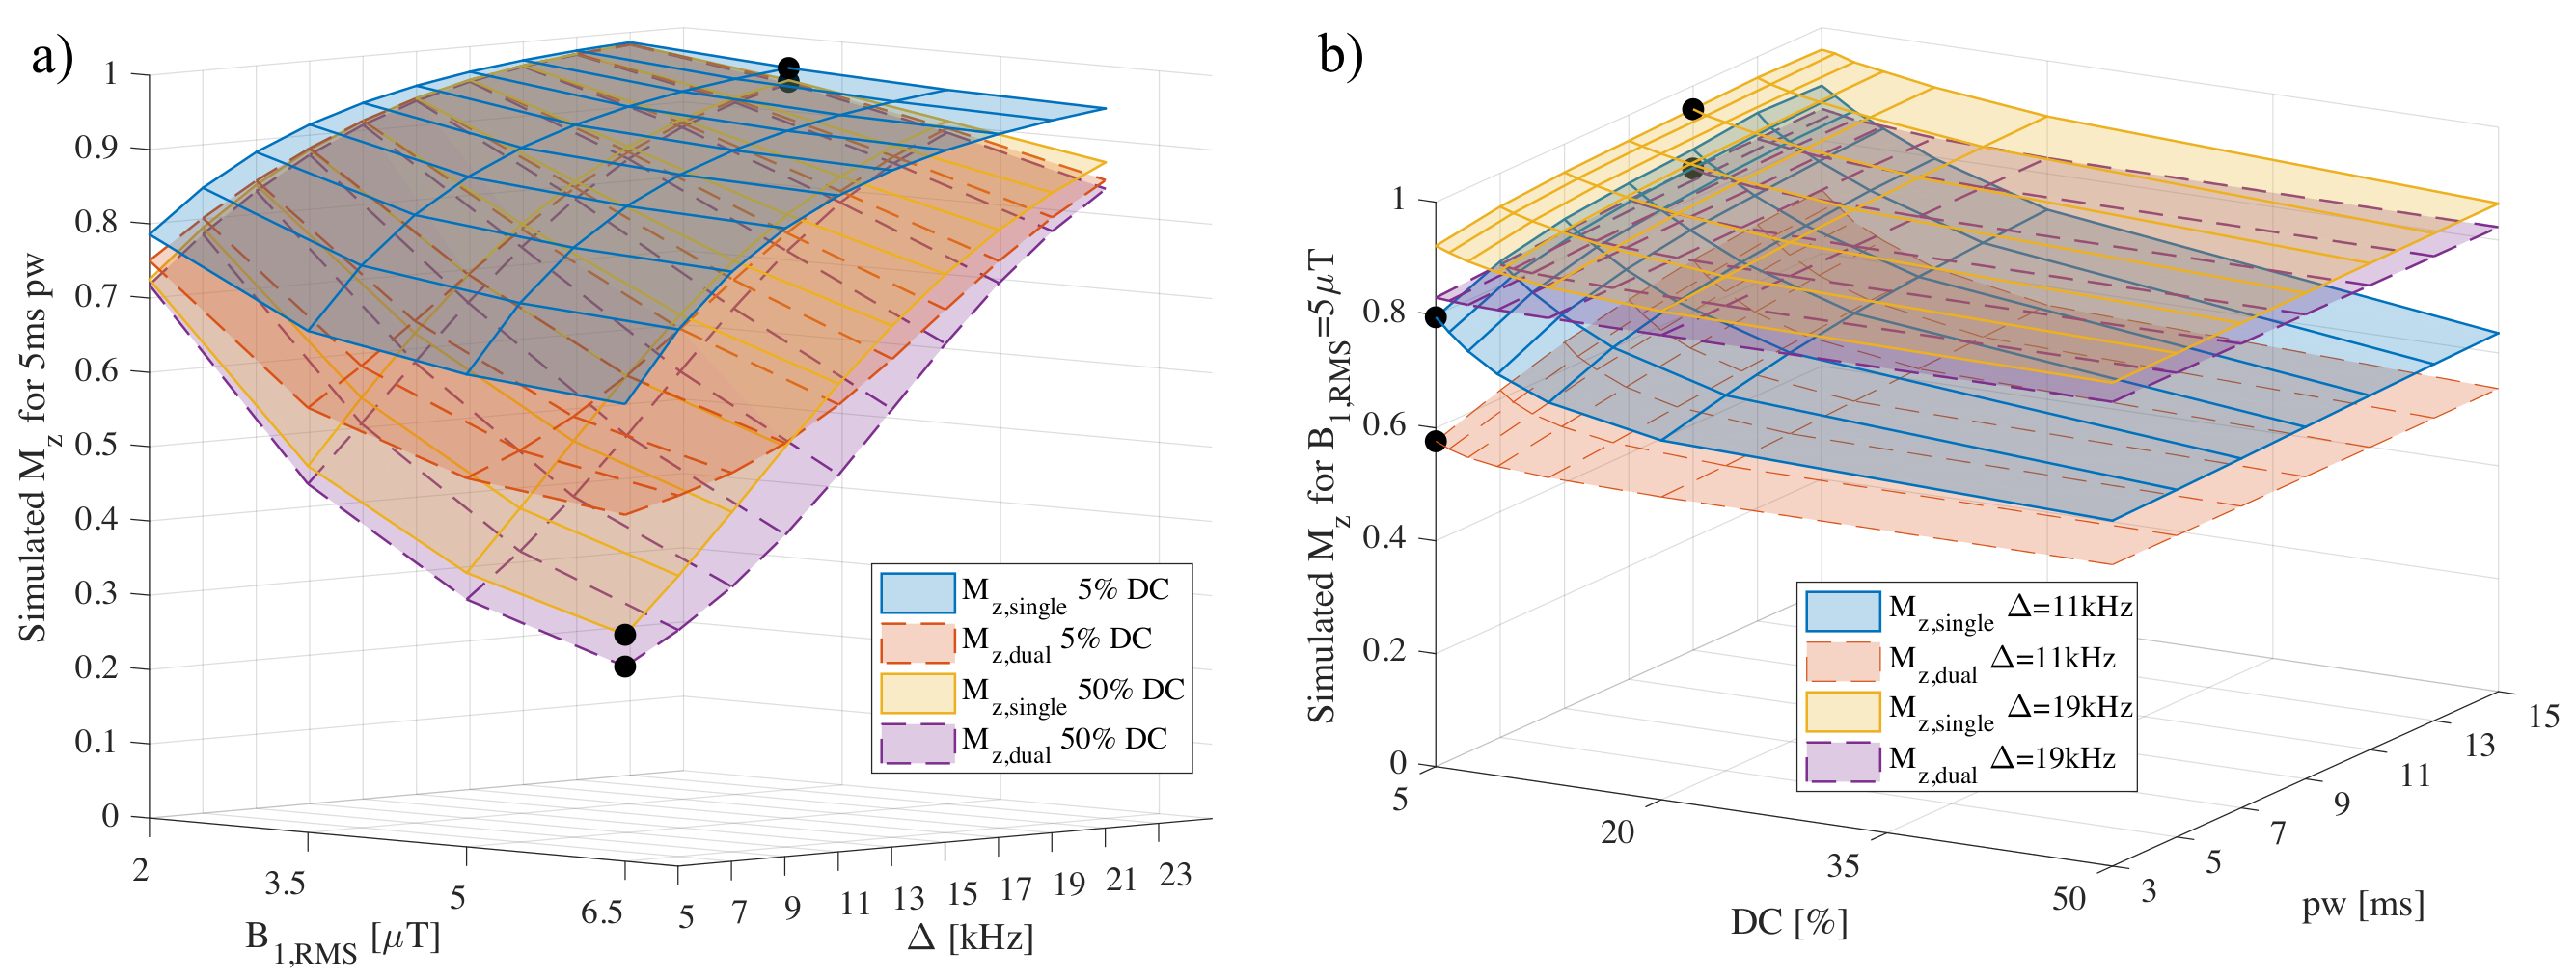
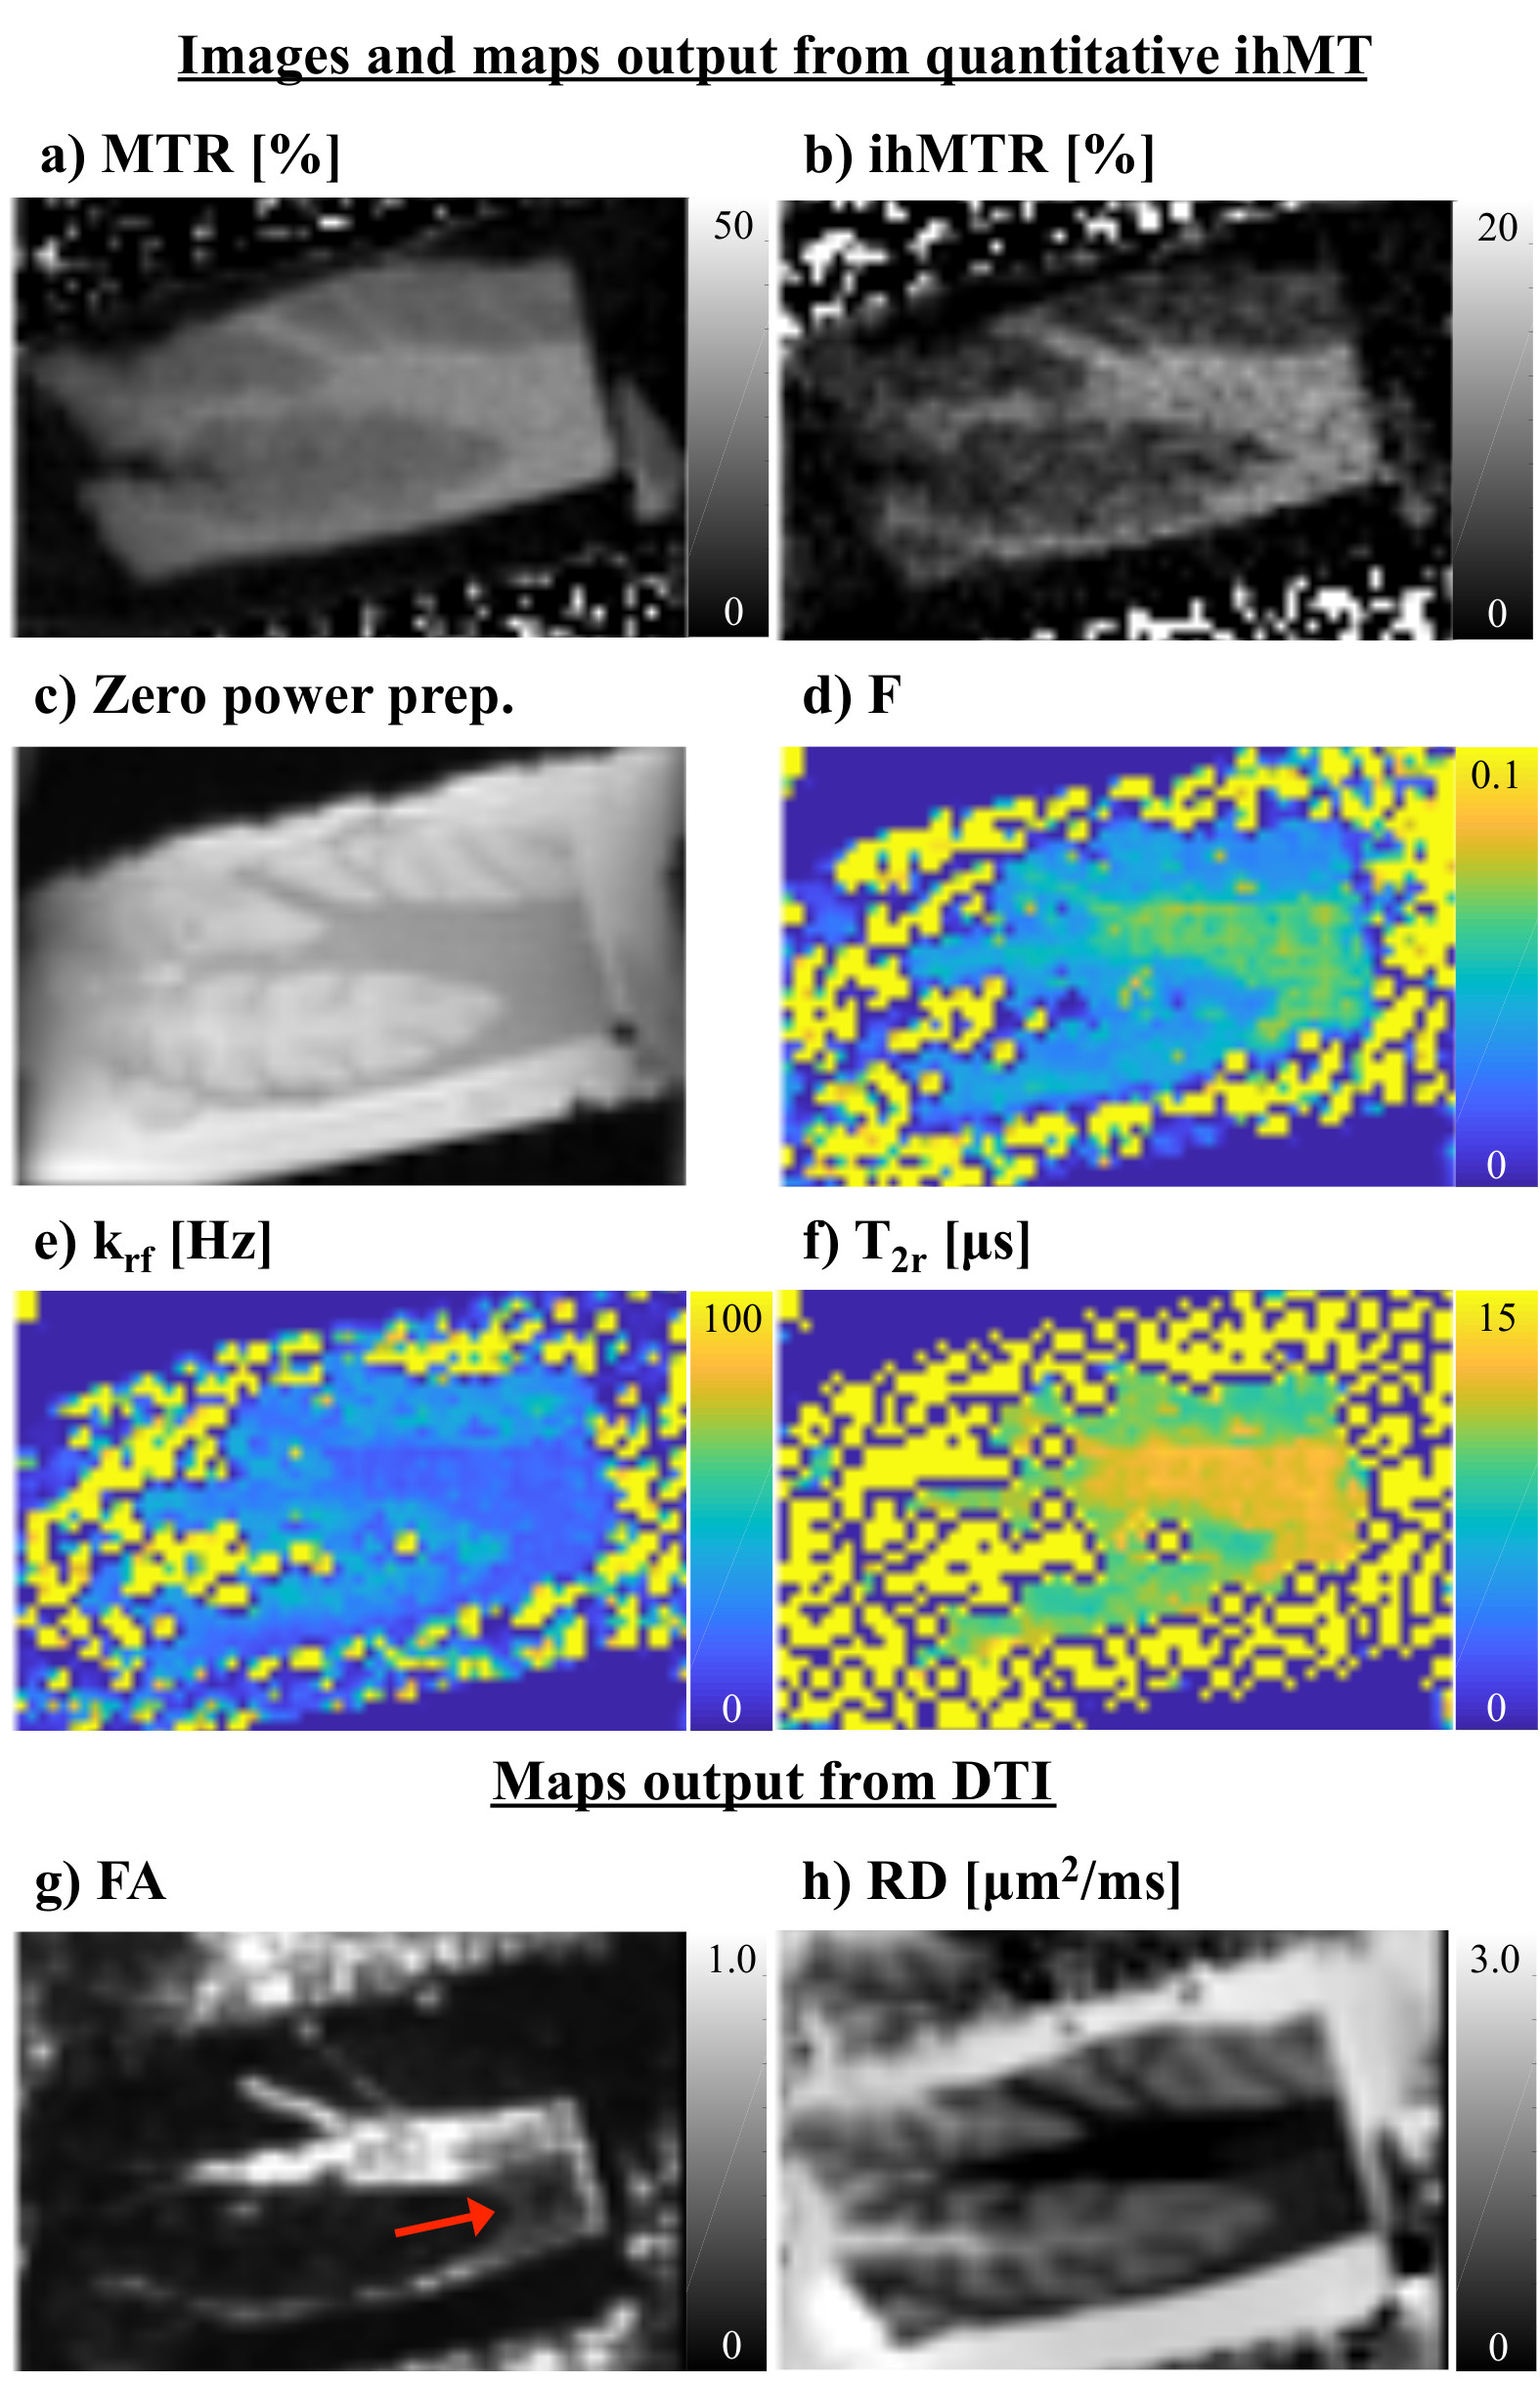
Simulation of the single and dual frequency MT data used in calculation of ihMT showed the expected dependence on Δ, B1,RMS, pulse width (pw), and duty cycle (DC) (Fig. 1). Fits using the matrix-based MT model to the 1960 pairs of single and dual frequency MT simulated data points from numerical integration provided F, R1f, T2r, and T1d outputs close to the solution (Fig. 2). This remained the case following reduction to 10 pairs of points at specific Δ, B1,RMS, pw, and DC combinations establishing an optimized acquisition protocol (Fig. 3). As in-vivo, ihMT ratio (ihMTR) images provided greater contrast between WM and grey matter (GM) than MTR (Figs. 4a-b). Parameter maps output from fits to ihMT MPRAGE data acquired in the cerebellar tissue also provided WM/GM contrast that was more comparable to the RD than FA from DTI (Figs. 4d-h). T1d values were ≤1ms and showed little WM/GM contrast. MTR, ihMTR and the F maps had a region of lower intensity that coincided with the MS plaque (Figs. 5a-d). Maps of F and krf from quantitative ihMT, as well as R1f map from SIR quantitative MT showed signs of WM/GM contrast similar to histology (Figs. 5a,d-g). DTI showed two prominent regions of high fractional anisotropy and low radial diffusivity that corresponded with areas of high F and R1f from SIR quantitative MT (Figs. 5f-i).Discussion
The optimized protocol provided an efficient means for quantitative MT using ihMT data. However, the effect of the optimized protocol on parameters relating to other tissues, e.g. GM and MS lesions requires study. A lack of WM/GM contrast follows results from T1d measurement in-vivo in healthy volunteers10. However, the current ihMT model can be expanded upon to include a long and short T1d components and dual frequency RF experiments by alternating the frequency of successive pulses, which revealed a WM/GM contrast in T1d maps11. We hypothesize similar planned experiments in ex-vivo tissue of age matched controls will provide longer T1d values, but the effect of fixation on T1d may also contribute. Comparison to other quantitative techniques was limited to a qualitative assessment and 2D acquisitions.Conclusion
We developed a framework to reduce the ihMT data required for quantitative MT that, in simulations, provided less than 5% error in output parameters of restricted to free pool fraction, T2r, and T1d. Maps output from quantitative ihMT showed WM/GM contrast in fixed ex-vivo tissue samples from subjects with MS. The restricted to free pool fraction F from quantitative ihMT was reduced in an area corresponding to an MS plaque from histology. Other techniques for MRI of tissue microstructure provided information that can complement the results from quantitative ihMT.Acknowledgements
We gratefully acknowledge the NIH NeuroBioBank as the source of formalin fixed cerebellar brain tissue, and NIH grant support under award number R21NS114546.References
1. Varma G, Duhamel G, De Bazelaire C, et al. Magnetization transfer from inhomogeneously broadened lines: A potential marker for myelin. Magn Reson Med. 2015;73:614–622.
2. Varma G, Girard OM, Prevost VH, et al. Interpretation of magnetization transfer from inhomogeneously broadened lines (ihMT) in tissues as a dipolar order effect within motion restricted molecules. J Magn Reson. 2015;260:67–76.
3. Prevost VH, Girard OM, Mchinda S, et al. Optimization of inhomogeneous magnetization transfer (ihMT) MRI contrast for preclinical studies using dipolar relaxation time (T1D) filtering. NMR Biomed. 2017;30:1–13.
4. Sled JG. Modelling and interpretation of magnetization transfer imaging in the brain. Neuroimage 2017:1–8.
5. Van Obberghen E, Mchinda S, le Troter A, et al. Evaluation of the sensitivity of inhomogeneous magnetization transfer (ihMT) MRI for multiple sclerosis. Am J Neuroradiol. 2018;39:634–641.
6. Varma G, Girard OM, Mchinda S, et al. Low duty-cycle pulsed irradiation reduces magnetization transfer and increases the inhomogeneous magnetization transfer effect. J Magn Reson 2018;296:60–71.
7. Gochberg DF, Gore JC. Quantitative magnetization transfer imaging via selective inversion recovery with short repetition times. Magn Reson Med. 2007;57:437–441.
8. Cabana J-F, Gu Y, Boudreau M, et al. Quantitative magnetization transfer imaging made easy with qMTLab : Software for data simulation, analysis, and visualization. Concepts Mag. Reson Part A 2016;44:263–277.
9. Li K, Zu Z, Xu J, et al. Optimized inversion recovery sequences for quantitative T1 and magnetization transfer imaging. Magn Reson Med. 2010;64:491-500.
10. Varma G, Girard OM, Prevost VH, et al. In vivo measurement of a new source of contrast, the dipolar relaxation time, T1D, using a modified inhomogeneous magnetization transfer (ihMT) sequence. Magn Reson Med. 2017;78:1362–1372.
11. Carvalho V, Girard OM, Hertanu A, et al. Assessment of two T1D components within myelinated tissue with ihMT MRI. Proc. ISMRM 2019;27:4915.
Figures