3134
Enhancing Magnetization Transfer Contrast (MTC): A proof-of-concept study of MTC-STAGE Imaging1Radiology, Ruijin Hospital, Shanghai, China, 2Radiology, Changshu Hospital Affiliated to Nanjing University of Chinese Medicine, Changshu, China, 3Neurology, Wayne State University, Detroit, MI, United States, 4Philips Healthcare, Shanghai, China, 5Radiology, Wayne State University, Detroit, MI, United States, 6Biomedical Engineering, Wayne State University, Detroit, MI, United States
Synopsis
Magnetization transfer contrast (MTC) imaging has been used to study neuromelanin (NM) in Parkinson’s disease. By suppressing the background tissue using an MTC pulse in a T1W sequence, the NM becomes visible, supposedly because of its reduced T1. However, we show using STAGE (strategically acquired gradient echo) imaging with/without an MTC pulse that this is not the reason for its visibility. Rather, it is the increased water content relative to surrounding tissue that keeps the signal high. Using the appropriate choice of flip angles and resolution, the NM contrast on MTC images can be significantly increased.
Introduction:
Parkinson’s disease (PD) is one of the fastest growing neurological disorders1. Diagnosing PD from other movement disorders such as essential tremor is an important part of determining patient treatment2. Recently, there has been a major effort to use neuromelanin (NM) imaging as a biomarker for diagnosing PD. It is well known that there is a loss of NM in patients with PD and that upon presentation with symptoms the patients have already lost 50% to 60% of their NM3. Magnetization transfer contrast (MTC) imaging has been used to image NM for more than a decade now by suppressing the background tissue in T1W sequences. The presence of macromolecules in the white matter and to a lesser degree in gray matter causes both their signals to be significantly decreased leaving tissue with more water having the highest signal. Most papers published to date suggest that the NM becomes visible because of its reduced T1. However, we show using strategically acquired gradient echo (STAGE)4-6 imaging that this is not the major reason for its visibility. Rather, it is the increased water content relative to the surrounding tissue that keeps the signal high for the NM in the substantia nigra (SN). Using the known tissue properties makes it possible to use a spin density weighted MTC acquisition to further enhance the NM contrast. Therefore, we propose using a MTC-STAGE susceptibility weighted imaging (SWI) like data acquisition with both proton spin density weighting (PSDW) and T1 weighting (T1W) to optimize the NM contrast. The purpose of this study was to quantify the tissue properties of the midbrain and NM using a two flip angle STAGE approach in an MTC-SWI sequence to measure the tissue properties both with and without the MTC radiofrequency pulse. Finally, we also create a new image using the product of these two sequences (pMTC) to enhance NM visibility.Methods:
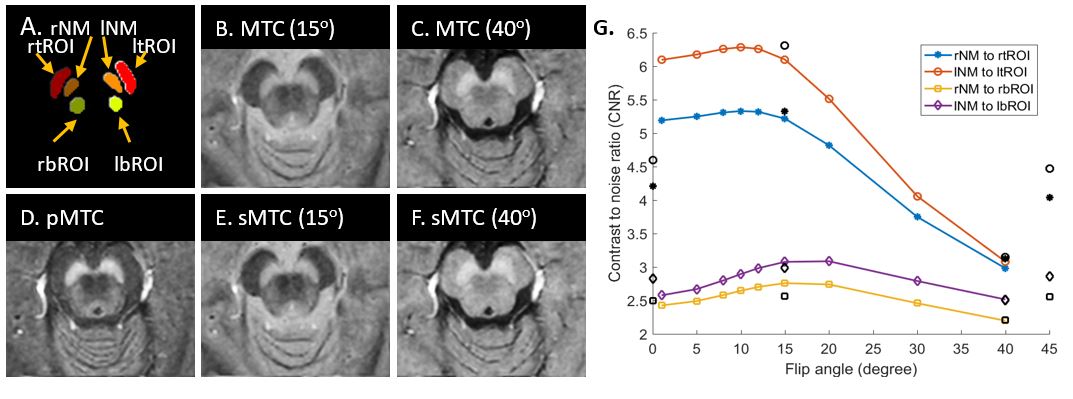
A total of 4 healthy controls (ages 30, 20, 20, 23 years old) were scanned on a 3T Philips scanner using a 3D multi-echo gradient echo SWI sequence with magnetization transfer contrast (MTC). The imaging parameters included: seven echoes with TE1 = 7.5ms, ΔTE = 7.5ms, with TR = 62ms, pixel bandwidth = 174Hz/pixel, matrix size = 384 × 384, slice thickness = 2mm, and a spatial in-plane resolution = 0.67 × 0.67mm2. The first volunteer (30 years old) was scanned with flip angles (FA) of 15 ˚ and 40˚ and STAGE processing was performed on this data to predict the results from a range of FAs. In the last 3 volunteers, a series of flip angles was run ranging from 5°, 8°, 10°, 12°, 15°, 20° and 30°. The first echo in the MTC-SWI magnitude image (TE = 7.5ms) was used to delineate the NM content in the midbrain. The MTC pulse parameters were: FA=90°, offset zero, and 3 block pulses of 1.914 ms. Contrast measurements were made in three regions: in the NM visible area itself, above the SN in the cerebral peduncle and below the SN in the adjacent gray matter.Results:
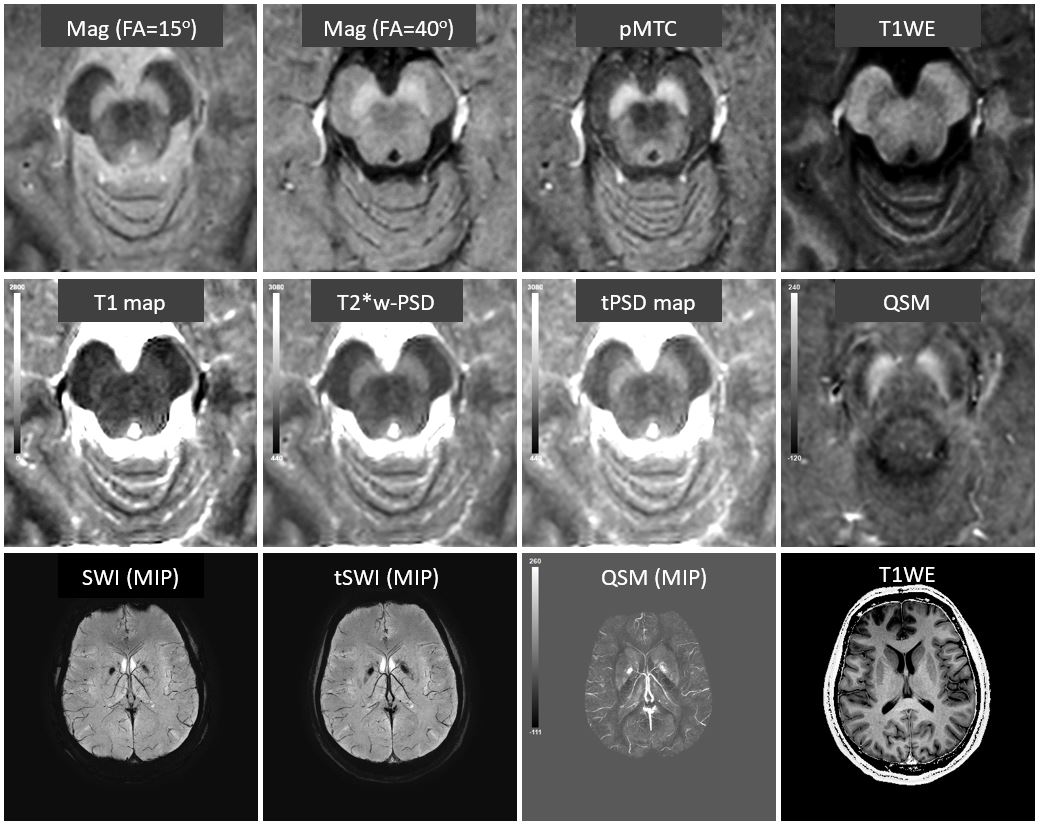
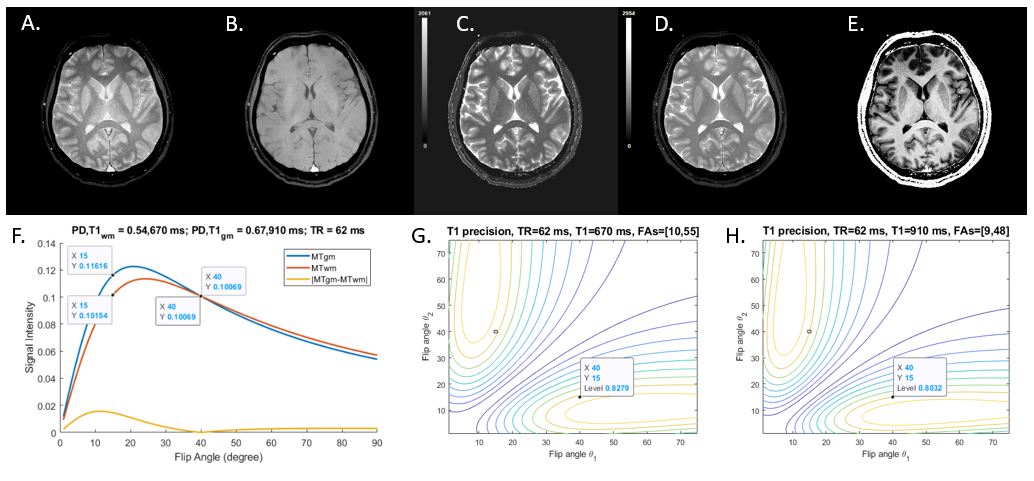
Figure 1 shows the original MTC results with 15° and 40° FAs, and STAGE processing results including: true-PSD (or tPSD) map, and QSM. The T1 map and PSD maps demonstrated that the MT contrast mainly occurs because of the high proton spin density in the NM. Overall contrast for the NM is higher in the 15° flip angle image but the cerebrospinal fluid appears very bright. The 15° FA image shows the cerebral peduncle darker than the 40° FA image. This gives the appearance of better contrast in the anterior part of the NM territory while the posterior part has better contrast for the 40° FA image. The product of these two images (pMTC in Figure 1), gives a compromise exhibiting good contrast in both regions. The Ernst equation plot for the signal intensity as a function of flip angle nicely matches the data’s contrast (Figure 2). Moreover, the maximum MT contrast is reached at 12°, but 15° which agrees well with the data (Figures 3 and 4). Using 15° and 40° for MTC-STAGE. gives more than 80% of the maximum T1 precision (usually reached at [10°, 55°] and [9°, 48°], for WM and GM).Discussion and Conclusion:
In this work, we have introduced a new approach to enhance NM contrast using a two flip angle MTC-STAGE protocol to understand the tissue properties. We have shown that both 15° and 20° can provide good contrast in the upper and lower region of the NM. A combination of both a low and high flip image can be used to enhance NM contrast in the product image pMTC. The lower T1 is actually detrimental to the contrast at higher flip angles because contrast there diminishes due to the higher signal of high water content longer T1 components in the NM. Therefore, the main reason for the enhanced NM contrast comes from the increased water content in the NM and low FAs provide the best contrast. This has potential applications for all studies related to using NM as a biomarker to better diagnose Parkinson’s patients.Acknowledgements
No acknowledgement found.References
1. Group GBDNDC. Global, regional, and national burden of neurological disorders during 1990-2015: a systematic analysis for the Global Burden of Disease Study 2015. Lancet Neurol 2017; 16(11): 877-97.
2. Damier P et al. The substantia nigra of the human brain. II. Patterns of loss of dopamine-containing neurons in Parkinson's disease. Brain 1999; 122 ( Pt 8): 1437-48.
3. Zheng ZH et al. Imaging the Nigrosome 1 in the substantia nigra using SWI and QSM: An application to Parkinson’s disease. Neuroimage Clinical: in press.
4. Chen Y, Liu S, Wang Y, Kang Y, Haacke EM. STrategically Acquired Gradient Echo (STAGE) imaging, part I: Creating enhanced T1 contrast and standardized susceptibility weighted imaging and quantitative susceptibility mapping. Magnetic resonance imaging 2018;46:130-139.
5. Wang Y, Chen Y, Wu D, et al. STrategically Acquired Gradient Echo (STAGE) imaging, part II: Correcting for RF inhomogeneities in estimating T1 and proton density. Magnetic resonance imaging 2018;46:140-150.
6. Haacke EM, Chen Y, Utrainen D, et al. STrategically Acquired Gradient Echo (STAGE) Imaging, part III: Technical Advances and Clinical Applications of A Rapid Multi-Contrast Multi-Parametric Brain Imaging Method. Magnetic Resoannce Imaging 2019;DOI:10.1016/j.mri.2019.09.006.
Figures