3133
One Minute Whole-Brain Magnetization Transfer Ratio Imaging with Intrinsic B1-Correction1Division of Radiological Physics,Department of Radiology, University Hospital Basel, University of Basel, Basel, Switzerland, 2Department of Biomedical Engineering, University of Basel, Basel, Switzerland, 3High Field Magnetic Resonance, Max Planck Institute for Biological Cybernetics, Tübingen, Germany, 4Department of Biomedical Engineering, University of Virginia, Charlottesville, VA, United States, 5Siemens Healthcare, Application Development, Erlangen, Germany
Synopsis
Magnetization transfer (MT), reflecting the exchange of magnetization between mobile and bound protons, has shown good potential for the diagnosis and prognosis of various neurological disorders, such as multiple sclerosis. Frequently, MT effects are assessed by measuring the contrast between two scans performed with and without saturation of the bound pool protons. Evidently, saturation is affected by B1 inhomogeneity and should be accounted for. In this work, we report on a very rapid one-minute whole-brain magnetization transfer ratio (MTR) imaging method offering intrinsic B1-correction.
Introduction
Magnetization transfer (MT) has wide applications in diagnosis and prognosis of various diseases, such as multiple sclerosis [1]. As a simple measure, magnetization transfer ratio (MTR) has been used to assess abnormalities in brain structures but is biased by B1 inhomogeneity [2]. In this work, we explore the potential of a rapid whole-brain MTR approach with intrinsic B1-correction.Methods
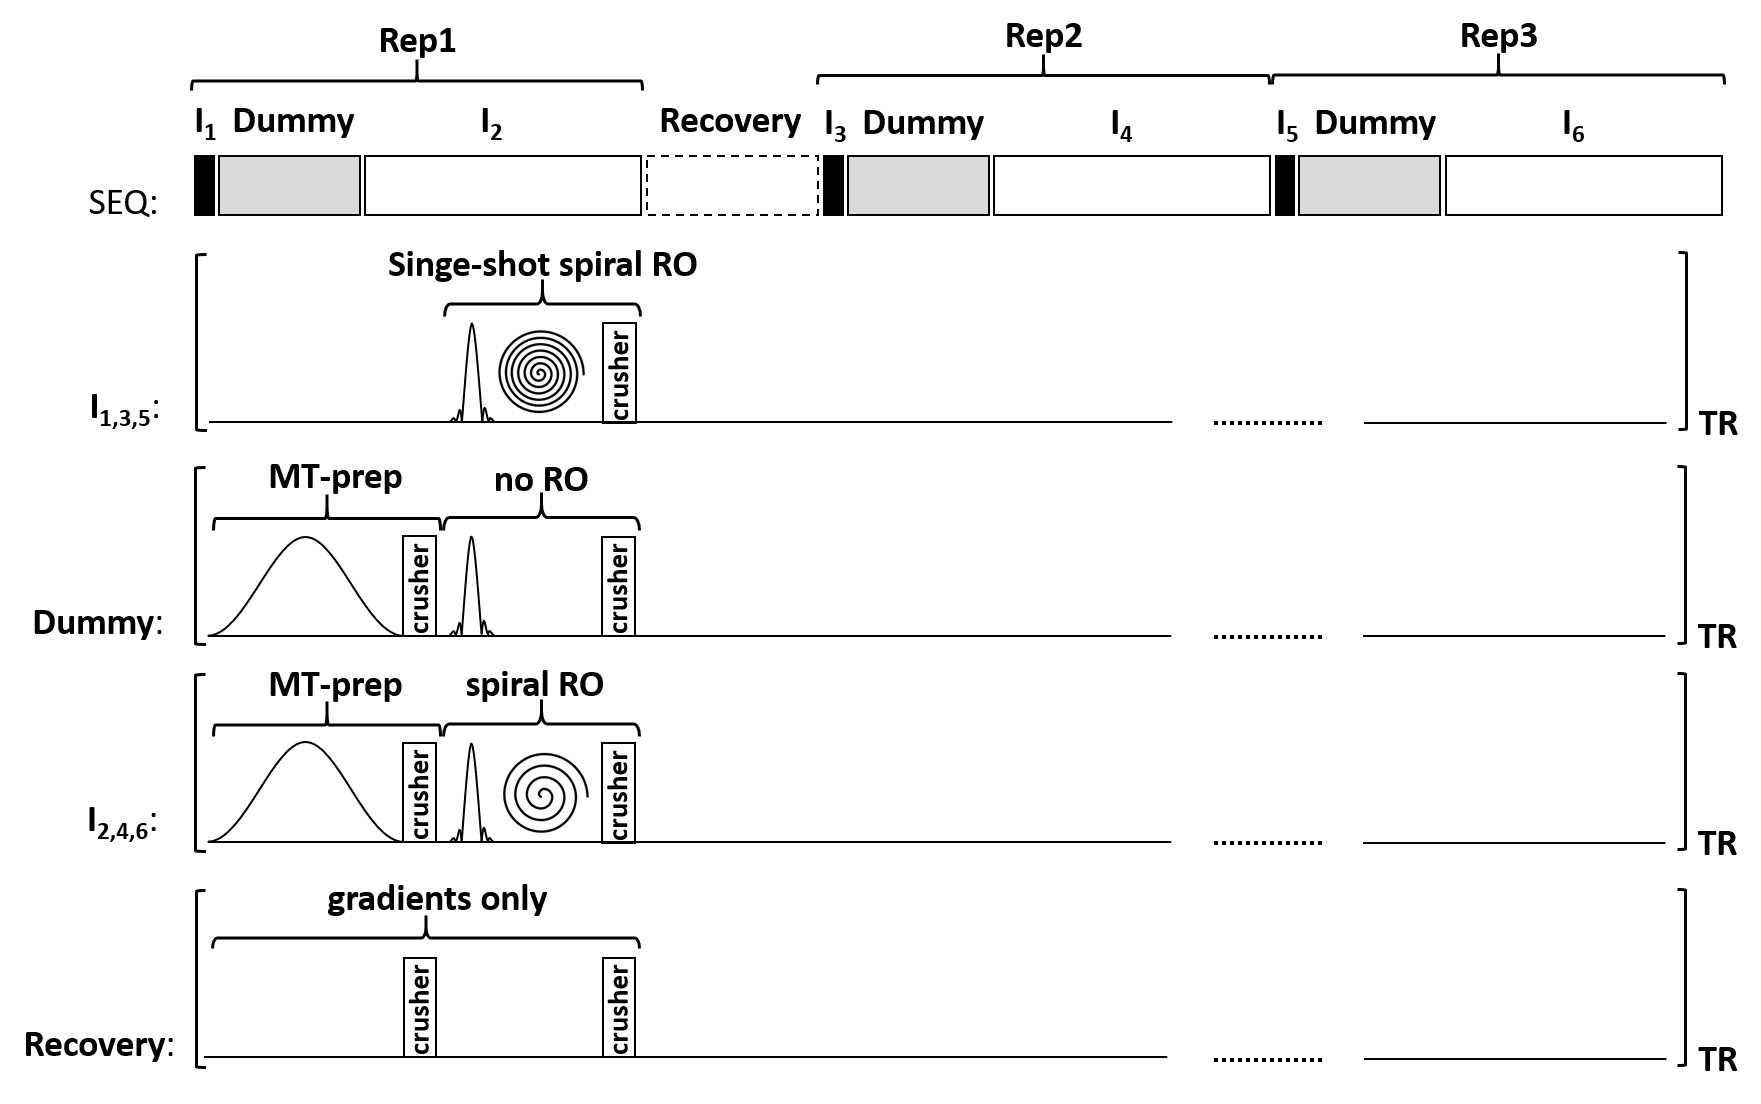
For rapid whole-brain MTR imaging, a multi-slice spoiled gradient echo (SPGR) sequence with spiral readout is proposed (see Figure 1), offering a long TR of 650 ms to obtain proton density (PD) weighted images and to provide a high accumulated diffusion-related spoiling, as proposed recently for accurate T1 mapping [3]. Every TR starts with an optional MT-preparation block (8.75 ms duration, 7.68 ms Gaussian off-resonance RF pulse at 2.2 kHz), followed by an image encoding module (35° sinc-shaped RF pulse, 7.88 ms spiral readout) and terminated by an empty block that offers space for the acquisition of a maximum of 25 interleaved slices.For MTR imaging, three repetitions are performed (see Figure 1). Each repetition starts with a low-resolution single-shot spiral image (without MT-preparation) followed by a dummy period (without readout) of 2 seconds to provide steady state conditions for the subsequent image encoding using 20 spiral interleaves. In the first repetition, no MT-saturation pulses are played out and the first single-shot spiral image (I1) is acquired with a nominal flip angle of 90° followed by the acquisition of a non-MT-weighted image (I2). In the second repetition, a recovery period of 4 seconds is used before the acquisition of a second single-shot spiral image (I3) with nominal flip angle of 45° and a first MT-weighted image (I4) using an MT-saturation pulse of 350°. In the third repetition, after a third single-shot image (I5, currently not used) a second MT-weighted image (I6) is acquired using an MT-saturation pulse of 550°. The overall acquisition took 59 seconds with two concatenations yielding a total of 50 slices with 3 mm slice thickness and 1.3 x 1.3 mm2 in plane resolution.
For the assessment of MTR changes as a function of the MT-saturation flip angle, single repetitions (about 20 seconds scan time) were used with variable MT-saturation pulses of 0°, 350°, 400°, 450°, 500°, 550°.
Spiral image reconstruction was performed online using the iterative self-consistent parallel imaging reconstruction method (SPIRiT)[4] with an acceleration factor R = 2. Image post-processing was performed using MATLAB R2019a (The MathWorks, Inc., Natick, MA).
Generally, MTR values are given in percent units (pu) and calculated as MTR:=100× (Inon-sat – Isat)/ Inon-sat, where Inon-sat is the non-saturated and Isat is the saturated image. A B1 scaling factor is derived from the low-resolution contrast images (I1 & I3) as described in [5]. From the in-vivo data, B1-uncorrected average MTR images are derived using Isat = (I4+I6)/2.
Subsequently, B1-corrected MTRc values are derived depending on the functional relationship f(I4,I6,B1) of the MT contrast to the MT-saturation pulse, IB1sat = f (I4, I6, B1).
To test the repeatability and reproducibility, the MTR protocol was repeated 10 times without and 10 times with taking the volunteer out after each single acquisition (repositioning). Brain extraction and registration was performed on a T1-weighted scan (MPRAGE [6]) using FSL (FMRIB Software Library v6.0, Oxford, UK). Four volunteers were scanned at 3T using a 20-channel head coil.
Results
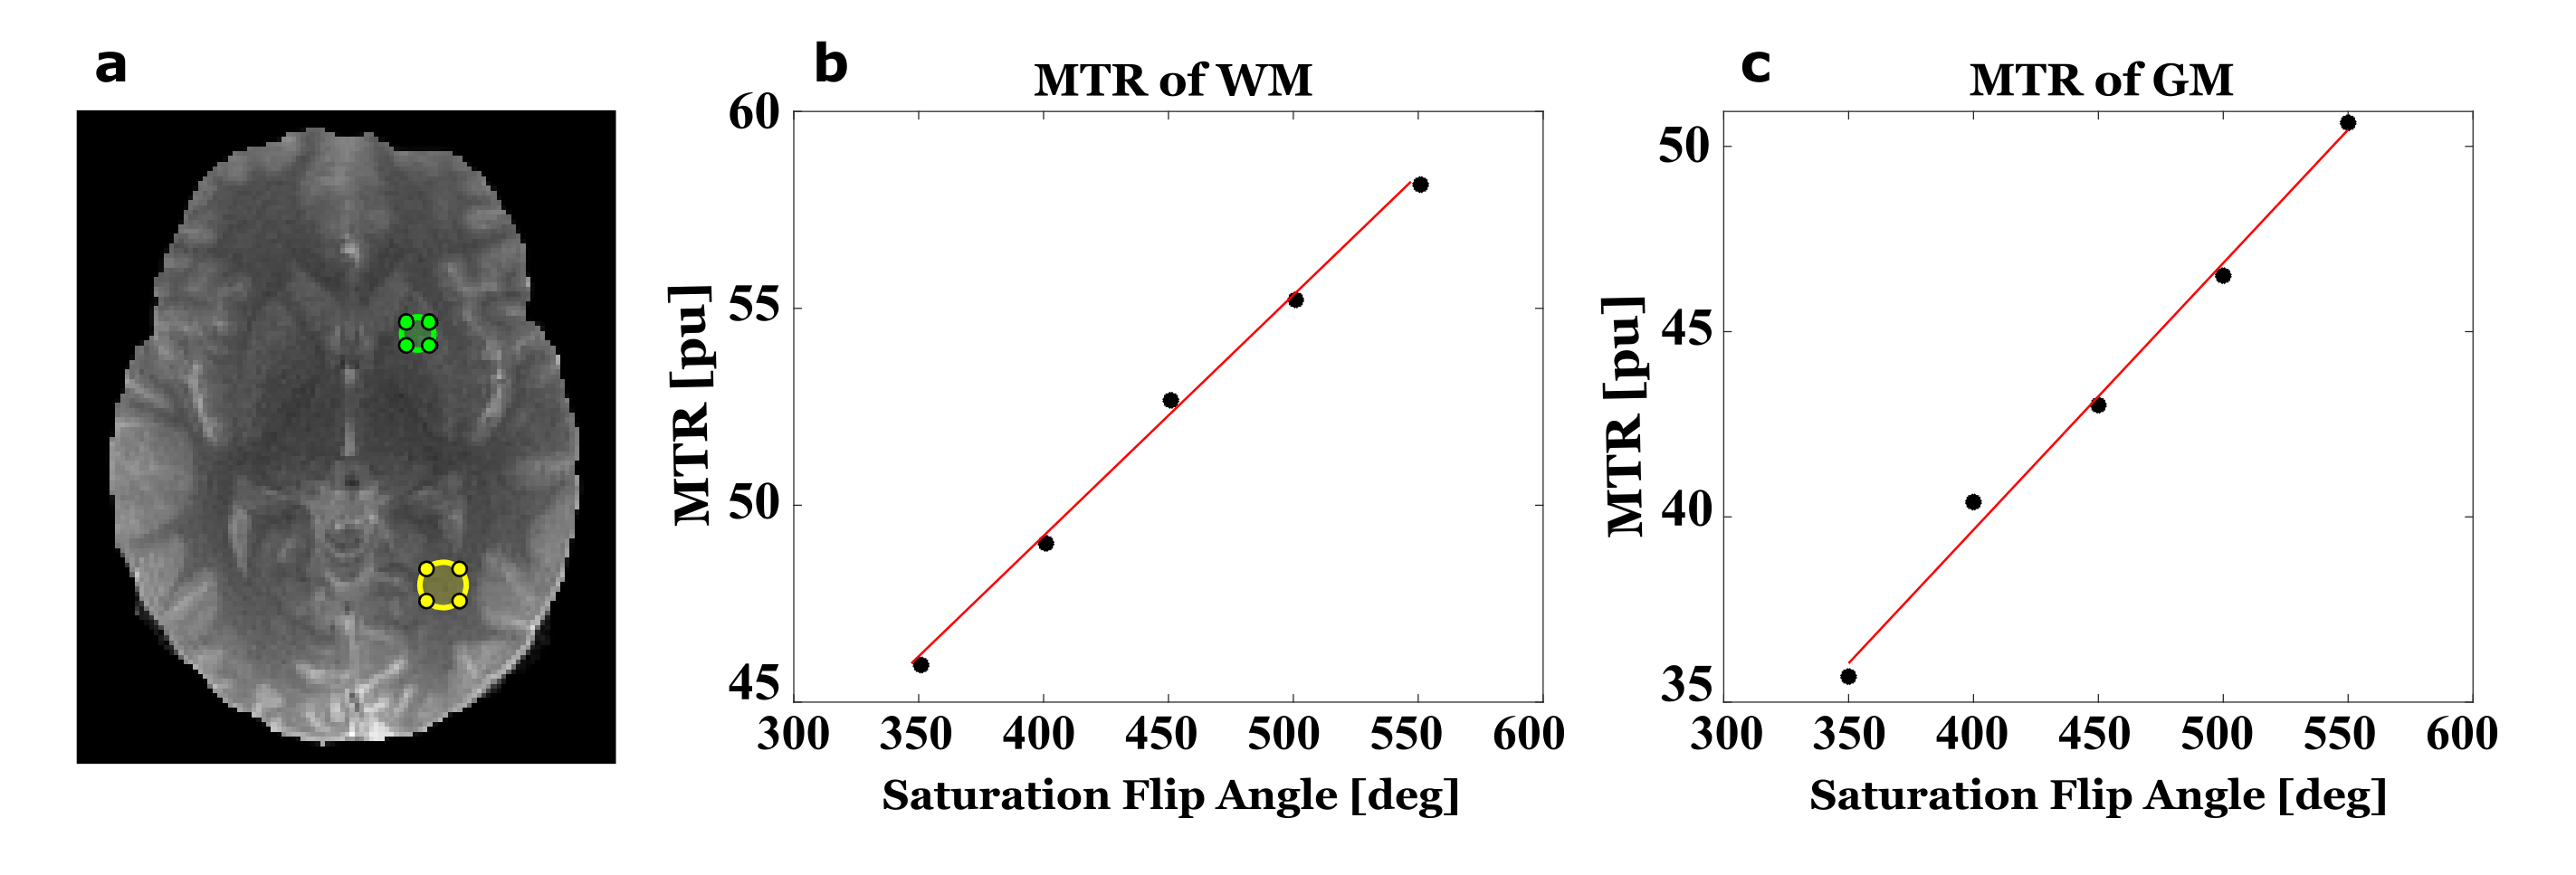
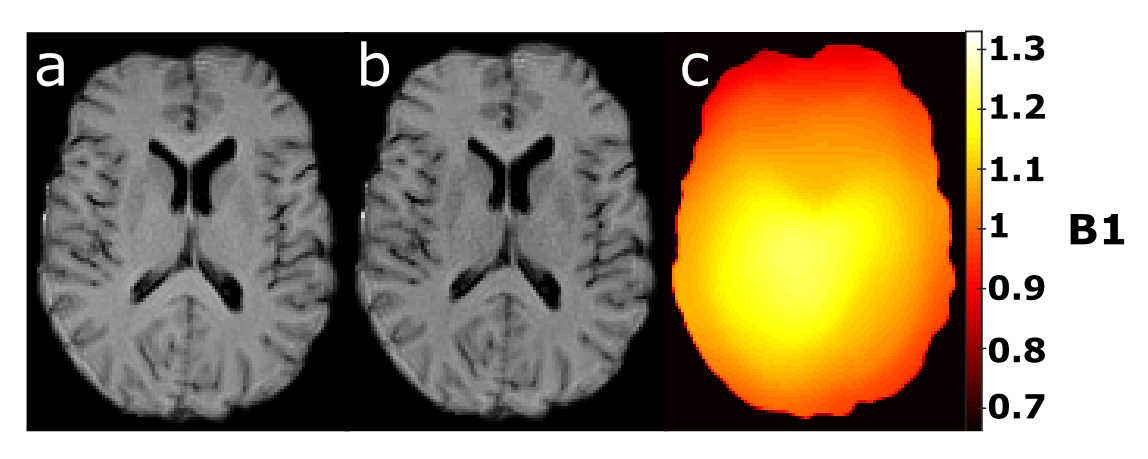
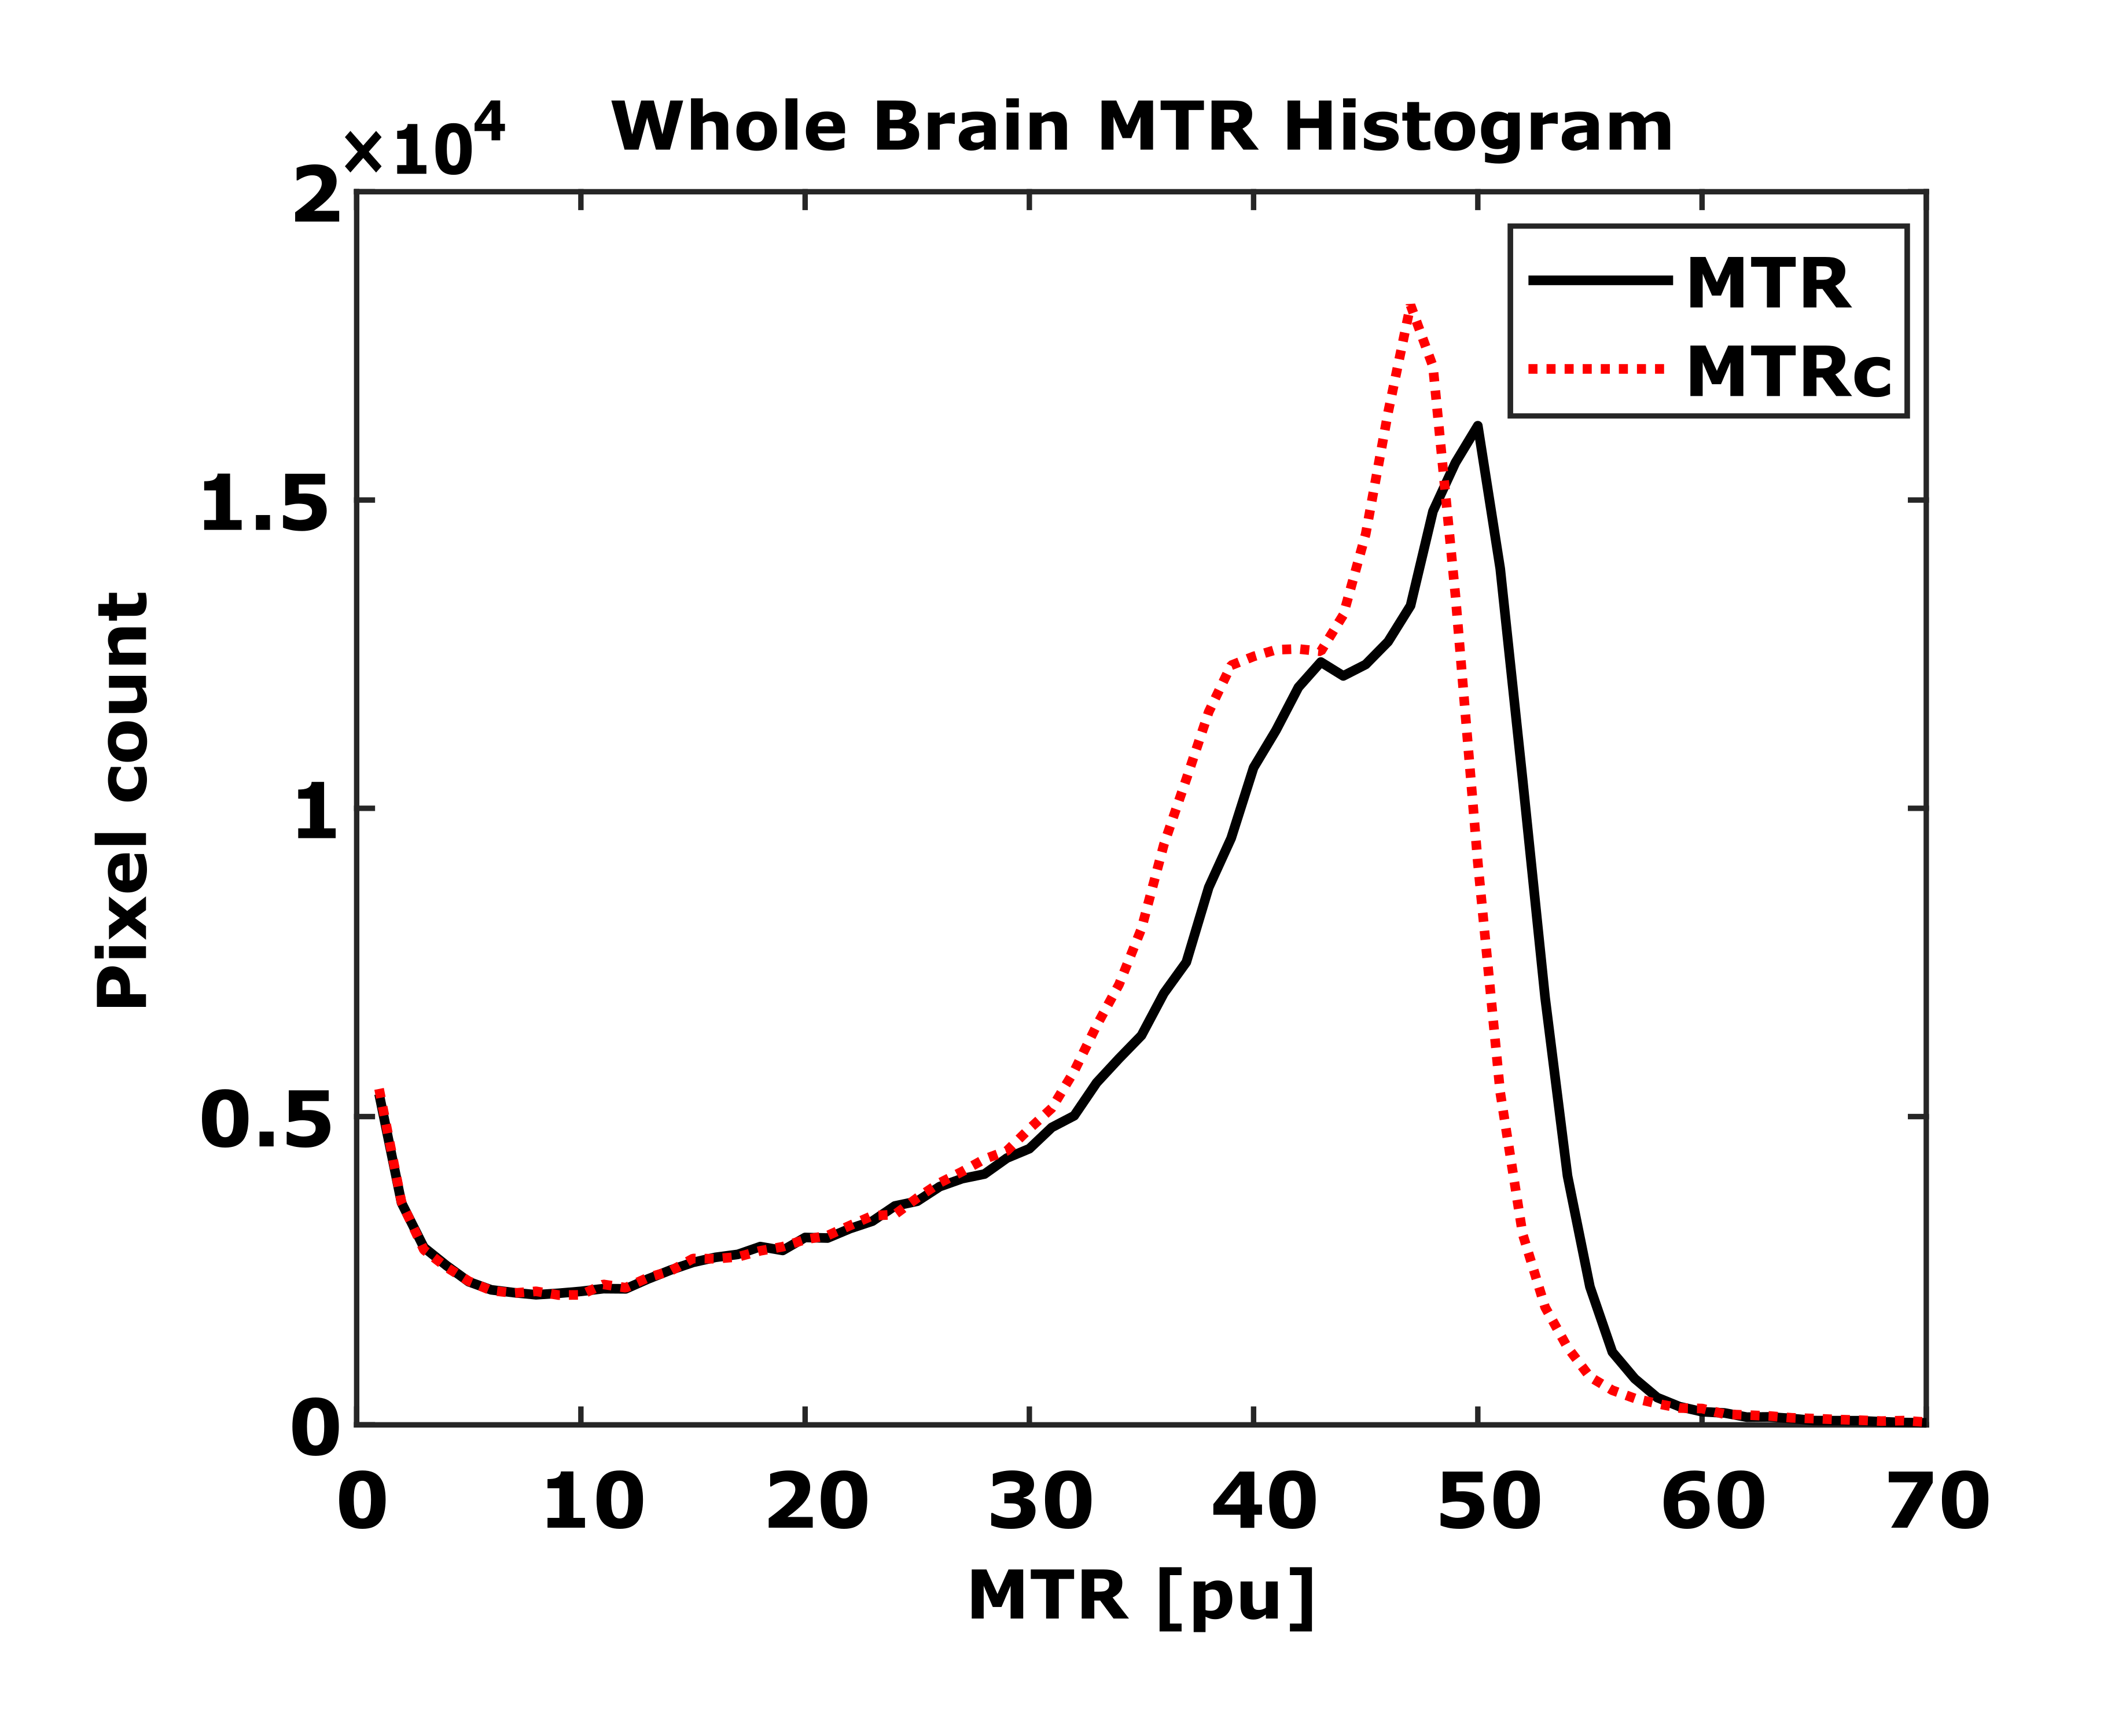
MTR changes with MT-saturation flip angle are shown for a region-of-interest (ROI) in the gray matter (GM) and the white matter (WM) in Figure 2. To a good approximation, a linear relationship can be assumed between 350° and 550°. For an average MT-saturation pulse of 450°, the WM-MTR of 52.6 pu in the ROI changes by about ±5.0 pu (corresponding to a B1 change of ±0.2). For GM, the average MTR of 43.5 pu changes by about ±6.5 pu.Exemplary axial B1-uncorrected and B1-corrected MTR images are shown in Figure 3 together with the corresponding B1 map. Overall, B1-correction leads to a narrower MTR distribution and GM and WM peak-accentuations, as apparent from the whole brain MTR histograms in Figure 4.
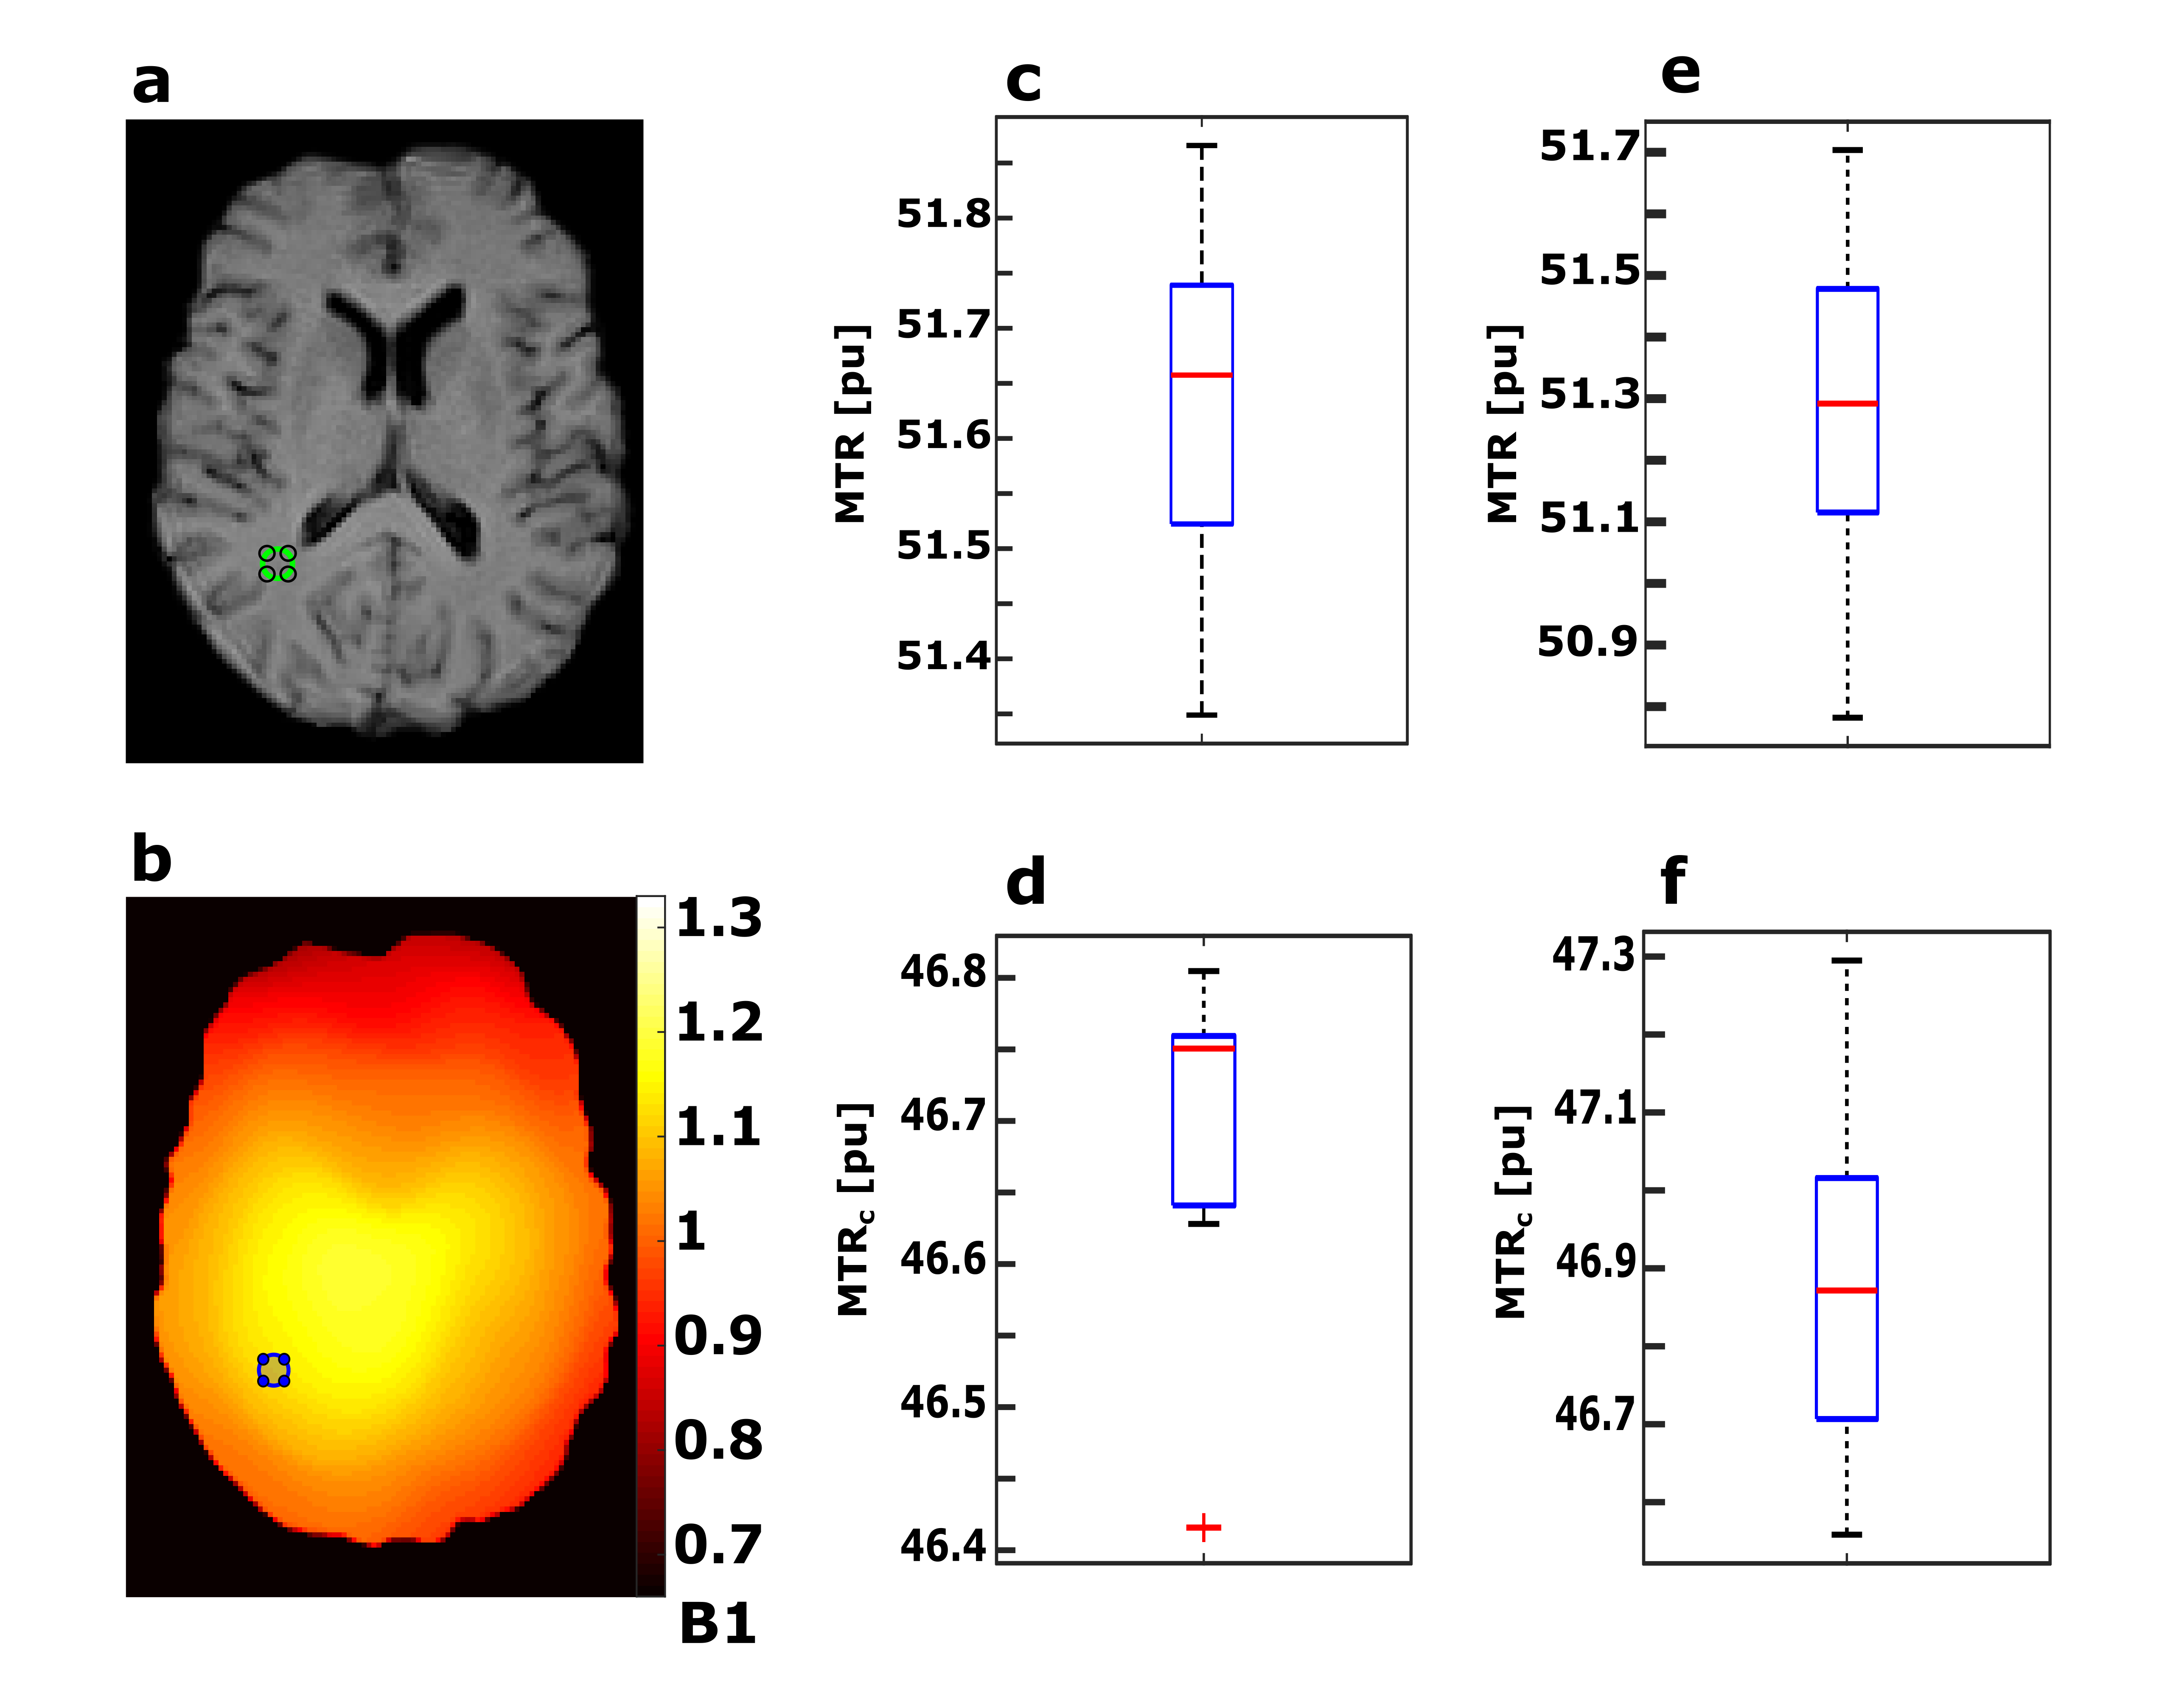
Inter-scan variability is exemplarily calculated for a small WM ROI (28 pixels) and shown in Figure 5. Without repositioning, scan-rescan resulted in an average MTR of 51.6 ± 0.1 pu and 46.7 ± 0.1 pu without and with B1 correction, respectively. With repositioning, scan-rescan resulted in an average MTR of 51.3 ± 0.3 pu and 46.9 ± 0.2 pu without and with B1 correction, respectively. Overall, MTR values were highly reproducible.
Discussion & Conclusion
A very rapid MTR method was introduced, providing whole brain coverage with clinical resolution within one minute for an average time of about 1 second per B1-corrected MTR slice with high reproducibility. The new method offers excellent prospects for translation and application in the clinics.Acknowledgements
This work was supported by the Swiss National Science Foundation (SNF grant No. 325230_182008)References
[1] Paul Tofts, Quantitative MRI of the Brain: Measuring Changes Caused by Disease. 2004.
[2] S. Ropele et al., ‘Assessment and correction of B1-induced errors in magnetization transfer ratio measurements’, Magn. Reson. Med., vol. 53, no. 1, pp. 134–140, 2005.
[3] R. Heule and O. Bieri, ‘Rapid and robust variable flip angle T1 mapping using interleaved two-dimensional multislice spoiled gradient echo imaging’, Magn. Reson. Med., vol. 77, no. 4, pp. 1606–1611, 2017.
[4] M. Lustig and J. M. Pauly, ‘SPIRiT: Iterative self-consistent parallel imaging reconstruction from arbitrary k-space’, Magn. Reson. Med., vol. 64, no. 2, pp. 457–471, 2010.
[5] R. Heule, J. Pfeuffer, C. H. Meyer, and O. Bieri, ‘Simultaneous B1 and T1 mapping using spiral multislice variable flip angle acquisitions for whole-brain coverage in less than one minute’, Magn. Reson. Med., vol. 81, no. 3, pp. 1876–1889, 2019.
[6] J. P. Mugler III and J. R. Brookeman, ‘Rapid three‐dimensional T1‐weighted MR imaging with the MP‐RAGE sequence’, J. Magn. Reson. Imaging, vol. 1, no. 5, pp. 561–567, 1991.
Figures