3131
The cellular heat shock response monitored by chemical exchange saturation transfer MRI
Dennis Kleimaier1, Steffen Goerke2, Cordula Nies3, Moritz Zaiss4, Patrick Kunz5, Eric Gottwald3, and Lothar R. Schad1
1Computer Assisted Clinical Medicine, Heidelberg University, Mannheim, Germany, 2Division of Medical Physics in Radiology, German Cancer Research Center (DKFZ), Heidelberg, Germany, 3Institute of Functional Interfaces, Karlsruhe Institut of Technology, Karlsruhe, Germany, 4Neuroradiology, University of Erlangen-Nürnberg, Erlangen, Germany, 5Division of Functional Genome Analysis, German Cancer Research Center (DKFZ), Heidelberg, Germany
1Computer Assisted Clinical Medicine, Heidelberg University, Mannheim, Germany, 2Division of Medical Physics in Radiology, German Cancer Research Center (DKFZ), Heidelberg, Germany, 3Institute of Functional Interfaces, Karlsruhe Institut of Technology, Karlsruhe, Germany, 4Neuroradiology, University of Erlangen-Nürnberg, Erlangen, Germany, 5Division of Functional Genome Analysis, German Cancer Research Center (DKFZ), Heidelberg, Germany
Synopsis
Chemical exchange saturation transfer of the relayed nuclear Overhauser effect(rNOE) enables detection of mobile protein protons via their exchange with the water signal. Recent studies have shown a close relationship between the rNOE-signal and the protein conformation. This study used the -3.5ppm rNOE-signal to monitor the heat shock response of HepG2 cells in a microcavity array-based bioreactor system. A significant drop of the rNOE-signal to 92.4±1.3% and a slow, steady increase of the rNOE-signal for 136.1±13.6min after heat shock were observed. Therefore, the rNOE-signal in CEST spectroscopic imaging is a sensitive readout for the cellular heat shock response.
Introduction
Chemical exchange saturation transfer(CEST) detects low concentrated metabolites and proteins via the water signal. CEST signals from proteins are closely linked to the protein conformation1-3, with the largest specificity found in the relayed nuclear Overhauser effect(rNOE)2. It has been shown that protein unfolding1,3 and protein aggregation2 reduce the rNOE signal in protein solutions and cell lysates. However, the detectability of denaturation processes via the rNOE signal on a physiological scale in vivo remains to be investigated.An MRI-compatible bioreactor with a high number of cells cultivated three-dimensionally in a perfused microcavity array(MCA)-based bioreactor system allows the study of cellular processes within a controlled environment4. In a previous study5, we showed that CEST signals originate mainly from cells with a small background signal from medium and collagen.
In this study, we investigated protein aggregation processes with this bioreactor system in living cells using CEST MRI. To do so, a mild heat shock was applied to the cells. The resulting protein aggregates are subsequently refolded by chaperones which are overexpressed upon heat shock6. This process of aggregation and refolding was monitored by dynamic CEST measurements to verify/demonstrate the influence of protein aggregation on the rNOE signal in living cells.
Material and Methods
Measurements were performed at a 9.4T preclinical Bruker MRI in combination with a quadrature 1H Bruker volume coil and a Bruker rat receiver surface array.A 3D culture of hepatocellular carcinoma cancer cells(HepG2) within two MCAs was actively perfused(400μl/min) under normoxic conditions at 37°C inside a bioreactor system(Fig.1). HepG2 cells(ATCC HB-8065) were prepared according to previous reports4,7,8. A heat shock at 42-43°C was applied for 20min by using a preheated second heat bath(Fig.1a). The temperature inside the bioreactor was then cooled down to 37°C by adding ice-cold water to both heating baths(Fig.1a). The parameters and switching times for both heat baths were determined by using an infrared thermometer prior to the MRI measurements(Fig.2).
For the CEST measurements, a continuous wave CEST-RARE sequence with a 10s block pulse, B1=0.8µT and either 93 offsets or 2 offsets(8ppm and -3.5ppm)9 was used to acquire a full Z-spectrum or a dynamic Z-spectrum, respectively. Z-spectra of voxels belonging to cells were averaged to obtain one Z-spectrum. Before and after dynamic CEST measurements, a full Z-spectrum was acquired. Dynamic CEST measurements interleaved with saturation recovery(SR) measurements were performed from 37min before the heat shock until 200min after the heat shock(Fig.2). CEST signals were isolated by Lorentian fitting of direct water saturation(DS) and semi-solid magnetization transfer(ssMT)10 and calculation of the AREX metric11. Dynamic CEST measurements were evaluated by9:
$$AREX_{ΔST} = \frac{1}{T_{1}}\left(\frac{1}{Z(-3.5ppm)}-\frac{1}{Z(8ppm)}\right)$$
The performance of AREXΔST in comparison to AREX was evaluated on:
- Cell medium(in the following referred to as medium)
- Two collagenized MCAs in medium
- HepG2 cells on two collagenized MCAs in medium
- Heat shock of two collagenized MCAs without cells in medium. To determine the influence of the heat shock on the protein background signal of medium and collagen.
- No heat shock of 16 million HepG2 cells on two collagenized MCAs in medium. To evaluate the temporal stability of the dynamic CEST measurement.
- Heat shock of two cell cultures with 18 and 16 million HepG2 cells on two collagenized MCAs in medium. To investigate the heat shock response in living cells using CEST MRI.
Results and Discussion
AREXΔST slightly overestimated the -3.5ppm rNOE-value compared to AREX(Tab.1). Residual contributions of DS and ssMT to AREXΔST were revealed by analysis of the Lorentzian fitting result(Tab.1). A symmetric ssMT was observed with a B1=0.8µT(Z(8ppm)=Z(-8ppm)). Based on these results, the approximation of the -3.5ppm rNOE-value by AREXΔST is applicable to our bioreactor system.The AREXΔST value of two MCAs without cells in medium did not change after and before the heat shock(Fig.3a). Therefore, a heat shock of the background protein signal had no effect on the rNOE signal after the heat shock. This was caused by a steady renewal of the medium and a rather mild heat shock temperature12. The evaluation of the temporal stability of dynamic CEST measurements resulted in a constant AREXΔST value during the heat shock protocol(Fig.3b), which was confirmed by nearly identical AREX spectra(Fig.3c).
The heat shock in both cell cultures resulted in a significant reduction of AREXΔST to 92.4±1.3%(p<0.01) after heat shock(Fig.4a,b). Thereafter, AREXΔST increased continuously for 136.1±13.6min reaching the same AREXΔST value as before the heat shock. Recovery to the same rNOE-value was confirmed by the AREX spectra(Fig.4c,d). The decrease of the rNOE signal after heat shock is consistent with results from protein unfolding1,3 and protein aggregation2 measurements in protein solutions and cell lysates. The complete protein refolding process lasts a few hours6,13,14 in agreement with the observed duration for the recovery of the rNOE signal. While the contribution of further heat shock-induced cellular effects cannot be excluded, the continuous increase of AREXΔST after the heat shock can be explained by chaperone-induced refolding of protein aggregates6.
Conclusion
The MRI-compatible bioreactor with a high number of cells cultivated three-dimensionally in MCAs allowed us to observe the cellular heat shock response using CEST MRI. These results suggest that protein aggregation processes influence the rNOE signal in vivo on a physiologically relevant scale.Acknowledgements
We gratefully thank the German Research Foundation (DFG; GO 2172/1-1) for financial support. In addition, we cordially thank Axel Mogk and Bernd Bukau from the Zentrum für Molekulare Biologie (ZMBH) in Heidelberg, Germany, for their advice in performing the heat shock experiment.References
- Zaiss M, Kunz P, Goerke S, Radbruch A, Bachert P. MR imaging of protein folding in vitro employing nuclear-Overhauser-mediated saturation transfer. NMR Biomed. Dec 2013;26(12):1815-1822.
- Goerke S, Milde KS, Bukowiecki R, et al. Aggregation-induced changes in the chemical exchange saturation transfer (CEST) signals of proteins. NMR Biomed. Jan 2017;30(1).
- Goerke S, Zaiss M, Kunz P, et al. Signature of protein unfolding in chemical exchange saturation transfer imaging. NMR Biomed. Jul 2015;28(7):906-913.
- Gottwald E, Kleintschek T, Giselbrecht S, et al. Characterization of a chip-based bioreactor for three-dimensional cell cultivation via Magnetic Resonance Imaging. Zeitschrift fur medizinische Physik. May 2013;23(2):102-110.
- Kleimaier D, Goerke S, Nies C, Gottwald E, Schad L. Initial CEST study in a microcavity array based 3D cell culture system. Proc. Intl. Soc. Mag. Reson. Med. 2019;27:4000.
- Mogk A, Bukau B, Kampinga HH. Cellular Handling of Protein Aggregates by Disaggregation Machines. Mol Cell. Jan 18 2018;69(2):214-226.
- Altmann B, Giselbrecht S, Weibezahn KF, Welle A, Gottwald E. The three-dimensional cultivation of the carcinoma cell line HepG2 in a perfused chip system leads to a more differentiated phenotype of the cells compared to monolayer culture. Biomedical materials. Sep 2008;3(3):034120.
- Gottwald E, Giselbrecht S, Augspurger C, et al. A chip-based platform for the in vitro generation of tissues in three-dimensional organization. Lab on a chip. Jun 2007;7(6):777-785.
- Chen L, Wei Z, Chan KWY, et al. Protein aggregation linked to Alzheimer's disease revealed by saturation transfer MRI. Neuroimage. Mar 2019;188:380-390.
- Zaiss M, Schmitt B, Bachert P. Quantitative separation of CEST effect from magnetization transfer and spillover effects by Lorentzian-line-fit analysis of z-spectra. J Magn Reson. Aug 2011;211(2):149-155.
- Zaiss M, Xu J, Goerke S, et al. Inverse Z-spectrum analysis for spillover-, MT-, and T1 -corrected steady-state pulsed CEST-MRI--application to pH-weighted MRI of acute stroke. NMR Biomed. Mar 2014;27(3):240-252.
- Lin VJ, Koenig JL. Raman studies of bovine serum albumin. Biopolymers. Jan 1976;15(1):203-218.
- Michels AA, Kanon B, Konings AW, Ohtsuka K, Bensaude O, Kampinga HH. Hsp70 and Hsp40 chaperone activities in the cytoplasm and the nucleus of mammalian cells. J Biol Chem. Dec 26 1997;272(52):33283-33289.
- Nollen EA, Brunsting JF, Roelofsen H, Weber LA, Kampinga HH. In vivo chaperone activity of heat shock protein 70 and thermotolerance. Mol Cell Biol. Mar 1999;19(3):2069-2079.
Figures
Fig.1: a) The bioreactor setup consisting of a
peristaltic pump, a gas mixing station, and a heat bath was extended by a second
heat bath, which was used during the heat shock. b) i) The bioreactor housing
contains the MCAs. ii) The cross-section of the bioreactor housing illustrates
the medium flow through the pores of the MCAs. iii) A high-resolution RARE
image allows to visualizes the cavity structure of the MCAs, which is also
visible iv) under the light microscope.
Fig.2: a) The heat bath parameters and timings were
determined by temperature measurements, shown in c), using an infrared
thermometer. b) The measurement protocol was adapted for a finer sampling of T1
around the application of the heat shock. Before each sequence, the reference
frequency was set to correct for frequency drifts over time. c) The T1
measurement correlates well with the observed temperature change during the 1st
cell culture experiment.
Tab.1: Comparison of AREX and AREXΔST
for the bioreactor system. For medium and MCAs in medium, the Lorentzian fit
was only performed for DS as in these samples no ssMT was apparent in the
Z-spectra.
Fig.3: a) A heat shock of medium and collagen,
which results in the background rNOE signal, did not affect the rNOE signal
after the heat shock. b) The temporal stability of the rNOE signal during the
heat shock protocol without heat shock application is shown. The rNOE signal
was constant during the heat shock protocol. c) AREX spectra before and after
the evaluation of the temporal stability confirmed a constant rNOE signal over
time.
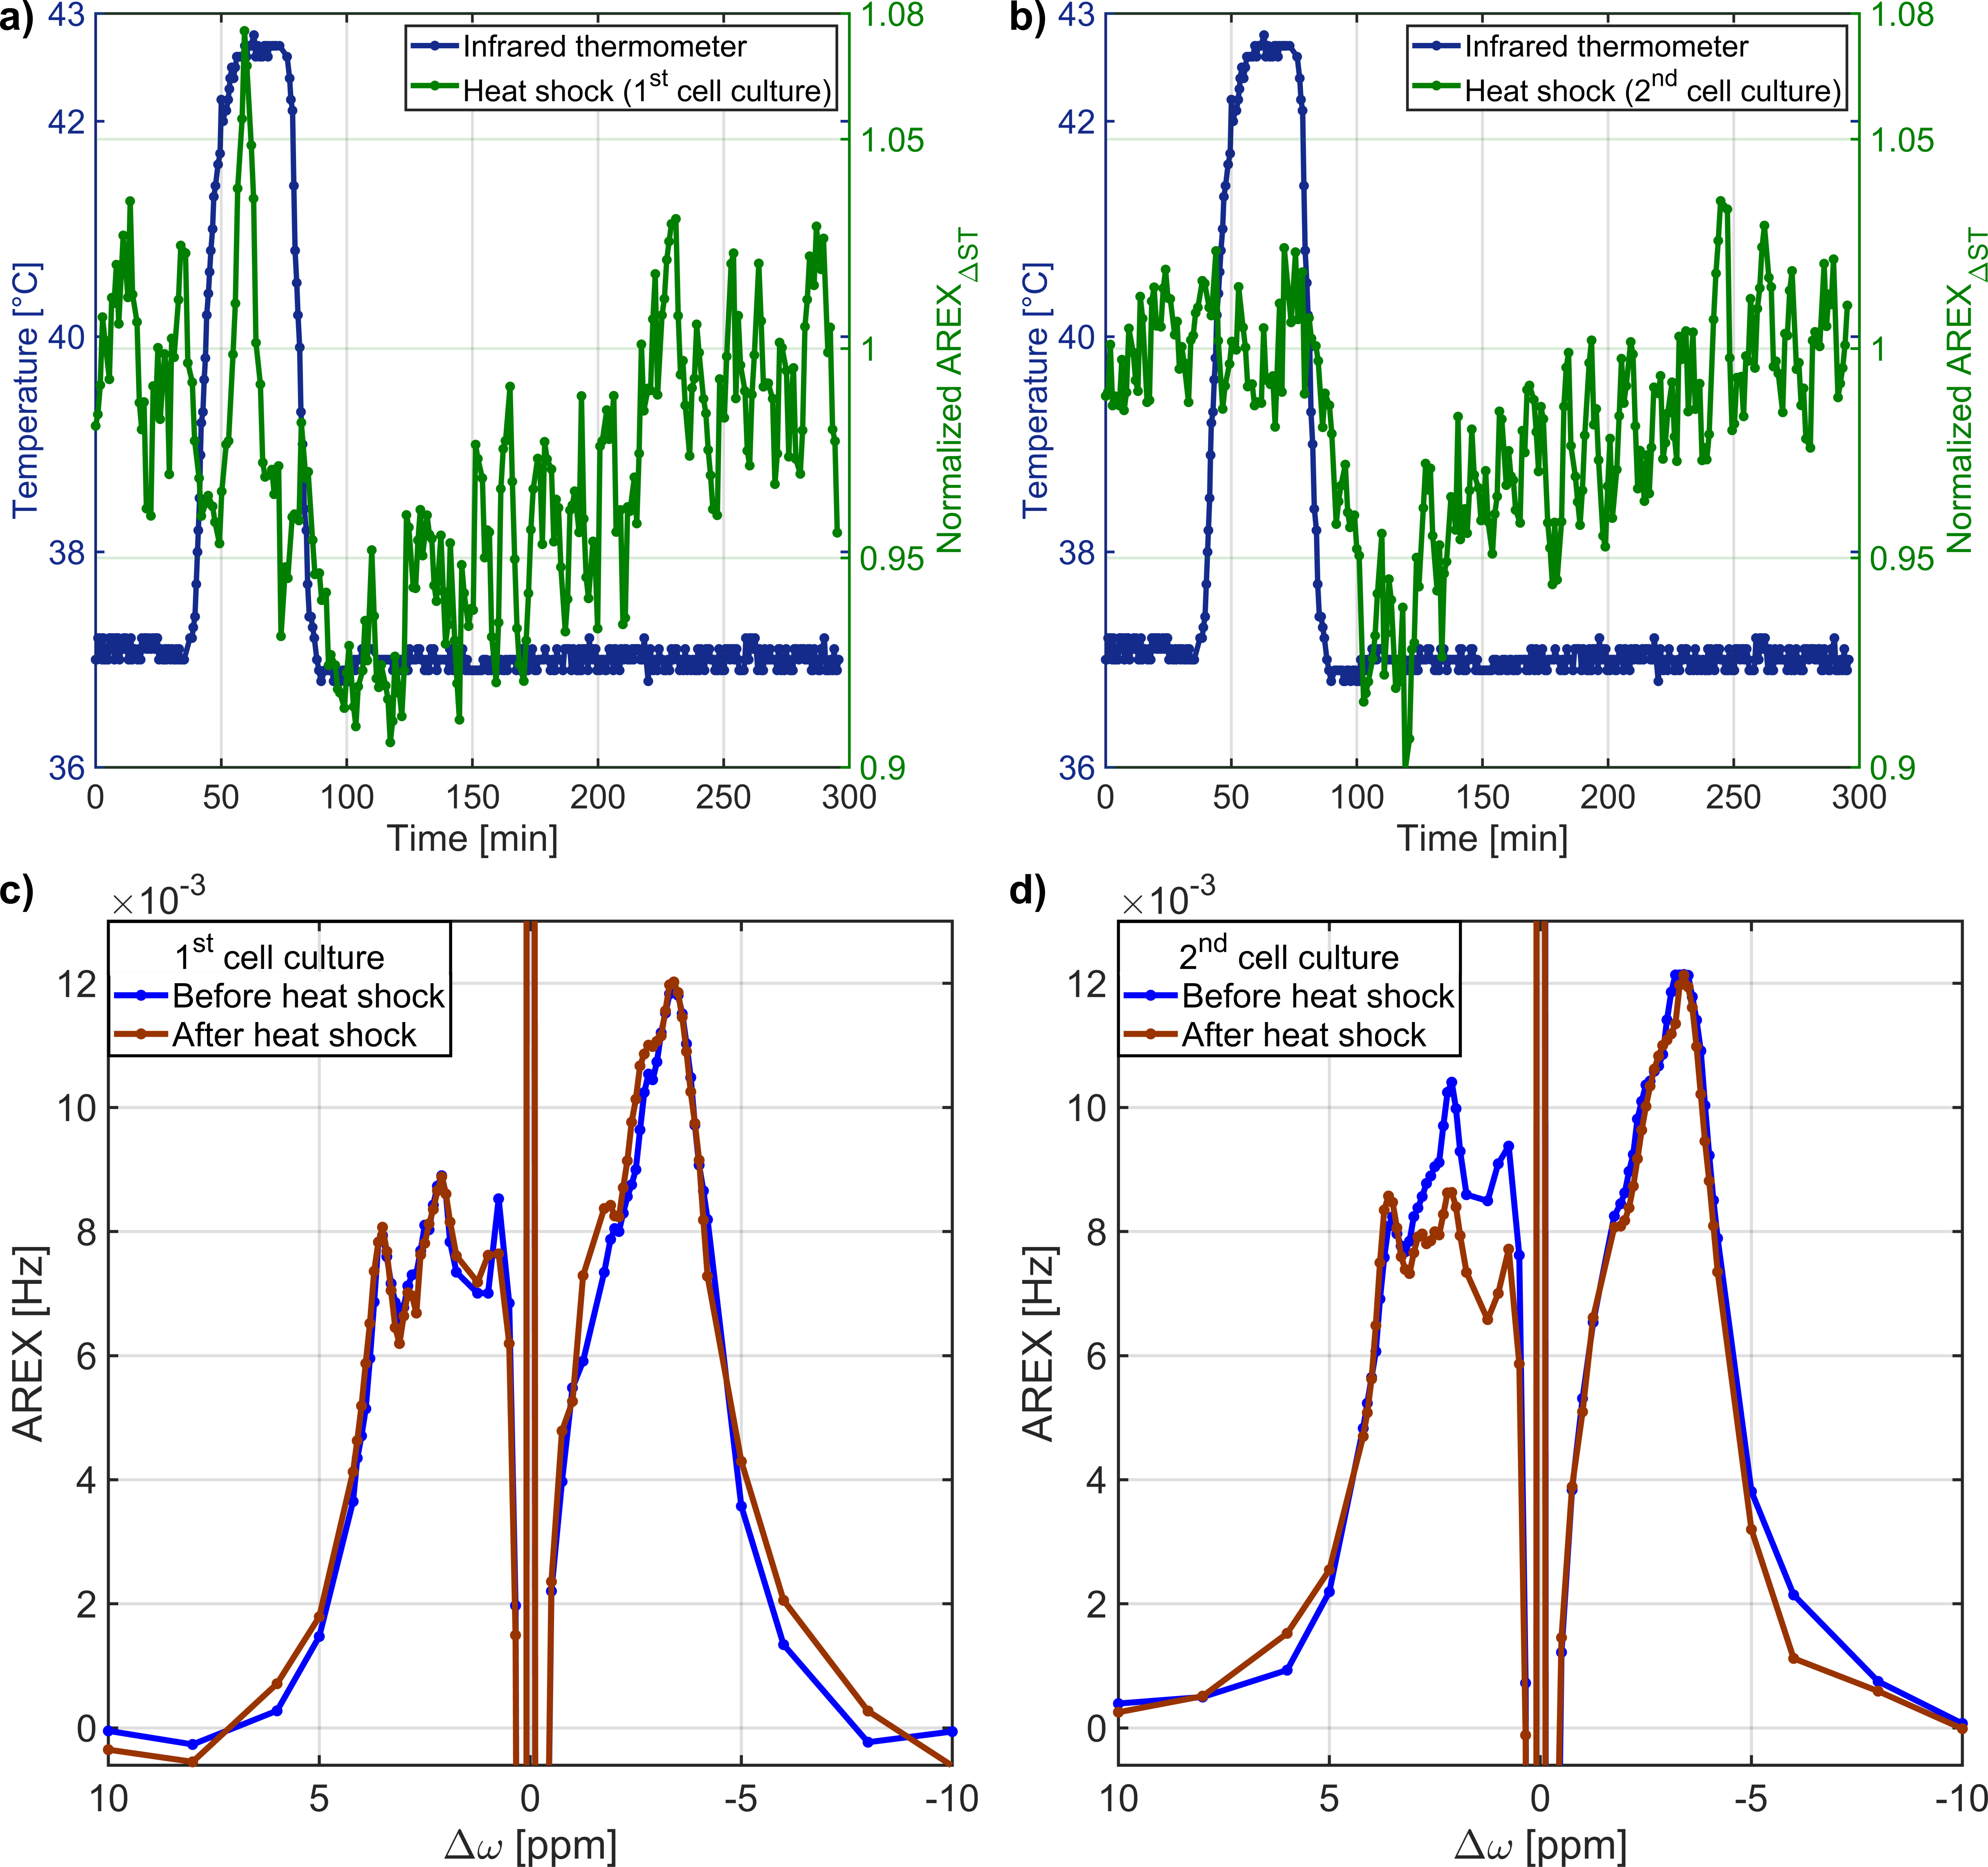
Fig.4: a),b) The application of a heat shock to
both cell cultures resulted in a significant decrease of the rNOE signal after
the heat shock. Thereafter, the rNOE signal slowly increased to the initial
value before the heat shock. c),d) The AREX spectra confirmed the recovery of
the rNOE signal to the initial value.