3128
Concentration-independent absolute pH mapping using amide CEST-MRI at 9.4 T1Division of Medical Physics in Radiology, German Cancer Research Center (DKFZ), Heidelberg, Germany
Synopsis
In this study, we developed an absolute pH mapping method based on endogenous amide CEST-MRI which simultaneously compensates for concentration changes, the semi-solid magnetization transfer, and spillover dilution. This was realized by a ratiometric approach of two different B1 in combination with the inverse metric and polynomial Lorentzian-fitting of the amide signal. Compensation for concomitant effects was theoretically demonstrated in simulations and verified experimentally in protein model solutions and porcine brain lysates. Consequently, amide signal-based absolute pH mapping is now in principle also reliably applicable for tumor imaging which was previously prevented by the concomitant effects.
Introduction
Intracellular pH is a valuable imaging marker for cancer as it is known to be increased in tumors. In principle, high-resolution imaging of the intracellular pH is feasible by means of CEST-MRI of the endogenous amide proton signal which originates mainly form mobile proteins and peptides within cells.1 To separate the pH-dependency form concomitant effects, such as concentration changes, several approaches have already been proposed.2–8 However, current methods are unable to simultaneously compensate for the amide proton concentration, along with superimposing CEST signals, the semi-solid magnetization transfer (MT), and spillover dilution, which can all strongly vary in tumors.9 The aim of this study was to develop an absolute pH mapping method based on endogenous amide CEST-MRI applicable for tumor imaging. We hypothesize that this can be realized at 9.4T by a ratiometric approach with two different saturation amplitudes (B1)2,3 in combination with the inverse metric10 and a polynomial Lorentzian-fitting11 of the amide signal.Methods
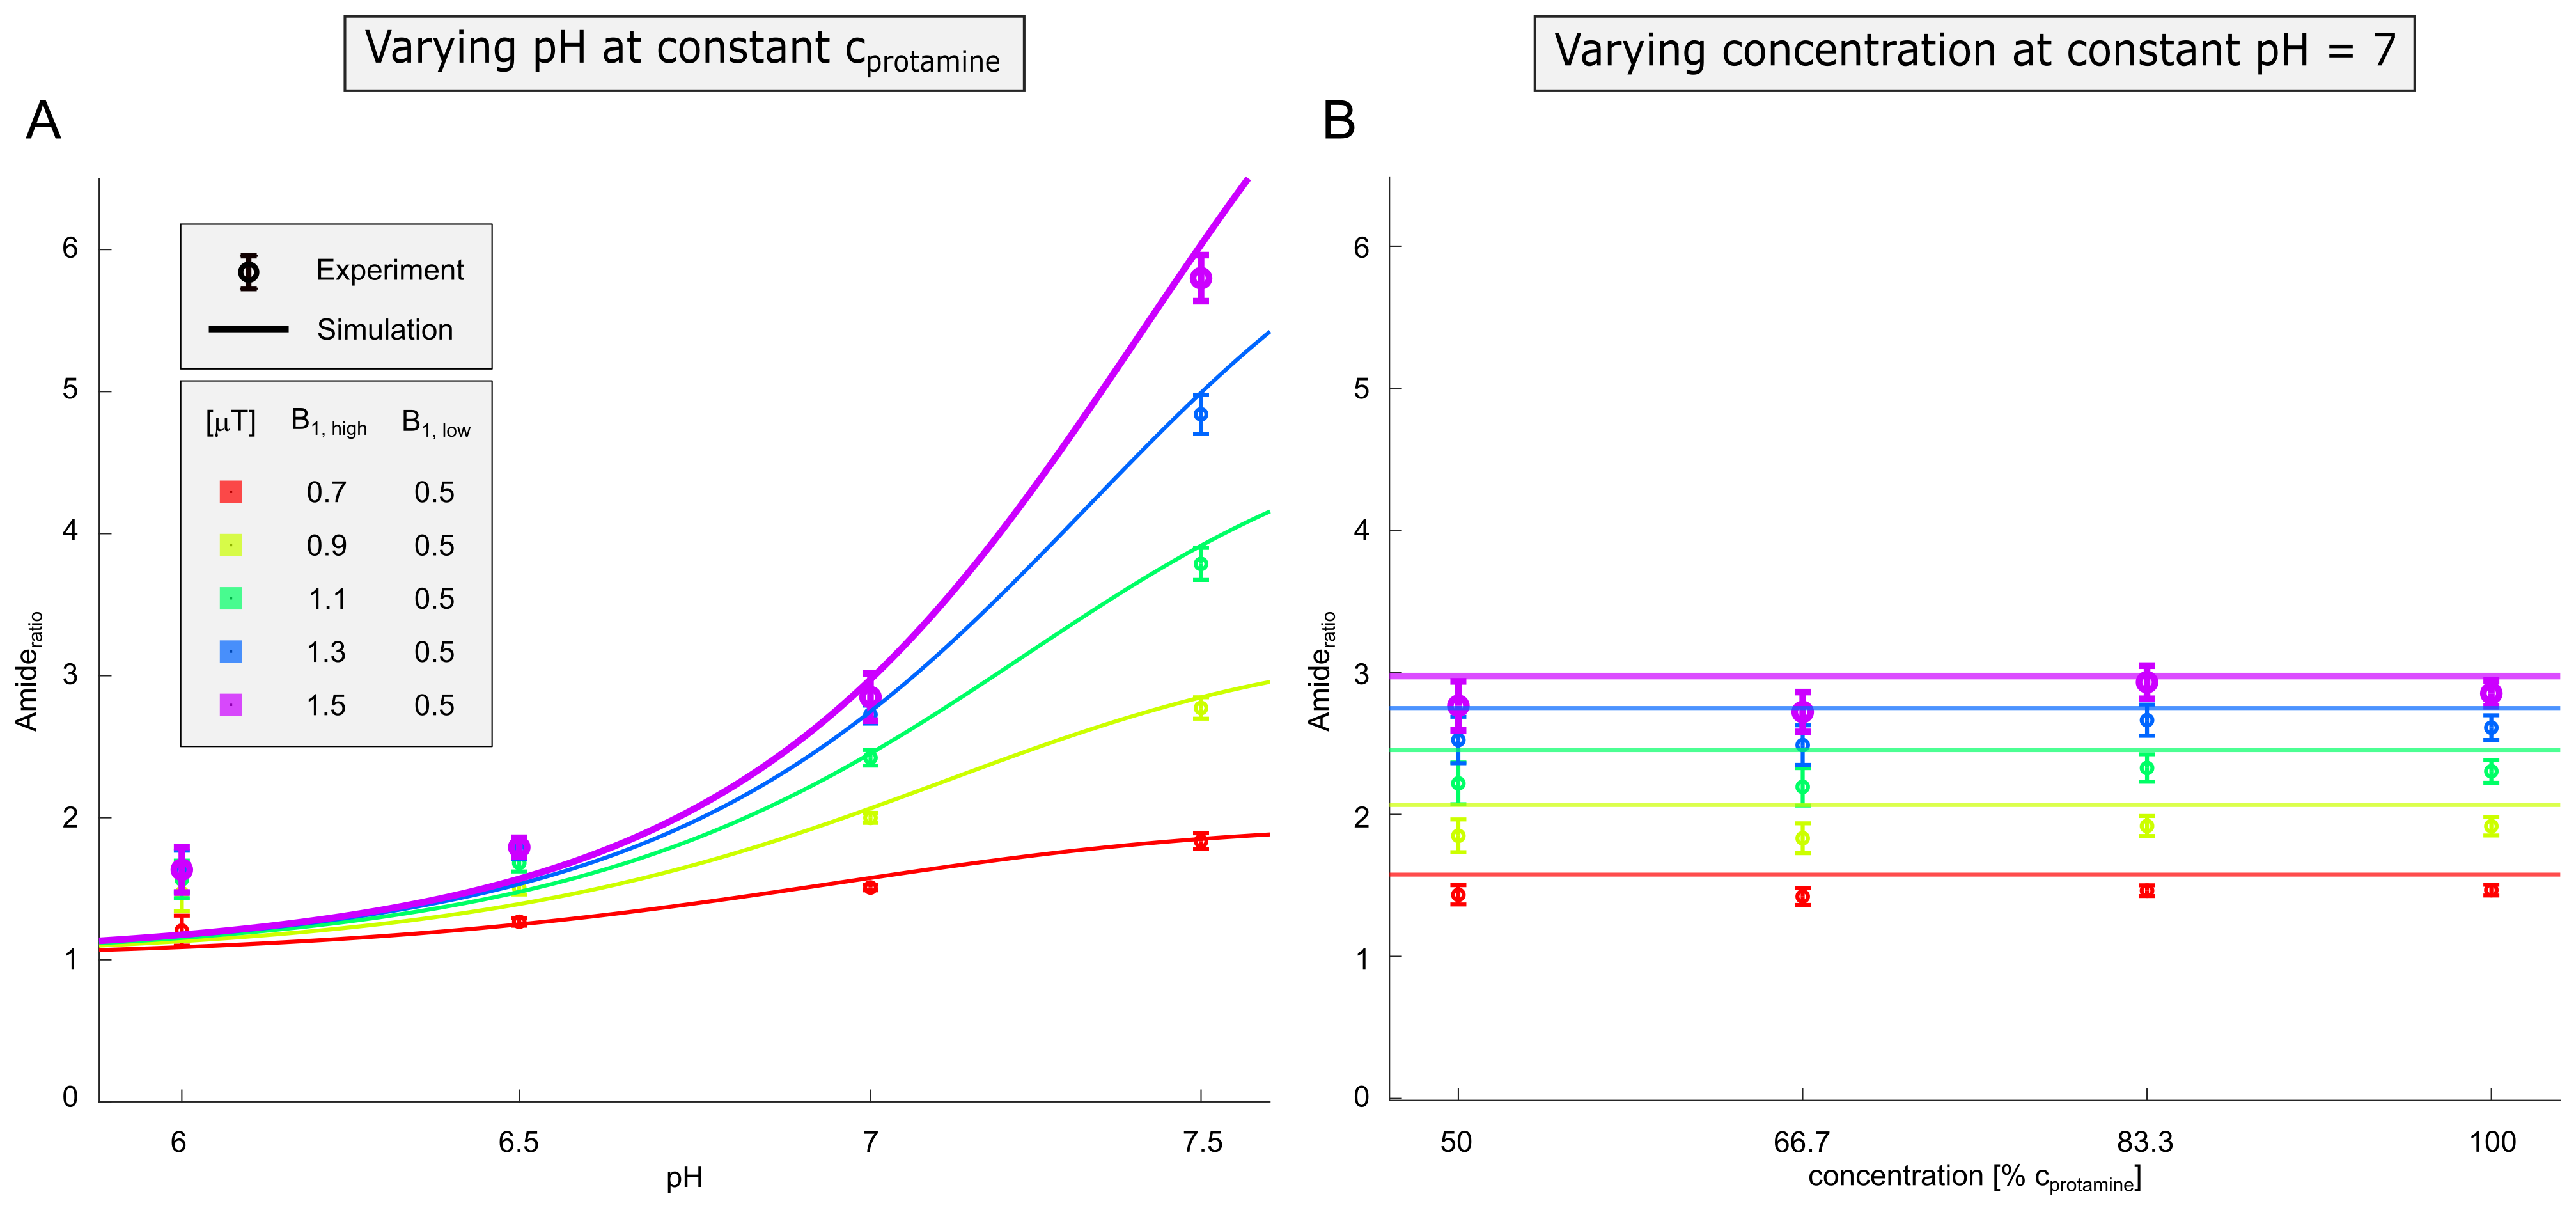
Acquisition of the inverse magnetization transfer ratio10 $$$MTR_{Rex}=\frac{1}{Z}-\frac{1}{Z_{ref}}$$$ of the amide signal at two different B1 allows calculation of a spillover corrected and concentration-independent ratio, which is only dependent on pH2,3 (Figure 1, colored lines):$$Amide_{ratio}(pH)=\frac{MTR_{Rex}(B_{1,high})}{MTR_{Rex}(B_{1,low})}=\bigg(\frac{B_{1,high}}{B_{1,low}}\bigg)^2\frac{(\gamma~B_{1,low})^2+k_{ex}(k_{ex}+R_{2b})}{(\gamma~B_{1,high})^2+k_{ex}(k_{ex}+R_{2b})}\quad[Equation~1]$$
with the dominantly base-catalyzed exchange rate $$$k_{ex}=k_{b}10^{pH-pK_{W}}=k_{c}10^{pH}$$$ and the transversal relaxation rate of the amide pool R2b. Measurement of the Amideratio and rearranging Equation 1 allows calculation of absolute pH maps by setting the exchange rate-determining constant kc and R2b to fixed values (see Results and Discussion).
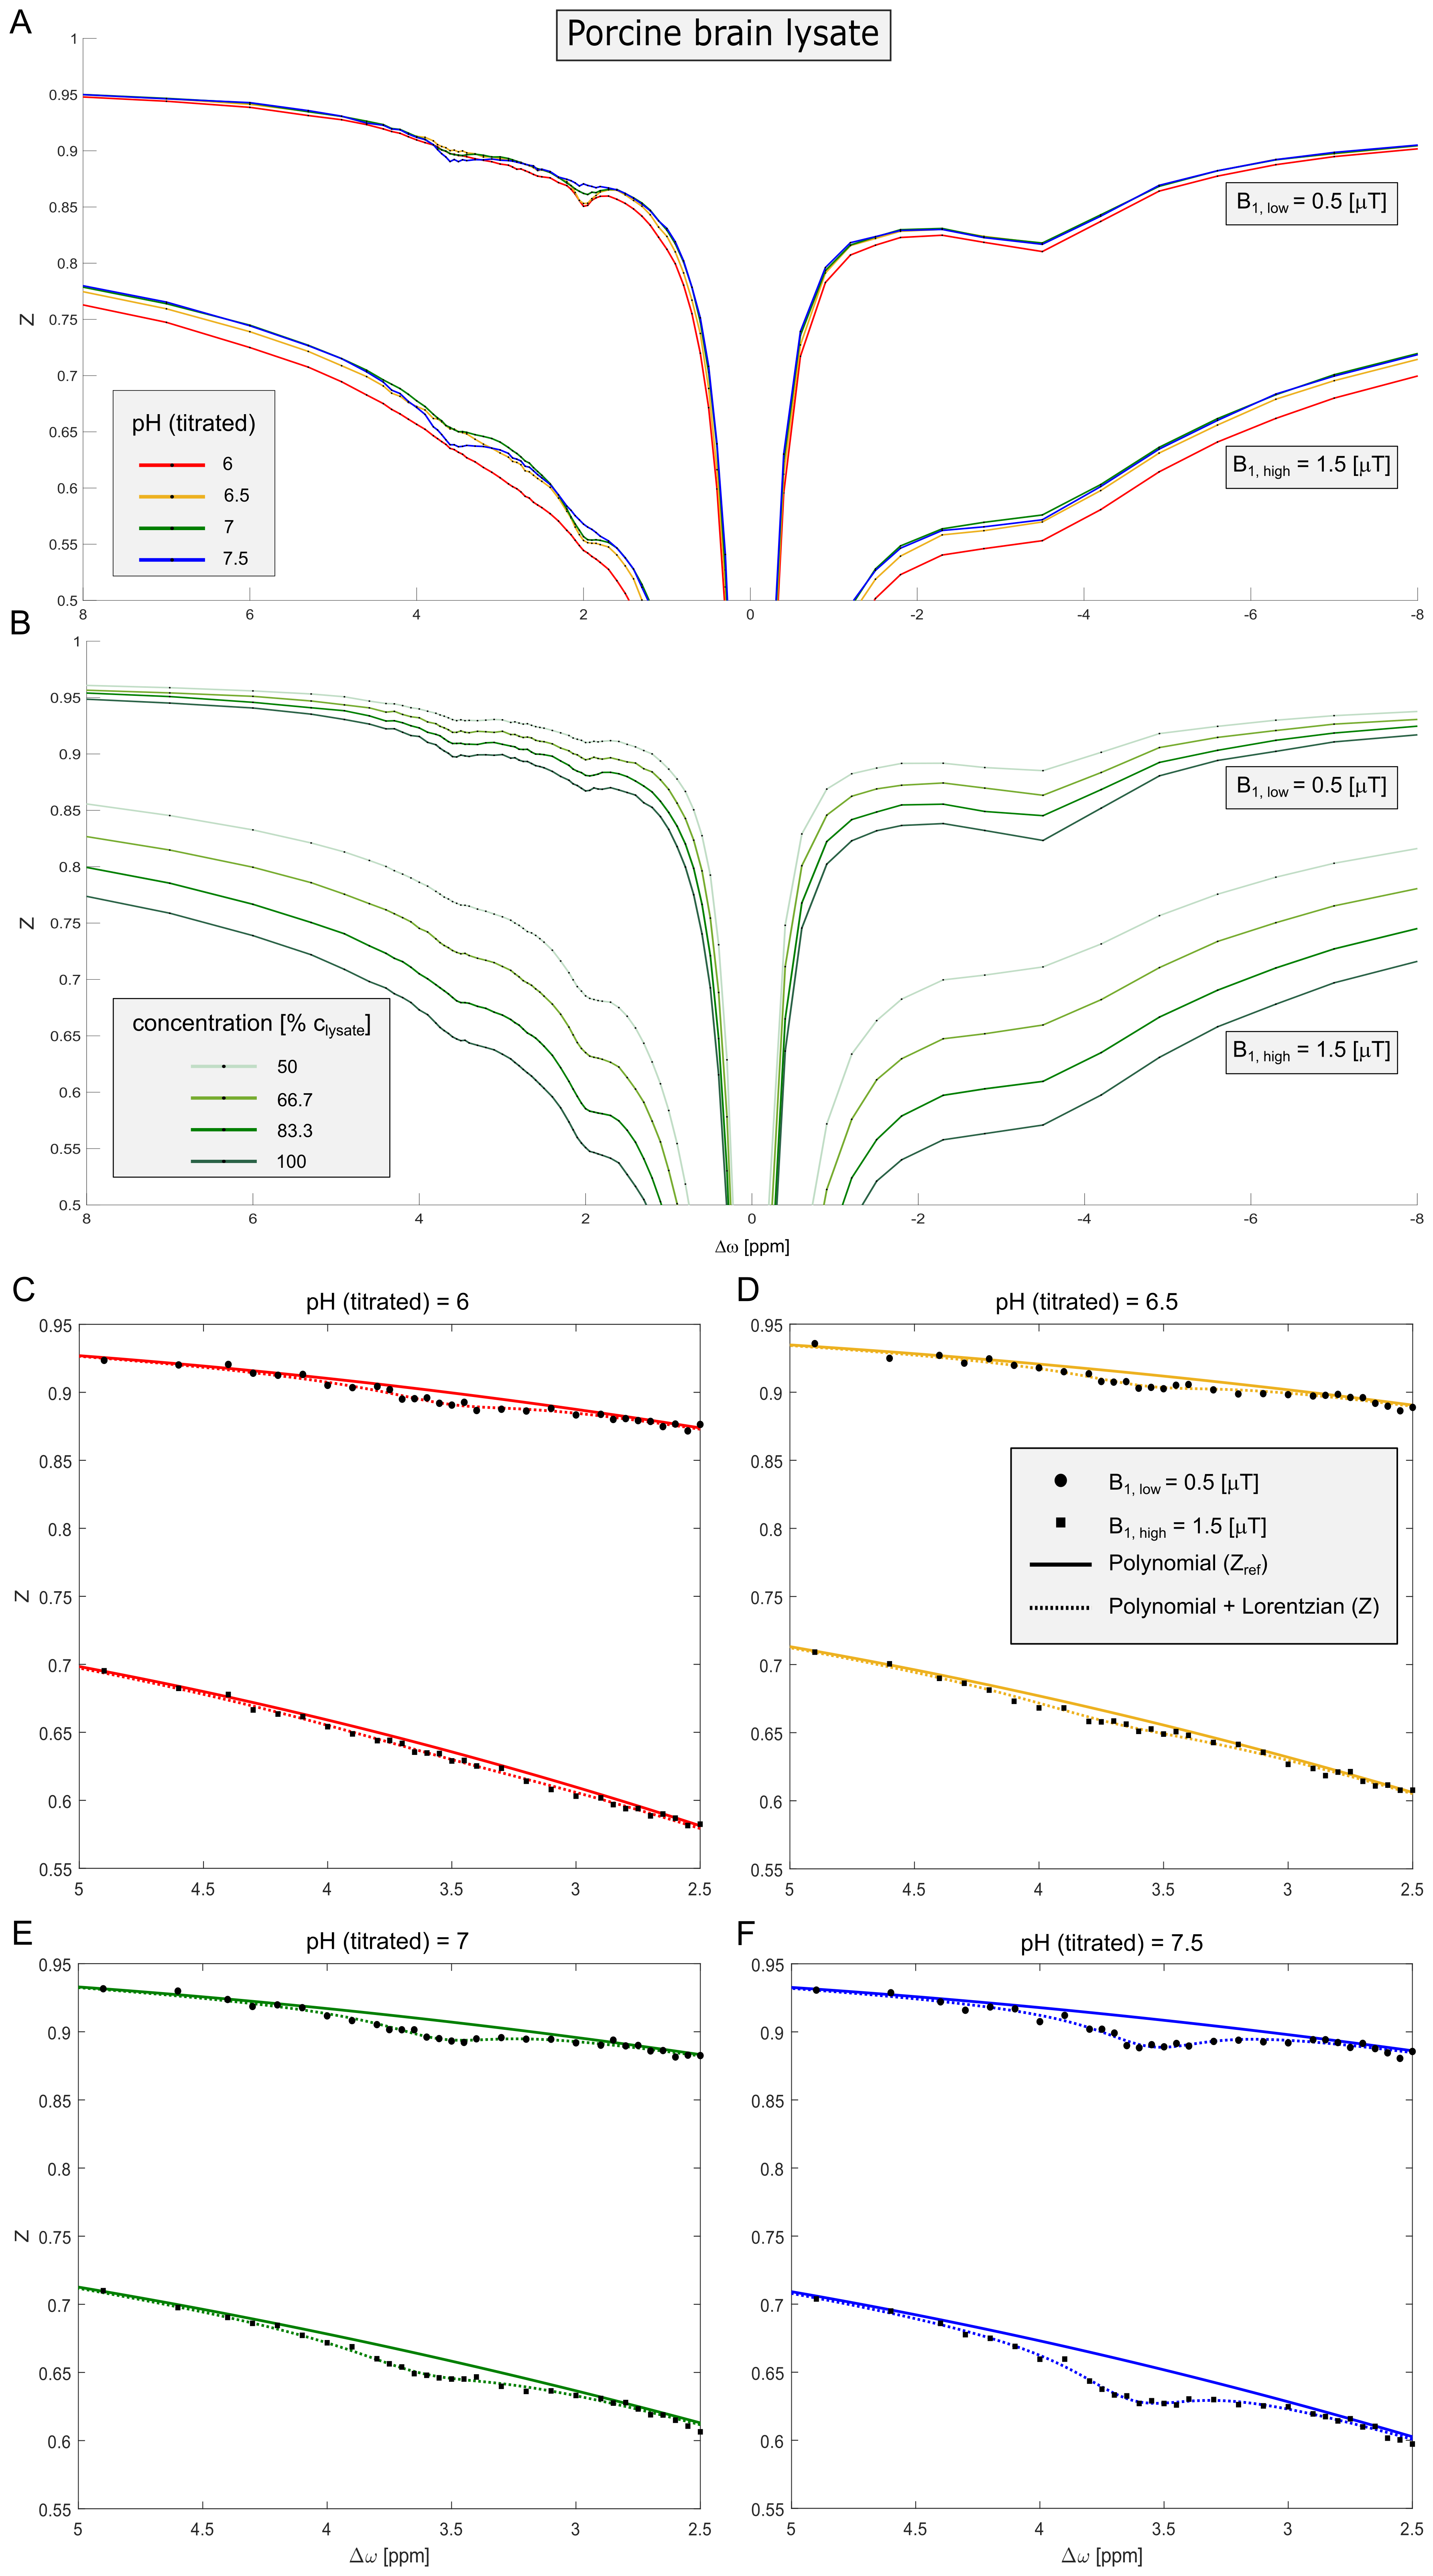
Extraction of the amide signal (Δω≈3.6ppm) from the background (i.e. Zref) of superimposing CEST signals and MT was realized by a second order polynomial and Lorentzian fitting approach adjusted from11 (Figure 3C-F). Frequency offsets in the range of 3 to 7ppm and 2.6 to 7ppm were found to be optimal for the fitting of protamine and porcine brain lysate data, respectively.
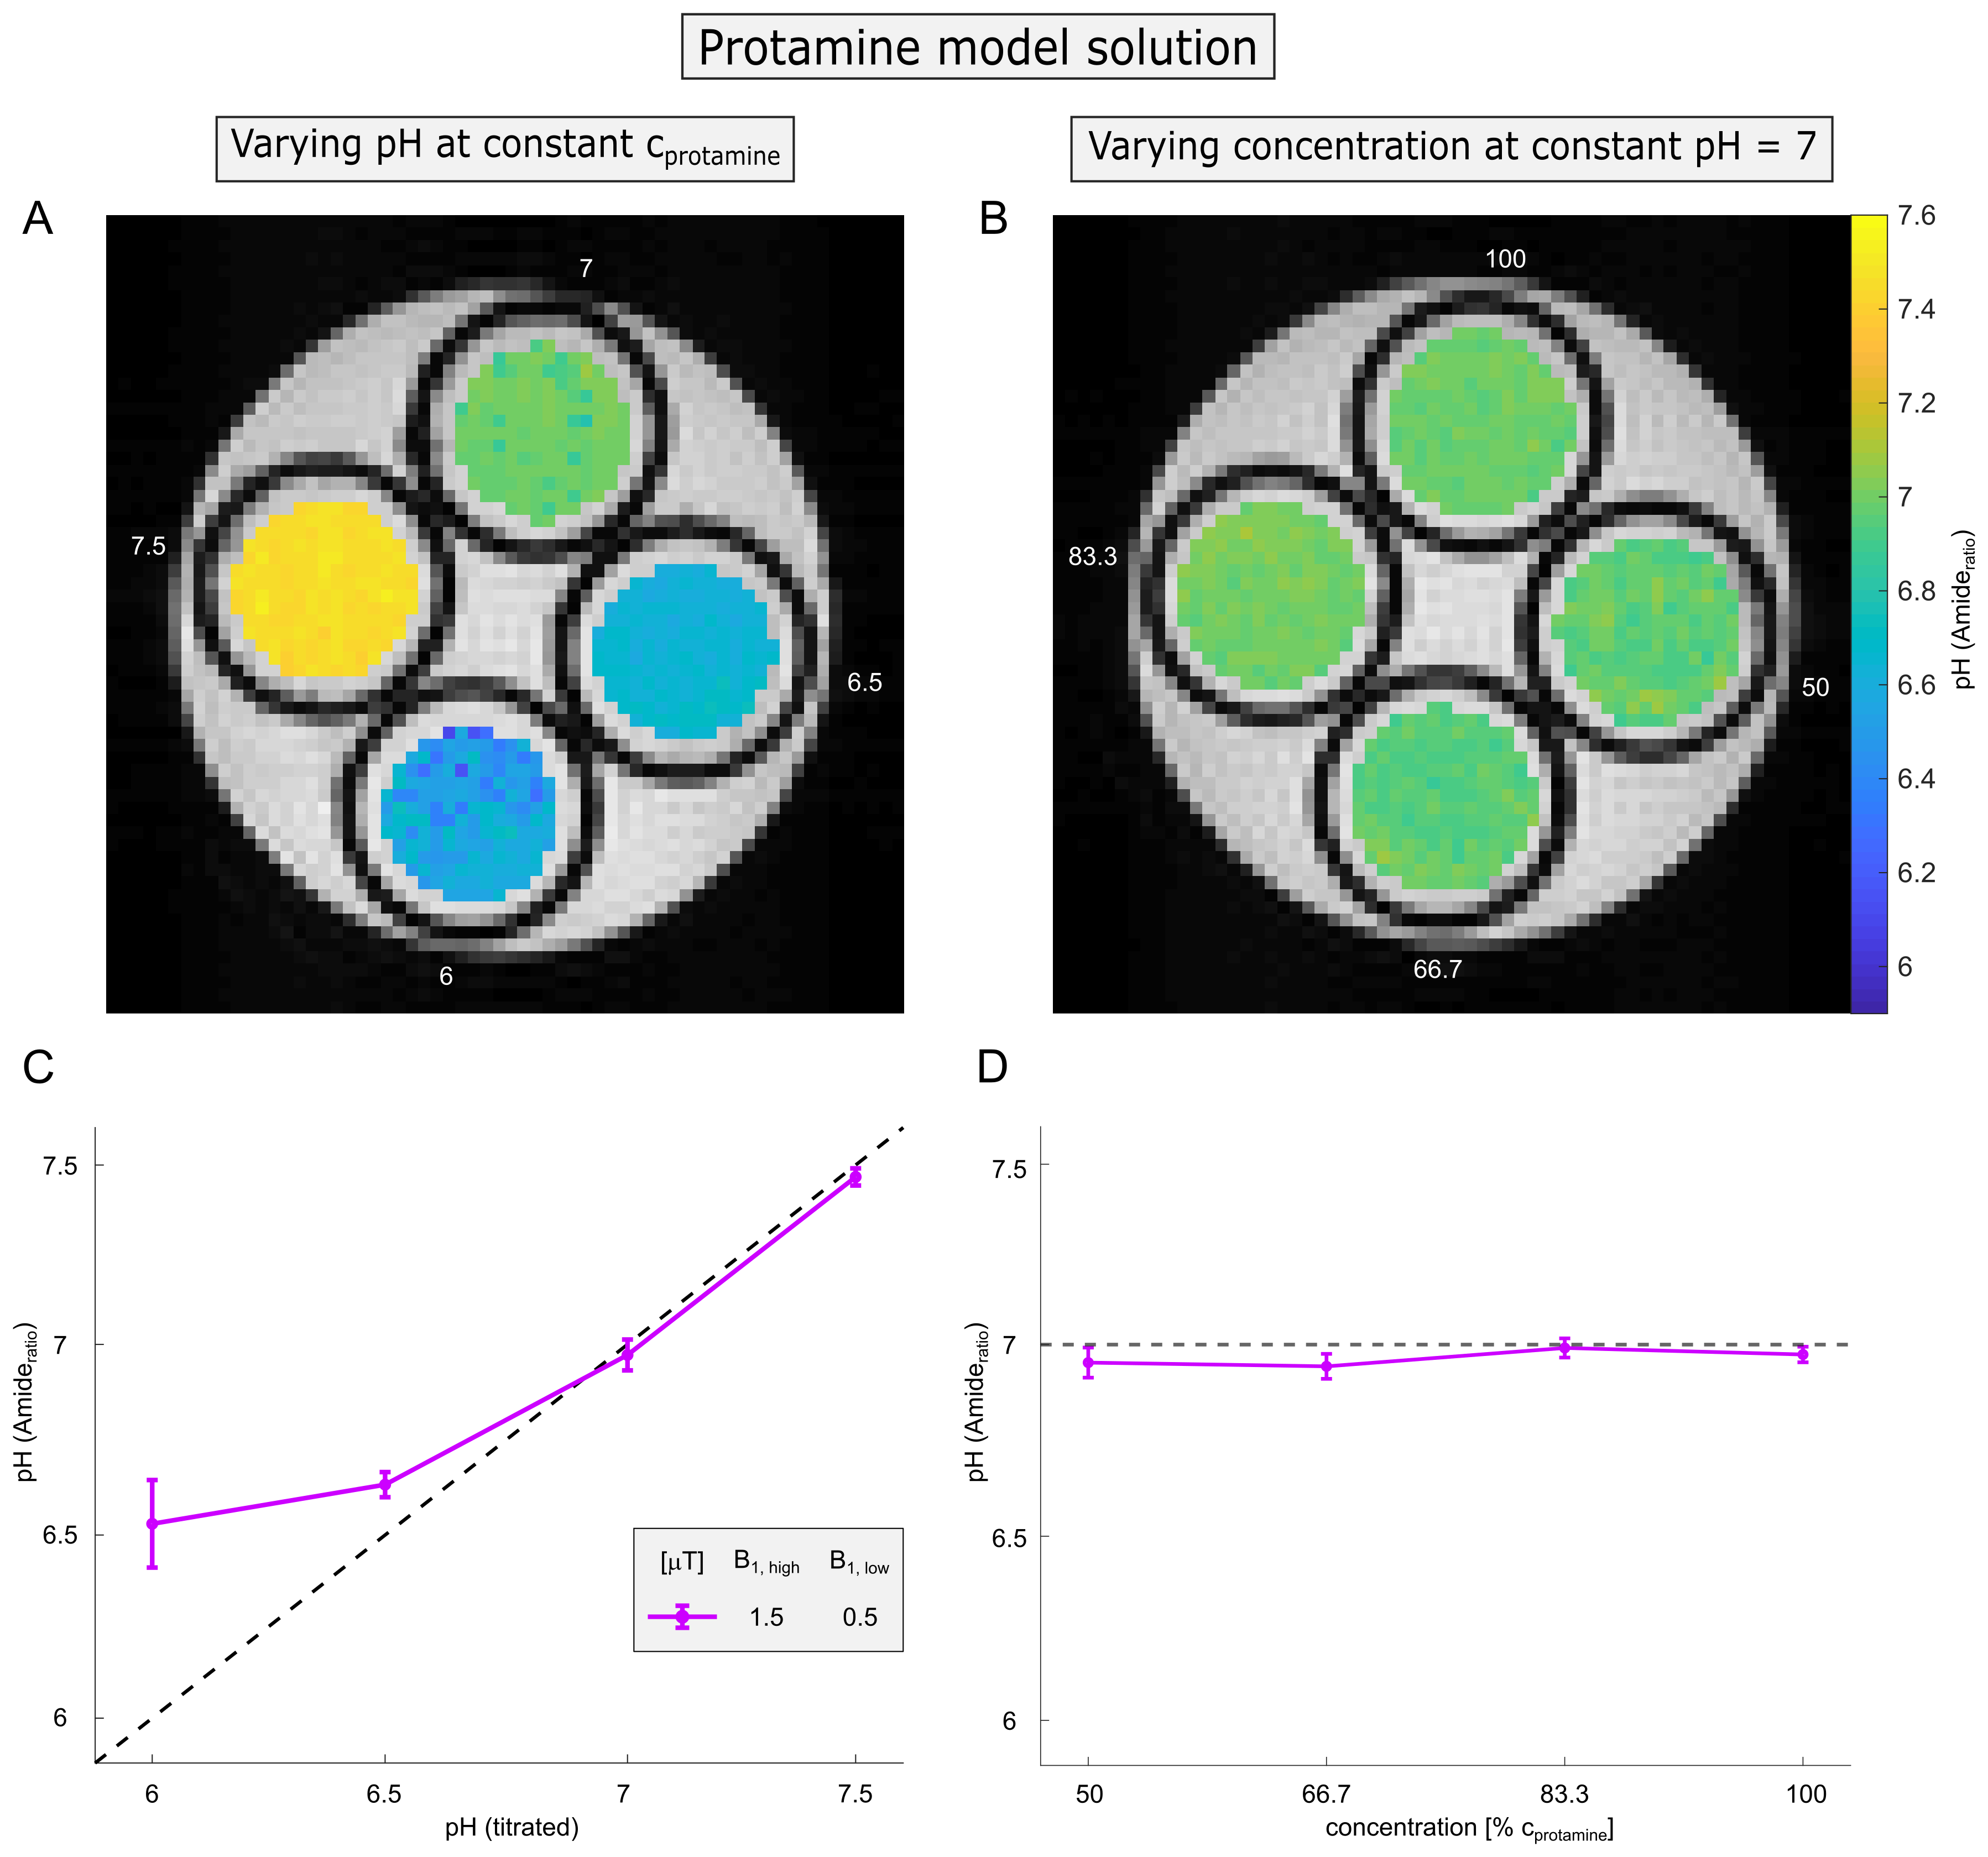
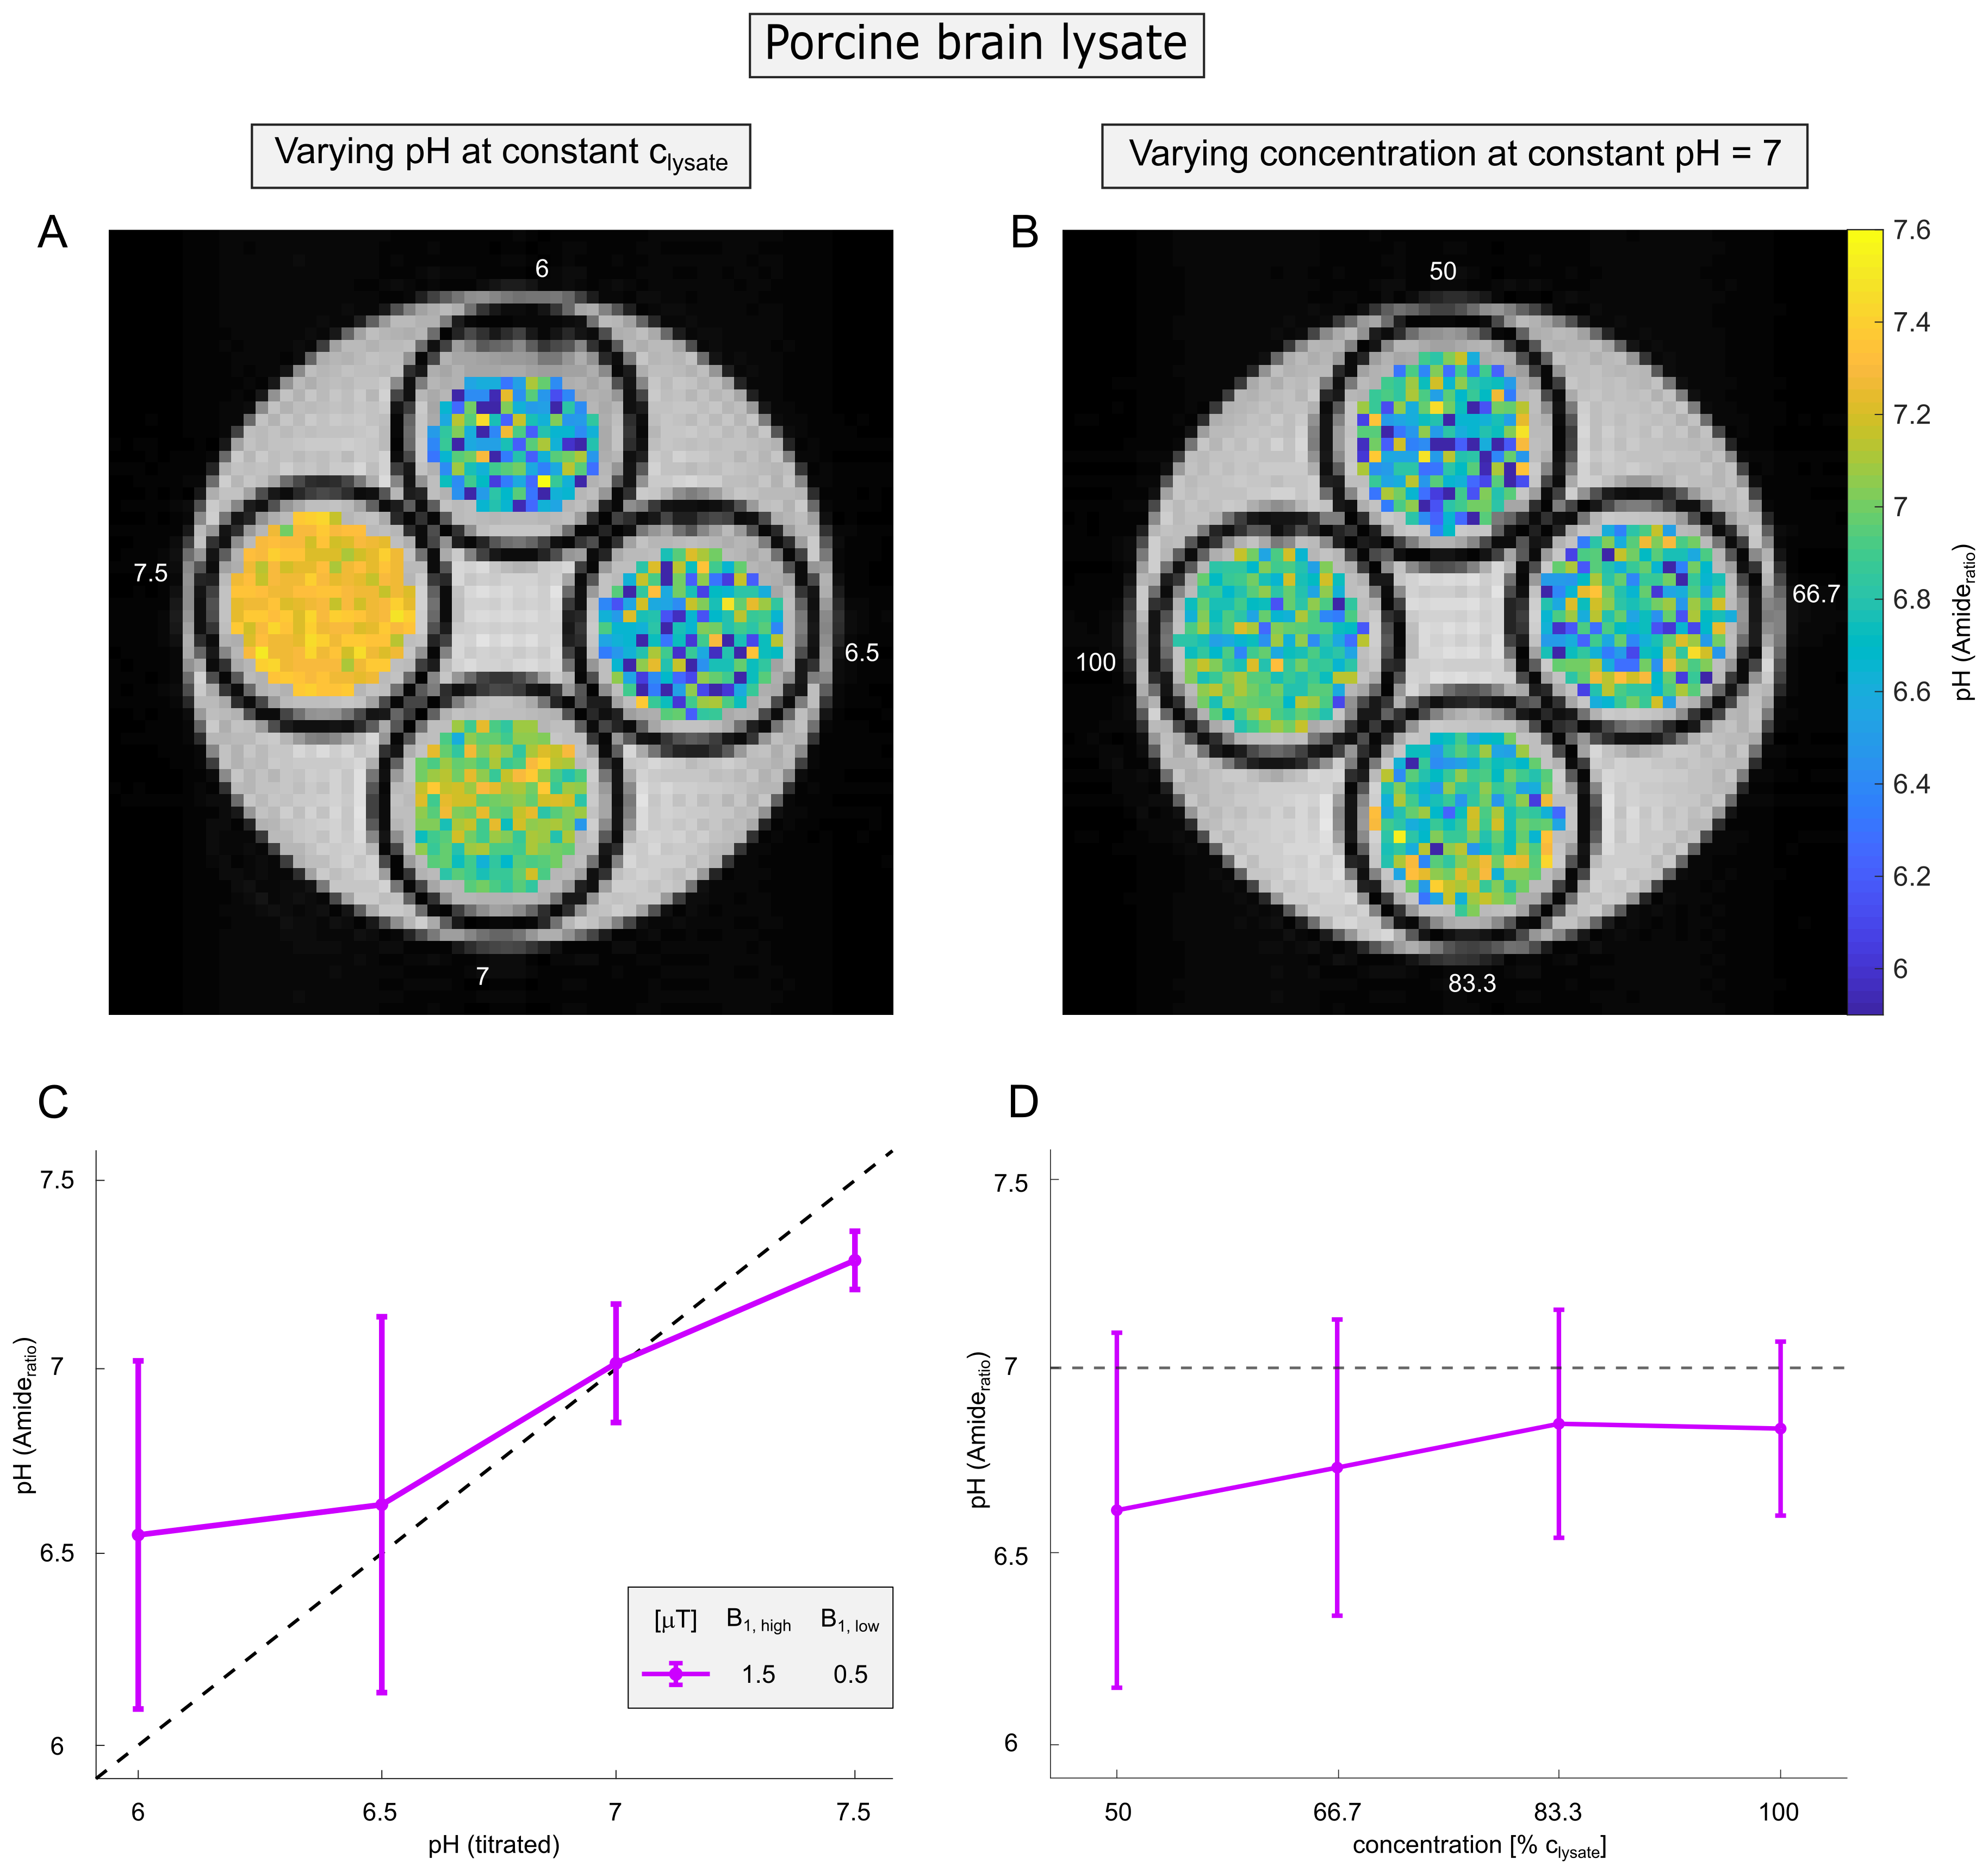
Protamine model solutions of concentration cprotamine=1.5%(w/v) and in vivo-like porcine brain lysates12 of concentration clysate=50%(w/v) were prepared at various pH between 6 and 7.5 (Figure 2A,C and 4A,C). In addition, the concentration was varied between 50% and 100% of the respective concentration at pH=7 (Figure 2B,D and 4B,D).
Centric-centric reordered 3D-GRE-CEST-MRI (0.5×0.5×2mm³, matrix=64×64×8) was performed on a 9.4T small animal MR scanner (Bruker). Pre-saturation was realized by a continuous-wave pulse of duration 10s and amplitudes B1=0.5,0.75,1,1.5,2,2.5µT. All measurements were stabilized at 37.0±0.1°C using the internal heating device. B0 and B1 maps were calculated using the WASABI-method13 and utilized to correct the acquired data for B0 and B1 inhomogeneities.14
Results and Discussion
In coherence with theory (Equation 1) a distinct dependency of the Amideratio on pH (Figure 1A, circles) while being independent on concentration (Figure 1B, circles) was observed in protamine model solutions. Determination of the Amideratio allowed for calculation of concentration-independent absolute pH maps (Figure 2A,B). In order to match the calculated pH and the titrated pH (Figure 2C), kc and R2b were empirically set to 13µHz and 250Hz, respectively. At low pH<6.5 deviations were apparent which can be traced back to the intrinsically small exchange rates of amide protons at low pH, leading to quite small CEST effects which cannot be fitted accurately enough (data not shown).In order to evaluate the specificity of the Amideratio to pH under in vivo-like conditions (i.e. small amide signal and large MT) porcine brain lysates were investigated (Figure 3A,B). Extraction of the amide signal form the background of concomitant effects by the proposed polynomial Lorentzian fit model (see Methods section) was stable over a broad range of pH and B1 (Figure 3C-F). Similar to the calculation of the protamine pH maps, kc and R2b of the porcine brain lysates were empirically set to 0.25µHz and 250Hz, respectively, to match the calculated and the titrated pH (Figure 4C). In comparison to protamine, the pH maps were noisier (Figure 4A,B), but the distinct dependency on pH (Figure 4C) while being independent on concentration (Figure 4D) was still apparent for the in vivo-like porcine brain lysates. Again, deviations were most apparent at low pH<6.5, which again can be explained by the intrinsically small amide signal at low pH (Figure 3C). The MT, which significantly varied over the concentration series (Figure 3B) was adequately corrected (Figure 4B,D) due to the intrinsic compensation of spillover effects by application of the inverse metric (Equation 1).
In this study, kc was empirically set to match the titrated pH. In doing so, a large difference between the protamine and porcine brain lysate sample of approximately two orders of magnitude was observed. The corresponding exchange rates at pH=7 are 130Hz and 2.5Hz for the protamine and porcine brain lysate sample, respectively. Due to this discrepancy, in the future, kc will be determined directly in vivo by correlation of the pH maps calculated from the Amideratio with 31P-MRSI-pH data.
Conclusion
We presented an absolute pH mapping method based on endogenous amide CEST-MRI which simultaneously compensates for the amide proton concentration, superimposing CEST signals, MT, and spillover dilution. Thus, amide signal-based absolute pH mapping is now in principle also reliably applicable for tumor imaging at 9.4T, paving the way for future pre-clinical studies on intracellular pH changes in cancer using CEST-MRI.Acknowledgements
We gratefully thank the German Research Foundation (DFG; GO 2172/1-1), the Helmholtz Association, and the Max Planck Society for the financial support.References
1. Zhou J, Payen J-F, Wilson DA, et al. Using the amide proton signals of intracellular proteins and peptides to detect pH effects in MRI. Nat Med. 2003;9:1085–1090.
2. Rerich E, Zaiss M, Korzowski A, et al. Relaxation-compensated CEST-MRI at 7 T for mapping of creatine content and pH – preliminary application in human muscle tissue in vivo. NMR Biomed. 2015;28:1402–1412.
3. Sun PZ, Xiao G, Zhou IY, et al. A method for accurate pH mapping with chemical exchange saturation transfer (CEST) MRI. Contrast Media Mol Imaging. 2016;11:195–202.
4. Arena F, Irrera P, Consolino L, et al. Flip-angle based ratiometric approach for pulsed CEST-MRI pH imaging. J Magn Reson. 2018;287:1–9.
5. Jin T, Wang P, Hitchens TK, et al. Enhancing sensitivity of pH-weighted MRI with combination of amide and guanidyl CEST. NeuroImage. 2017;157:341–350.
6. McVicar N, Li AX, Gonçalves DF, et al. Quantitative Tissue Ph Measurement during Cerebral Ischemia Using Amine and Amide Concentration-Independent Detection (AACID) with MRI. J Cereb Blood Flow Metab. 2014;34:690–698.
7. Wang E, Wu Y, Cheung JS, et al. Mapping tissue pH in an experimental model of acute stroke – Determination of graded regional tissue pH changes with non-invasive quantitative amide proton transfer MRI. NeuroImage. 2019;191:610–617.
8. Harris RJ, Cloughesy TF, Liau LM, et al. pH-weighted molecular imaging of gliomas using amine chemical exchange saturation transfer MRI. Neuro-Oncol. 2015;17:1514–1524.
9. Goldenberg JM, Pagel MD. Assessments of tumor metabolism with CEST MRI. NMR Biomed.;32:e3943.
10. Zaiss M, Xu J, Goerke S, et al. Inverse Z-spectrum analysis for spillover-, MT-, and T1-corrected steady-state pulsed CEST-MRI – application to pH-weighted MRI of acute stroke. NMR Biomed. 2014;27:240–252.
11. Chen L, Barker PB, Weiss RG, et al. Creatine and phosphocreatine mapping of mouse skeletal muscle by a polynomial and Lorentzian line-shape fitting CEST method. Magn Reson Med. 2019;81:69–78.
12. Zaiss M, Windschuh J, Goerke S, et al. Downfield-NOE-suppressed amide-CEST-MRI at 7 Tesla provides a unique contrast in human glioblastoma. Magn Reson Med. 2017;77:196–208.
13. Schuenke P, Windschuh J, Roeloffs V, et al. Simultaneous Mapping of Water Shift and B1 (WASABI)—Application to Field-Inhomogeneity Correction of CEST MRI Data. Magn Reson Med. 2017;77:571–580.
14. Windschuh J, Zaiss M, Meissner J-E, et al. Correction of B1-inhomogeneities for relaxation-compensated CEST imaging at 7 T. NMR Biomed. 2015;28:529–537.
Figures