3127
Investigation of the reliability in pH quantification with MR chemical exchange saturation transfer (CEST) power ratiometric imaging at 3 Tesla1Paul C. Lauterbur Research Center for Biomedical Imaging, Shenzhen Institutes of Advanced Technology, Chinese Academy of Sciences, Shenzhen, China, 2United Imaging Healthcare America, Houston, TX, United States
Synopsis
Chemical exchange saturation transfer (CEST) using iodinated agents has been tested for extracellular pH imaging on high-field animal scanners. However, the reliability in the pH quantification on low magnetic strengths remains elucidated. In this study, CEST imaging was performed on iobitridol phantom twice with a three-day interval at 3T. pH was quantified by ratioing iobitridol CEST effects at 5.6 ppm under B1 of 1.0 and 2.0 μT. Results show accurate pH quantification in both scans. Good consistency of paired measures was observed between the two scans, suggesting the reliability of the method and its potential clinical applicability at 3T.
Introduction
Extracellular pH is an essential indicator of tissue pathological alterations and early response to treatment [1, 2]. Chemical exchange saturation transfer (CEST) using clinically approved exogeneous iodinated agents has been tested for pH imaging. However, most of the studies were conducted on high-field animal scanners [3, 4]. Although a recent study successfully mapped tumor pH on a cancer patient using ratiometric imaging of the two amide proton groups of iopamidol at 3 Tesla [5], a low saturation power had to be employed for better peak separation, which may lower CEST effects and degrade pH quantification accuracy. Therefore, it is necessary to investigate the reliability of CEST imaging in pH quantification at low magnetic fields before it is translated to clinical applications. In this study, an alternative contrast of iobitridol with single labile amide proton group was utilized, with pH quantified using the power ratiometric method [6]. The reproducibility of the method in the pH quantification was assessed in in vitro phantoms at 3 Tesla.Materials and methods
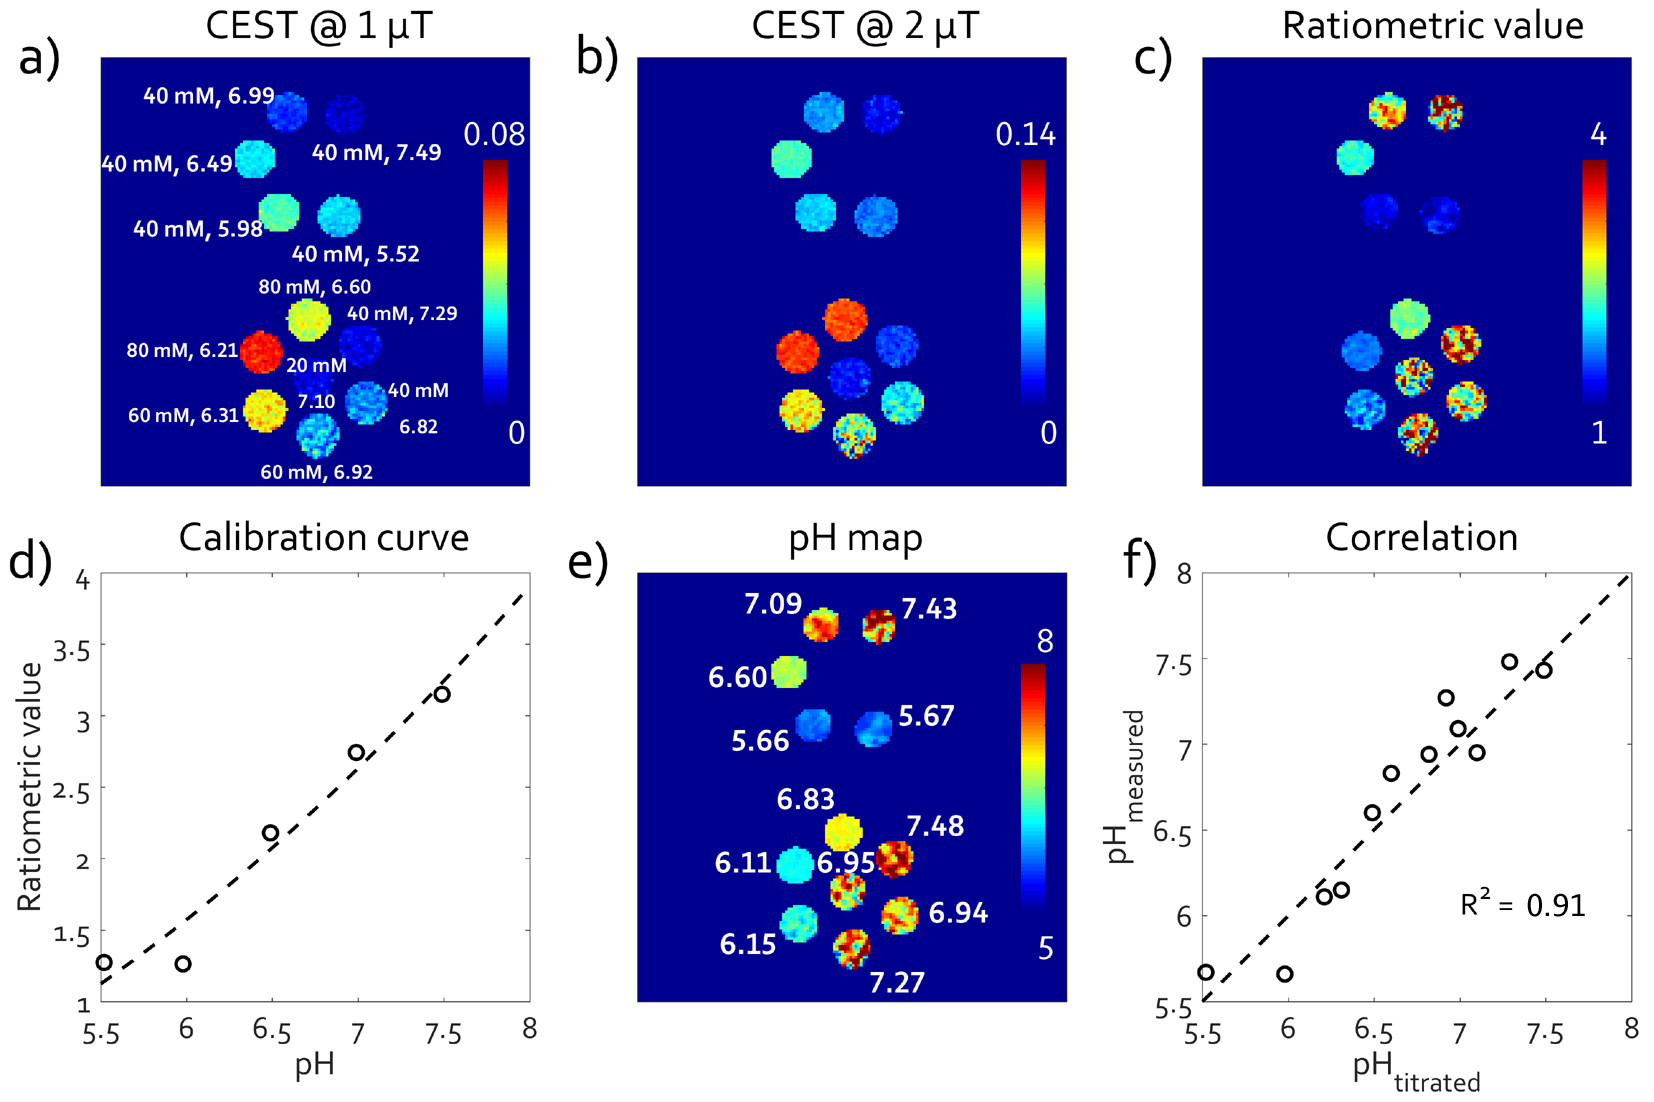
Phantom preparation: Iobitridol phosphate-buffered solutions (PBS) with varied pH and concentration were prepared as illustrated in Fig 1a and 2a and scanned under a temperature of approximately 30 °C. Specifically, five 40-mM iobitridol PBS solutions with pH titrated to 5.52, 5.98, 6.49, 6.99, and 7.49 were selected for pH calibration.MRI study: All images were acquired on a 3T MR scanner (uMR 790, Shanghai United Imaging Healthcare, Shanghai, China). A single slice was scanned with CEST MRI. The imaging parameters are as follows: TR/TE = 6000/39 ms, 30 saturation pulses with duration of 50 ms, duty cycle = 0.5, matrix size = 160×160, spatial resolution = 1.25×1.25×6 mm3. The WASSR map (frequency offsets between ±2 ppm with intervals of 0.1 ppm, saturation power of B1 = 0.5 μT) and four Z-spectra (frequency offsets between ± 7 ppm with intervals of 0.2 ppm) with B1 levels of 0.75, 1.0, 1.5 and 2.0 μT were collected, respectively. The B1 field map was obtained from a GRE sequence (TR/TE = 6000/3.6 ms, excitation flip angles of 45 ° and 90 °, respectively) using the double angle method (DAM) [7]. Identical scans were repeated 3 days later.
Data analysis: All images were processed in MATLAB. Z-spectra were normalized by the signal without RF irradiation, interpolated by smoothing splines, and corrected for B0 and B1 inhomogeneity based on the WASSR and B1 field maps [8-10]. The CEST effects at chemical shifts of 5.6 ppm were measured with asymmetric analysis CEST(5.6 ppm) = [M(-5.6 ppm)-M(5.6 ppm)]/M0. Power ratiometric measurement was defined as RST = CEST2.0 μT/CEST1.0 μT. In vitro pH calibration was obtained using a polynomial fitting of RST as a function of titrated pH, based on which absolute pH was calculated from the power ratiometric CEST effect per pixel. Linear regression and Bland-Altman plot were employed to evaluate the correlation and difference between paired measures obtained from the two scans.
Results and Discussion
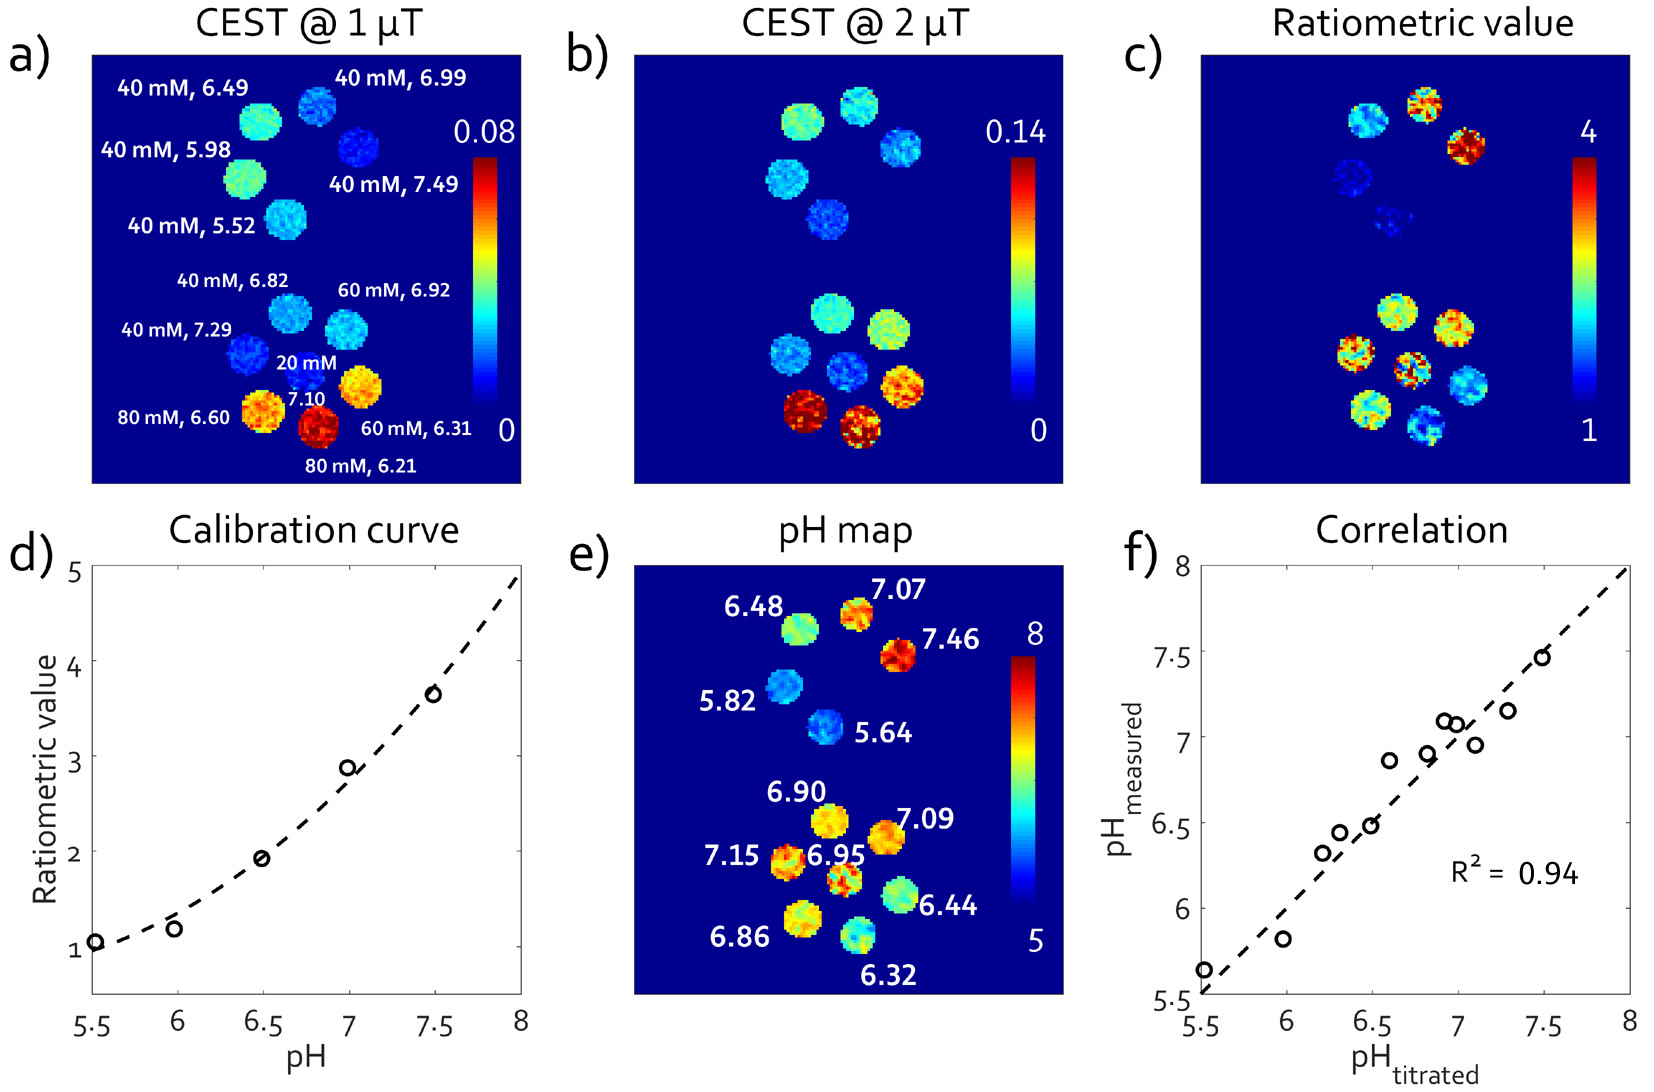
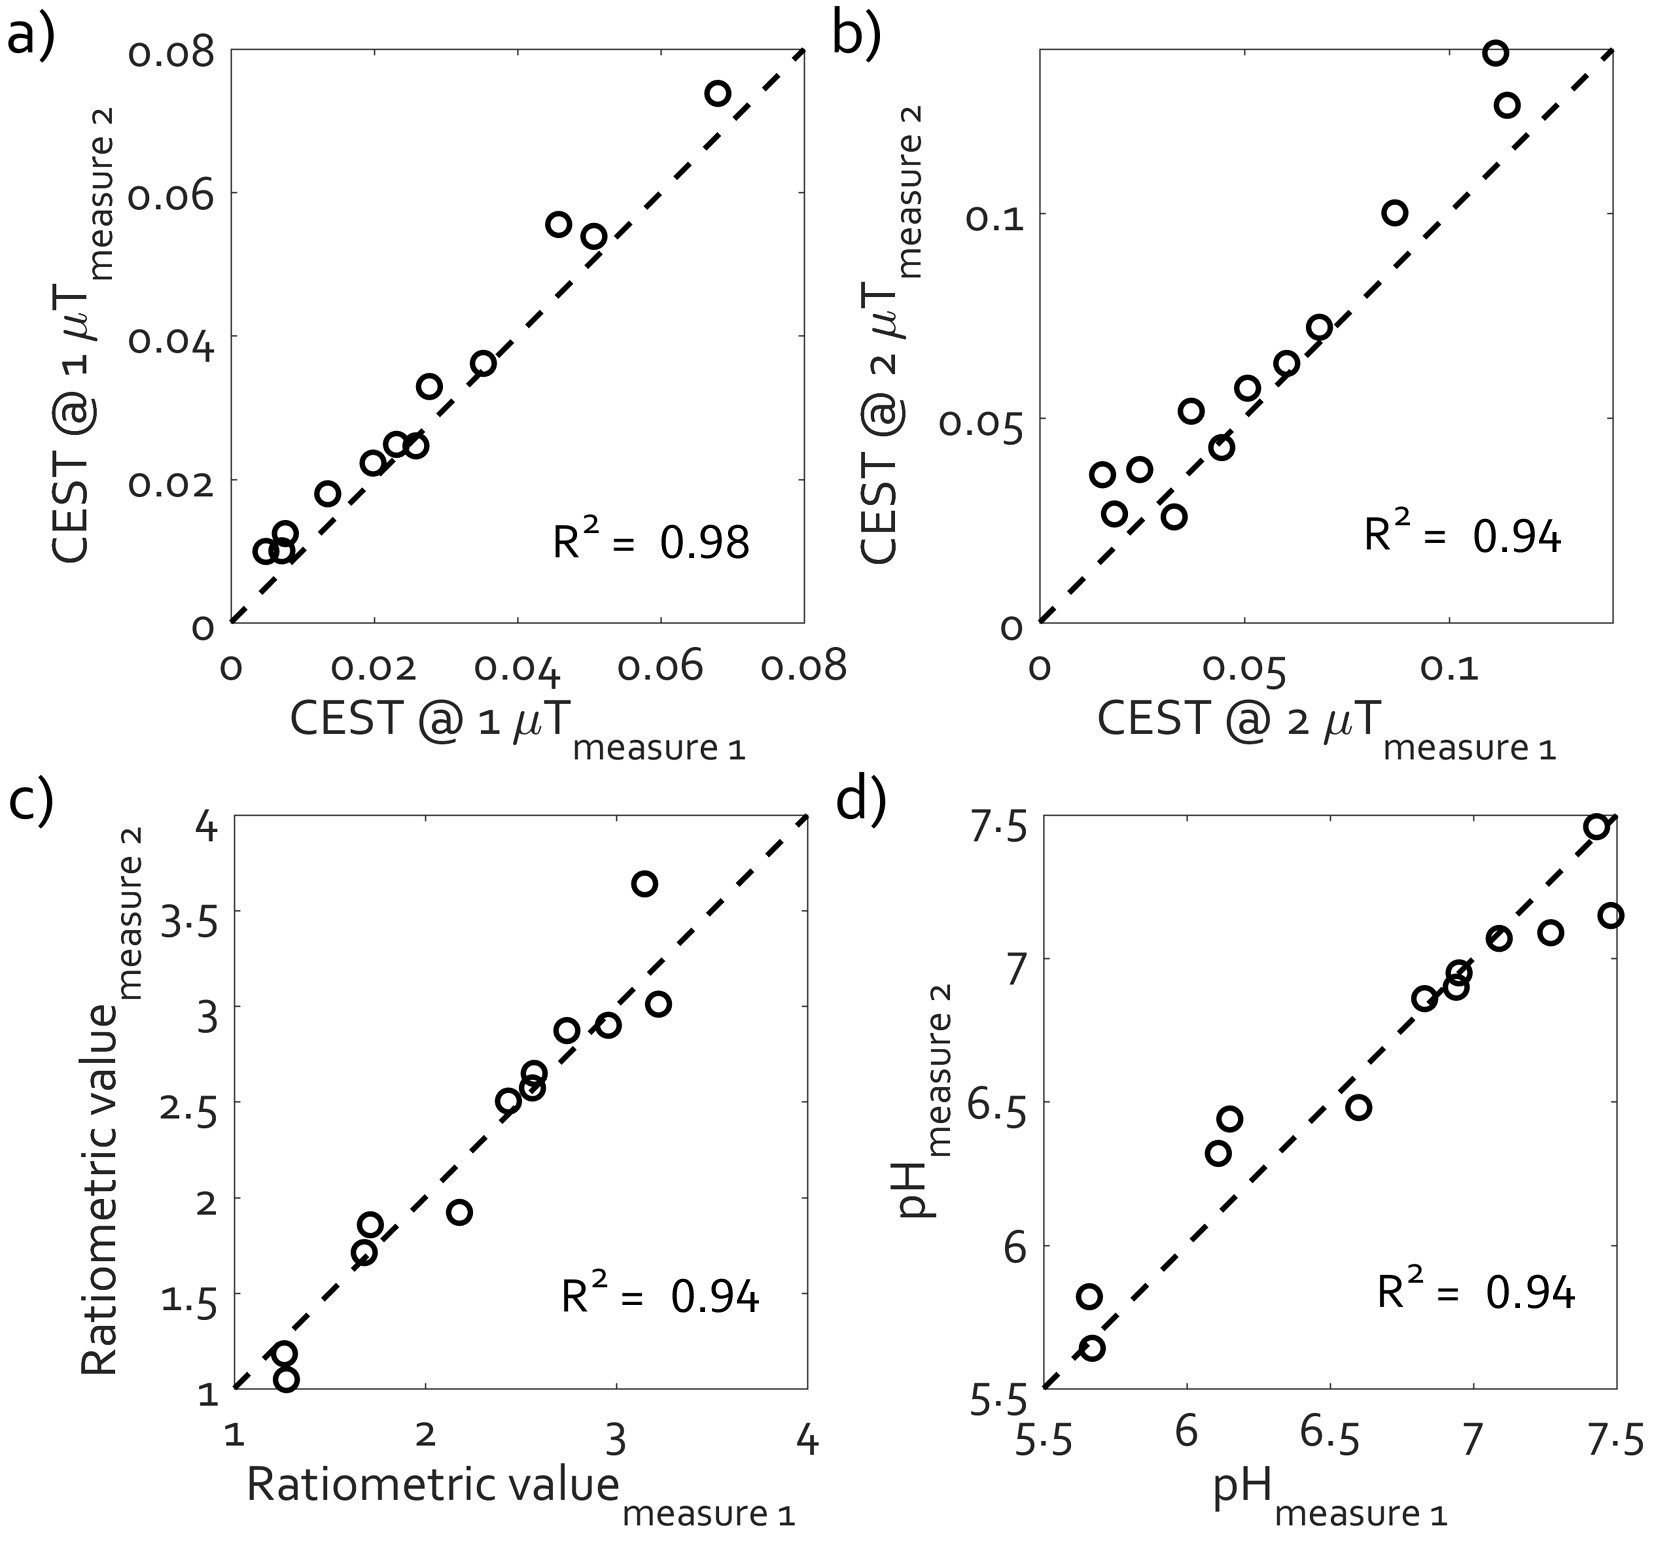
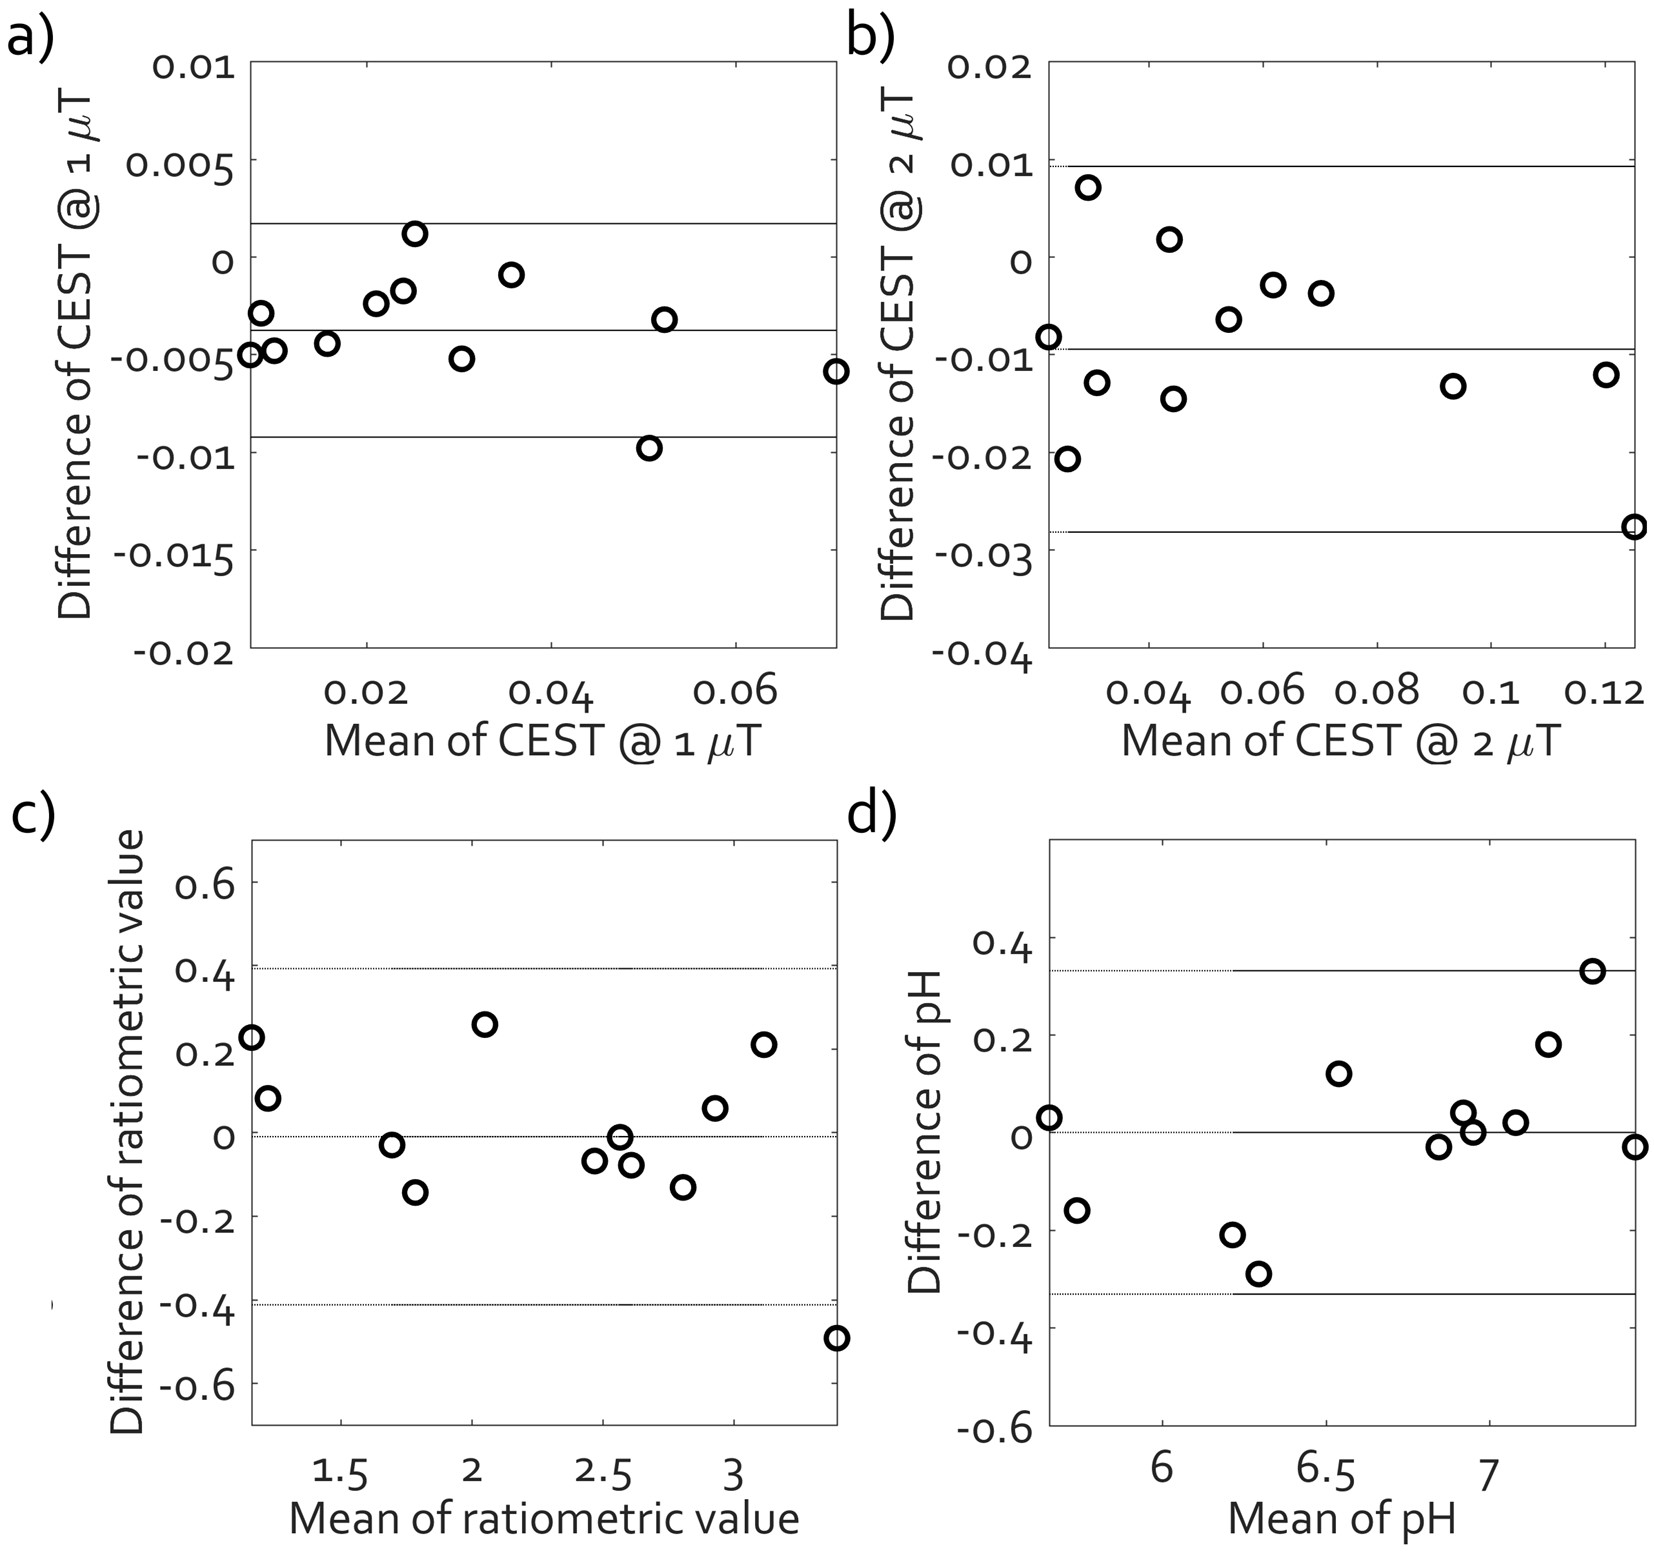
Figure 1a and 1b illustrate the CEST effects of iobitridol PBS phantom at 5.6 ppm under the saturation powers of 1.0 and 2.0 μT, respectively, obtained from the 1st scan. Ratioing them yielded the power ratiometric map (Fig. 1c). Figure 1d displays the calibration curve that shows a good pH response for pH from 5.5 to 7.5, from which pH map was calculated (Fig. 1e). The measured mean pH values were found to strongly correlate with pH-meter measurements (R2 >0.90, Figure 1f). Similar results were observed from the 2nd scan (Fig. 2). Figure 3 presents correlations of paired indices obtained from the two scans. Strong correlations were observed for iobitridol CEST effects under B1 of 1.0 and 2.0 μT, their ratiometric values and measured pH, respectively, with average correlation coefficients ≥ 0.94. Bland-Altman plots of the paired measures between the two scans are illustrated in Figure 4. The average difference was -0.004±0.003, -0.010±0.010, -0.010±0.205, 0±0.17 pH unit for iobitridol CEST effects under B1 of 1.0 and 2.0 μT, their ratiometric value and measured pH, respectively. The strong correlation and small average difference between paired measures of the two scans indicate the reliability of CEST power ratiometric imaging in pH quantification at 3 Tesla. Compared to agents with two labile proton groups with small chemical shift difference (e.g., iopamidol), the currently utilized iobitridol possesses single labile amide proton, which better caters to lower magnetic strengths (e.g., 3T) where chemical shift separation is challenging. Additionally, higher power may be employed to facilitate the detection of agents with low concentration. Note that the temperature varied slightly during imaging in this study, which may cause alteration of the CEST effect and affect pH quantification accuracy. Better temperature control will be designed in the future to further improve the reproducibility in pH quantification.Conclusion
In this study, the in vitro phantom results show accurate pH quantification with CEST power ratiometric imaging of iobitridol PBS solutions in both scans. Importantly, good reproducibility in the pH quantification was observed between the two scans, suggesting the method to be reliable for pH measurement and be promising in clinical translations.Acknowledgements
Grant Support: National Natural Science Foundation of China (81571668, 81871348 and 91859102), Guangdong Special Support Program (2016TQ03R272), and Shenzhen Science and Technology Program (JCYJ20170413161350892).References
[1] Gatenby RA, Gawlinski ET, Gmitro AF et al (2006) Acid mediated tumor invasion: a multidisciplinary study. Cancer Res 66:5216–5223.
[2] Akhenblit PA, Pagel MD (2016) Recent advances in targeting tumor energy metabolism with tumor acidosis as a biomarker of drug efficacy. J Cancer Sci Therapy 8:20–29.
[3] Chen L Q, Howison CM, Jeffery JJ, Robey IF, Kuo PH, Pagel MD, Evaluations of extracellular pH within in vivo tumors using acidoCEST MRI. Magn. Reson. Med. 2014, 72, 1408–1417.
[4] Randtke EA, Granados JC, Howison CM, Pagel MD, Cárdenas-Rodríguez J. Multislice CEST MRI improves the spatial assessment of tumor pH. Magn Reson Med. 2017 Jul;78(1):97-106.
[5] Jones KM, Randtke EA, Yoshimaru ES, Howison CM, Chalasani P, Klein RR, Chambers SK, Kuo PH, Pagel MD. Clinical Translation of Tumor Acidosis Measurements with AcidoCEST MRI. Mol Imaging Biol. 2017 Aug;19(4):617-625.
[6] Longo DL, Sun PZ, Consolino L, Michelotti FC, Uggeri F, Aime S. A general MRI-CEST ratiometric approach for pH imaging: demonstration of in vivo pH mapping with iobitridol. J Am Chem Soc. 2014 Oct 15;136(41):14333-6.
[7] Stollberger R, Wach P. Imaging of the active B1 field in vivo. Magn Reson Med 1996;35:246–251.
[8] Stancanello J, Terreno E, Castelli DD, Cabella C, Uggeri F, Aime S. Development and validation of a smoothing‐splines‐based correction method for improving the analysis of CEST‐MR images. Contrast Media Mol Imaging. 2008;3:136–149.
[9] Kim M, Gillen J, Landman BA, Zhou J, van Zijl PC. Water saturation shift referencing (WASSR) for chemical exchange saturation transfer (CEST) experiments. Magn Reson Med 2009;61:1441–1450.
[10] Anup Singh, Kejia Cai, Mohammad Haris, Hari Hariharan, and Ravinder Reddy. On B1 inhomogeneity correction of in vivo human brain glutamate chemical exchange saturation transfer contrast at 7T. Magn. Reson. Med. 2013, 69:818–824.
Figures