3126
Fast 2D EPI multislice imaging for full APT-CEST brain coverage1Neuroradiology, Goethe University Hospital, Frankfurt am Main, Germany, 2Brain Imaging Center (BIC), Frankfurt am Main, Germany, 3Goethe University Hospital, Frankfurt am Main, Germany
Synopsis
We present a fast 2D EPI multislice sequence that allows to acquire the APT-CEST contrast in 16 slices within 8 seconds. The fast CEST-EPI sequence was compared in vitro and in vivo with a steady-state CEST sequence, where the saturation is applied for 4 s for each frequency offset. The reduced acquisition time in the fast sequence can be used for measurement repetitions or additional MR examinations (e.g. MR spectroscopic imaging).
Introduction
The APT-CEST contrast has been shown to provide important information for diagnosis and monitoring of human brain tumors1,2,3. For most clinical applications, coverage of the entire tumor volume is required. Here, we present a 2D EPI multislice APT-CEST sequence, which allows acquiring 16 slices within 8 seconds for each frequency offset. The sequence was validated for different T1 in a phantom study and then applied in vivo, examining 10 patients with brain tumor. For additional metabolic information, 31P and 1H MR spectroscopic imaging was applied and registered with the APT-CEST contrast images, to explore physiological changes in tumor environment.Methods
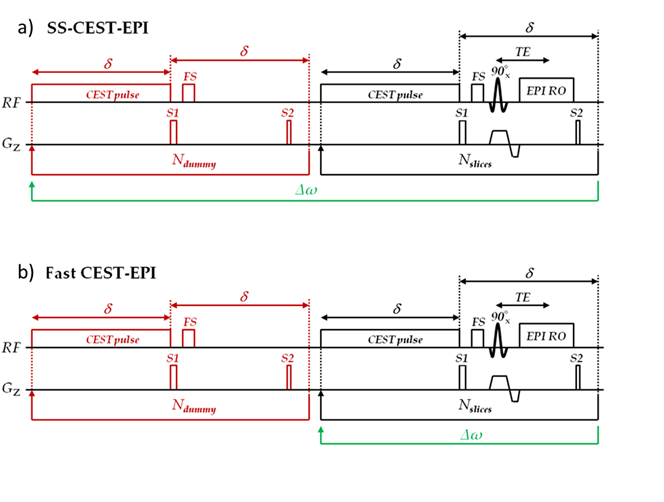
Data were acquired with a 3T whole-body MRI scanner (MAGNETOM Prisma, Siemens Healthineers, Erlangen, Germany). While spectroscopic data were acquired with a double tuned 1H/31P head coil, a 20 channel array head coil was used for APT-CEST imaging.The steady-state CEST-EPI (SS-CEST-EPI) sequence is shown in figure 1a. It contains a primary saturation module, consisting of a rectangular saturation pulse at a defined offset, followed by fat suppression (FS) and two spoiler gradients (S1, S2) for destroying the residual transversal magnetization. The steady-state, regarding the saturation transfer and direct water saturation, is achieved by repeating the module Ndummy times. The second module is an EPI readout of the longitudinal magnetization for a specific slice. This module is repeated for each slice until the total volume is covered. Steady-State conditions are maintained via a saturation pulse before EPI readout. Upon switching the frequency offset, the preparation module is applied again to achieve the new steady state before acquiring the image. For the proposed fast CEST EPI sequence (figure 1b) the primary module is applied only in the beginning, assuming a fast adaption of the steady state at the new frequency offset with only one saturation pulse.
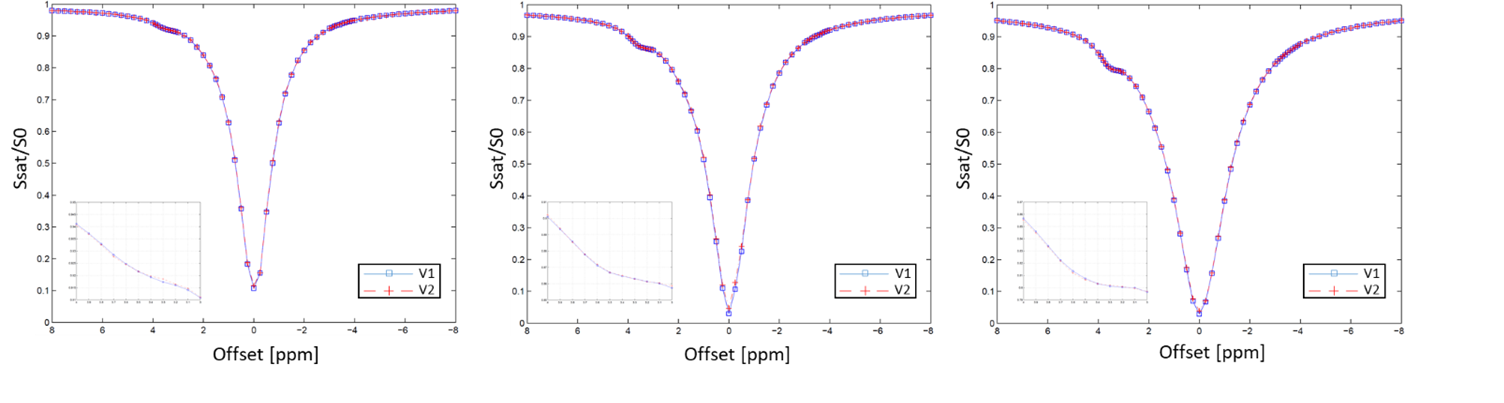
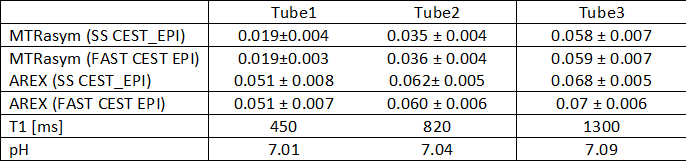
Both protocols were tested using a phantom with 3 tubes containing gelatin (for APT-CEST) in Phosphate Buffered Saline (PBS) at a pH-value of 7.0. Different T1 relaxation times (450 ms, 820 ms, 1300ms) were adjusted by the addition of contrast agent. As the pH might slightly change upon addition of contrast agent and during gelation, we used the shift of inorganic phosphate in 31P-MRS to control the final pH. The Z-spectra were scanned from -8 to +8 ppm with a step width of 0.25 ppm at an irradiation strength of B1=1µT and a pulse length of δ=250ms with Ndummy=8, covering a slab of 40 mm with 8 slices. Parametric maps for MTRasym4 and AREX5 were calculated.
Finally, APT-CEST contrasts were studied in 10 patients recording 16 slices covering 80 mm. Employing both presented CEST-EPI sequences, parametric images from the entire brain tumor were obtained and compared to pH-values obtained by 3D 31P-MRSI. In addition, we also collected 2D 1H-MRSI data (single slice at the level of the center of the tumor).
Results
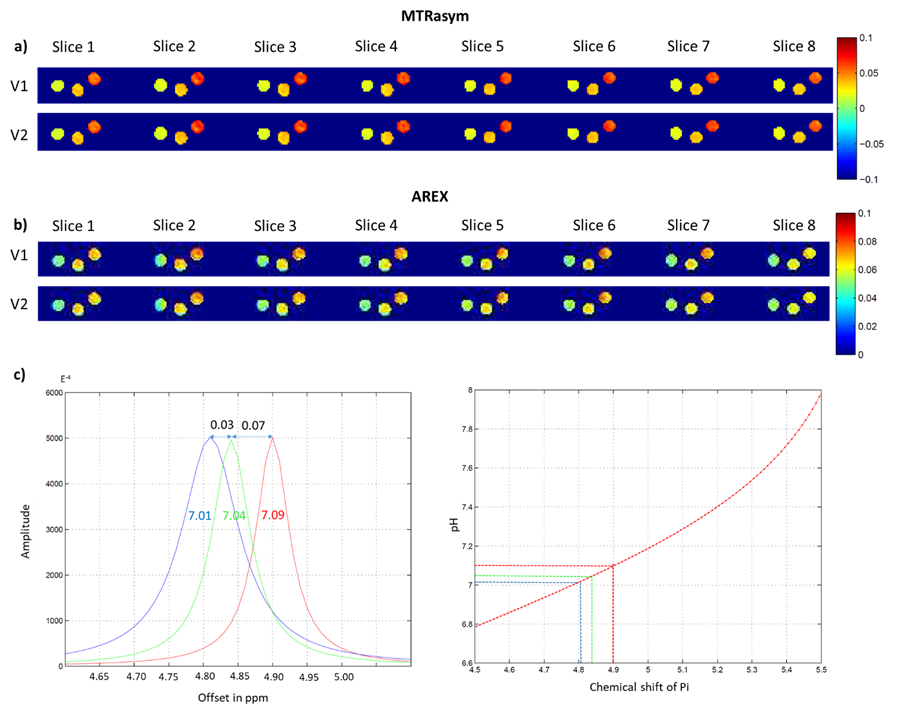
Figure 2 shows a ROI based B0 corrected Z-spectrum of the 3 tubes with different T1 relaxation times over all 8 slices. No differences between the SS-CEST EPI and the fast CEST-EPI data were found.Parametric maps for MTRasym and AREX across 8 slices are shown in figure 3. Both sequences lead to almost identical results. As expected, MTRasym reflects the differences in T1 relaxation time between the 3 tubes (ΔMTRasym≈0.04), whereas for the T1 compensated AREX contrast only slight differences were observed (ΔAREX≈0.02), which may be attributed to pH (Fig4).
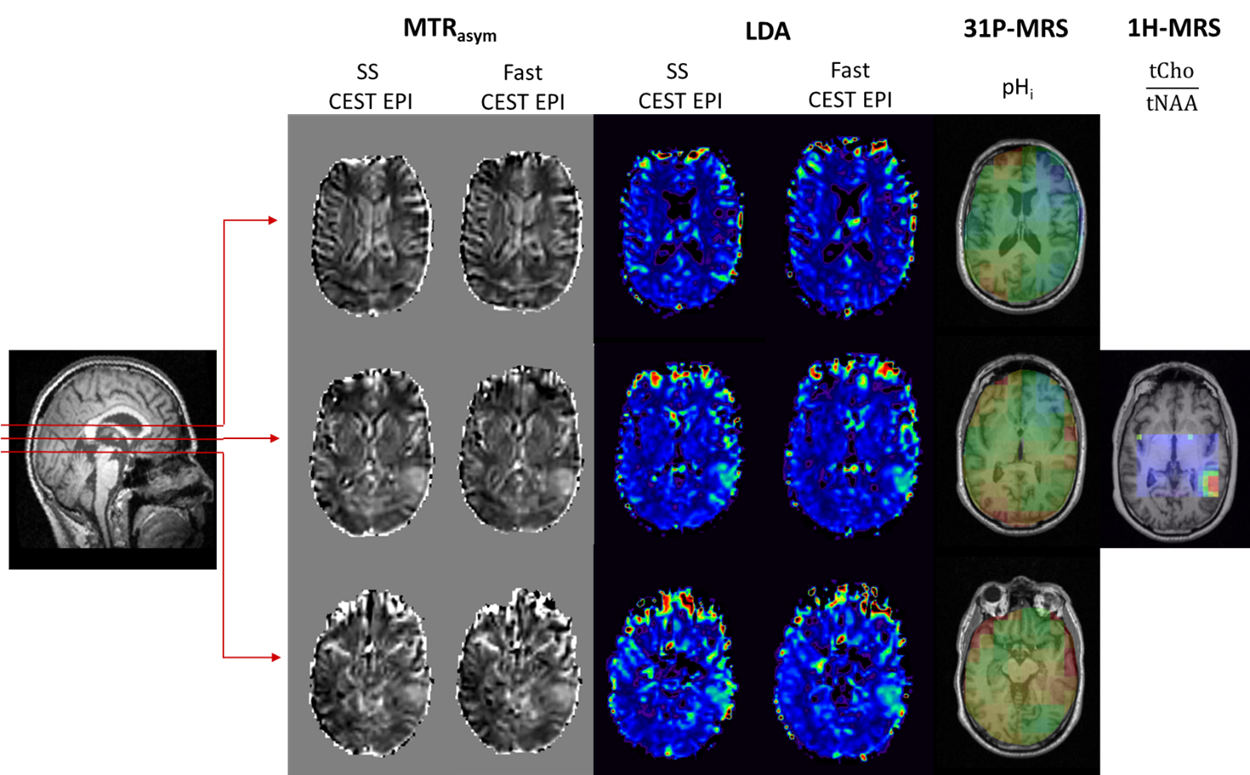
Figure 5 presents results from an examination of a tumor patient, applying the SS CEST-EPI and fast CEST-EPI sequences, as well as 31P-MRSI and 1H-MRSI. Both CEST datasets show a similar contrast with increased values in the center of the tumor in MTRasym and Lorentzian difference analysis (LDA6) at 3.5ppm. As expected for tumor tissue, 2D 1H-MRS shows an increased ratio between the signals of choline and NAA. The investigation by 31P-MRS enables a pH analysis of the whole tumor volume. Areas of increased pH partly correspond to hyperintense areas in MTRasym and LDA data.
Discussion
The in vitro results indicate that, in the acquisition scheme described in figure 1, one CEST preparation pulse is sufficient for establishing the new equilibrium after switching the frequency offset by less than 0.25 ppm. Furthermore, there seems to be no alterations at longer relaxation times (up to 1300 ms) for APT-CEST imaging, although the spin system is not fully relaxed (Fig.2). Both sequences were tested in vivo, acquiring APT-CEST data from a tumor patient with 2 measurement repetitions in the spectral range of the aliphatic and amide protons, leading to a total scan time of 14 min with fast CEST-EPI and 22min with SS CEST-EPI. Increased intracellular pH and APT-CEST contrasts appear to be not identical in all slices, indicating the effect of other parameters on the APT-CEST contrast. Data acquisition with fast CEST-EPI leaves sufficient time for acquiring MRSI data. This setup allows for a thorough examination of the tumor environment, exploring the physiological changes related to CEST contrast.Conclusion
The fast CEST-EPI sequence presented here allows for a rapid data acquisition. This enables additional time savings in clinical research for measurement repetitions and the acquisition of spectroscopic data.Acknowledgements
No acknowledgement found.References
1. Tanoue M. et al., Amide proton transfer imaging of glioblastoma, neuroblastoma, and breast cancer cells on a 11.7 T magnetic resonance imaging system, Magn Reson Imaging, (2019)
2. Kevin J. Ray et al., Tumor pH and Protein Concentration Contribute to the Signal of Amide Proton Transfer Magnetic Resonance Imaging, Cancer Research , (2019)
3. Paech D. et al., Relaxation-compensated amide proton transfer (APT) MRI signal intensity is associated with survival and progression in high-grade glioma patients, Eur Radiol. ,(2019)
4. Kogan F. et al. Chemical Exchange Saturation Transfer (CEST) imaging: Description of Technique and Potential Clinical Applications, Curr Radiol Rep.,(2013)
5. Zaiss et al., Relaxation-compensated CEST-MRI of the human brain at 7T: Unbiased insight into NOE and amide signal changes in human glioblastoma, Neuroimage,(2015)
6. Schüre et al., pH sensitivity pf APT-CEST using phosphorus spectroscopy as a reference method, NMR Biomed. ,(2019)
Figures