3125
In Vitro Characterization of Serotonin Biosynthesis Pathway by CEST MRI
Ryan T Oglesby1,2, Wilfred W Lam2, and Greg J Stanisz1,2
1Medical Biophysics, University of Toronto, Toronto, ON, Canada, 2Physical Sciences, Sunnybrook Research Institute, Toronto, ON, Canada
1Medical Biophysics, University of Toronto, Toronto, ON, Canada, 2Physical Sciences, Sunnybrook Research Institute, Toronto, ON, Canada
Synopsis
This study demonstrates the in vitro characterization of tryptophan, 5-HTP, serotonin (5-HT), 5-HIAA (all members of the serotonin biosynthesis pathway), and melatonin at precise pH, temperature, and concentration. At pH 5.5, CEST contrast between 0.6 and 1.9 ppm, originating from the NH3+ side chain, is exhibited by tryptophan, 5-HTP, and 5-HT. All five molecules at pH 7.4 exhibit CEST contrast between 5.11 and 5.47 ppm, originating from the NH proton on the indole ring. If sensitive enough in vivo, these measurements could improve the objectivity of clinically diagnosed psychiatric disorders and could provide a new biological understanding of serotonergic dysfunction.
Introduction
Serotonin (5-HT) receptor dysfunction has been implicated in numerous psychiatric disorders such as anxiety1, depression2, schizophrenia3, Alzheimer’s disease4, and autism5. Currently, the diagnosis of such psychiatric disorders is based on the phenomenological evaluation of symptoms and behavior by clinicians6. In this study, we evaluate the feasibility of using chemical exchange saturation transfer (CEST) MRI, a non-invasive tool, to quantify the metabolites involved in the serotonin biosynthesis and breakdown pathway (Fig. 1) with the goal of aiding the diagnostic assessment of psychiatric disorders. CEST is a contrast mechanism in which magnetization in compounds containing exchangeable protons is selectively saturated and detected indirectly through the bulk water signal with enhanced sensitivity7. If sufficiently sensitive in vivo, these measurements would be invaluable in psychiatric research and could lead to a new biological understanding of serotonergic dysfunction.Methods
Phantom Preparation: Phantoms of the following five metabolites (30 mM each) were prepared: tryptophan, 5-HTP, 5-HT, 5-HIAA, and melatonin. Separate phantoms were made at the following three pHs: 5.5 (intravesicular8), 6.7, and 7.4 (extracellular) for a total of 15 unique phantoms. Additionally, tryptophan was prepared and evaluated in eight pH environments ranging from 5.5 to 8.0. Each phantom was prepared in triplicate.MRI Acquisition and Data Analysis: The phantoms were scanned at 7 T (Ascend 300WB, Bruker BioSpin, Billerica, MA) using a temperature-controlled phantom holder9 stabilized at 37.0 ± 0.2 °C. All Z-spectra were acquired using a single slice, saturation transfer-prepared (CW block saturation pulse, tsat = 490 ms per line of k-space) FLASH sequence (TR = 500 ms; TE = 3 ms; FA = 30°; matrix = 64 × 64). CEST- and MT-sensitive Z-spectra were obtained using B1 = 0.30, 0.50, 0.75, 1.00, 1.50 µT and Δω spanning a ±7 ppm range in steps of 0.05 ppm. MT-sensitive spectra were obtained using B1 = 3 and 6 µT with Δω logarithmically spaced between ±3 ppm and ±300 ppm in 21 steps. A WAter Saturation Shift Referencing (WASSR)10 spectrum was obtained to correct for voxelwise B0 inhomogeneity and to measure the direct effect without CEST and MT contamination, using B1 = 0.1 µT with Δω between ± 0.5 ppm in 1/60 ppm steps. A T1 map was calculated from eleven inversion recovery-prepared RARE sequences (TR = 20,000 ms; TE = 6 ms; TI = 30 - 10,000 ms; RARE factor = 2) and a T2 map was calculated from a CPMG sequence (TR = 5000 ms; TE = 20 - 3600 ms, 180 echoes; FA = 90°). A B1 map was calculated from seven 3D FLASH (TR = 200 ms; TE = 4 ms; FA = 120° - 240°) sequences for inhomogeneity correction. Non-linear least squares fitting to three- and four-pool Bloch-McConnell11 models was done in MATLAB.
Results
The Z-spectra and MTRasym for each metabolite in their various pH environments are illustrated in Fig. 2. At pH 5.5 (Fig. 2a), tryptophan, 5-HTP, and 5-HT exhibit similar CEST effects with a measured resonance frequency offset between 2.63 and 2.71 ppm, albeit the MTRasym (Fig. 2 and 3) is the largest (20%) for 5-HT at approximately 2.50 ppm. At pH 6.7 (Fig. 2b), tryptophan, 5-HTP, 5-HT, and 5-HIAA Z-spectra are characterized by two peaks: one between 5.30 and 5.46 ppm with CEST asymmetry amplitude of 1.0–2.3% and another between 0.6 and 1.9 ppm with CEST asymmetry amplitude of 0.9–1.3%. At pH 7.4 (Fig. 2c), all five metabolites demonstrate similar CEST contrast with a measured resonance frequency offset between 5.11 and 5.47 ppm. Again, the 5-HT CEST asymmetry is the largest (9.5%) at 5.29 ppm. The estimated parameters from fitting the three-pool CEST/MT model is provided in Fig. 4. For tryptophan the exchange rates, RC1 and RC2, of the two peaks observed in each pH environment were evaluated individually to illustrate a linearly increasing relationship between RC and pH (Fig. 5).Discussion
At pH 5.5, tryptophan, 5-HTP, and 5-HT share similar CEST characteristics, while 5-HIAA and melatonin differ. Therefore, the origin of their CEST contrast between 2.63 and 2.71 ppm is likely the NH3+ group, which is common to tryptophan, 5-HTP, and 5-HT. The source of the CEST effect measured from 5-HIAA at pH 5.5 remains unexplained by our NH3+ hypothesis. At pH 7.4, each of the five metabolites share a common CEST peak between 5.11 and 5.47 ppm, implying their shared exchangeable proton (in the NH group) is the source. Translation of these in vitro results to in vivo studies will not be straightforward because in vivo serotonin concentration is orders of magnitude less than 30 mM. Furthermore, there will be competing metabolites (other breakdown products of serotonin) found in vivo which may contaminate the desired CEST signal with unwanted CEST and MT effects.Conclusions
This study has demonstrated the feasibility of in vitro detection and characterization of five molecules associated with the serotonin biosynthesis and breakdown pathway at precise pH, temperature, and metabolite concentration. At the intravesicular pH of 5.5, CEST contrast originating from the NH3+ side chain is exhibited by tryptophan, 5-HTP, and 5-HT (serotonin). Under extracellular pH conditions of 7.4, CEST contrast originating from the NH proton on the indole ring is exhibited by all five molecules.Acknowledgements
We thank the Canadian Institutes for Health Research (PJT156252) for financial support.References
- Stein MB, Andrews AM. Serotonin States and Social Anxiety. JAMA Psychiatry 2015;72:845.
- Yohn CN, Gergues MM, Samuels BA. The role of 5-HT receptors in depression. Mol Brain 2017;10:28.
- Selvaraj S, Arnone D, Cappai A, Howes O. Alterations in the serotonin system in schizophrenia: A systematic review and meta-analysis of postmortem and molecular imaging studies. Neurosci Biobehav Rev 2014;45:233–245.
- Geldenhuys WJ, Van der Schyf CJ. Role of Serotonin in Alzheimerʼs Disease. CNS Drugs 2011;25:765–781.
- Harrington RA, Lee L-C, Crum RM, Zimmerman AW, Hertz-Picciotto I. Serotonin Hypothesis of Autism: Implications for Selective Serotonin Reuptake Inhibitor Use during Pregnancy. Autism Res 2013;6:149–168.
- Kambeitz J, Cabral C, Sacchet MD, et al. Detecting Neuroimaging Biomarkers for Depression: A Meta-analysis of Multivariate Pattern Recognition Studies. Biol Psychiatry 2017;82:330–338.
- van Zijl PCM, Yadav NN. Chemical exchange saturation transfer (CEST): What is in a name and what isn’t? Magn Reson Med 2011;65:927–948.
- Blackmore CG, Varro A, Dimaline R, Bishop L, Gallacher D V., Dockray GJ. Measurement of secretory vesicle pH reveals intravesicular alkalinization by vesicular monoamine transporter type 2 resulting in inhibition of prohormone cleavage. J Physiol 2001;531:605–617.
- Oglesby RT, Lam WW, Stanisz GJ. An Investigation into the Origins of an MRI Artifact Induced by Increasing Temperature. In: Proceedings of the 27th Annual Meeting of ISMRM. Montreal, Canada; 2019. p. Digital Poster #4618.
- Kim M, Gillen J, Landman BA, Zhou J, van Zijl PCM. Water saturation shift referencing (WASSR) for chemical exchange saturation transfer (CEST) experiments. Magn Reson Med 2009;61:1441–1450.
- McConnell HM. Reaction Rates by Nuclear Magnetic Resonance. J Chem Phys 1958;28:430–431.
Figures
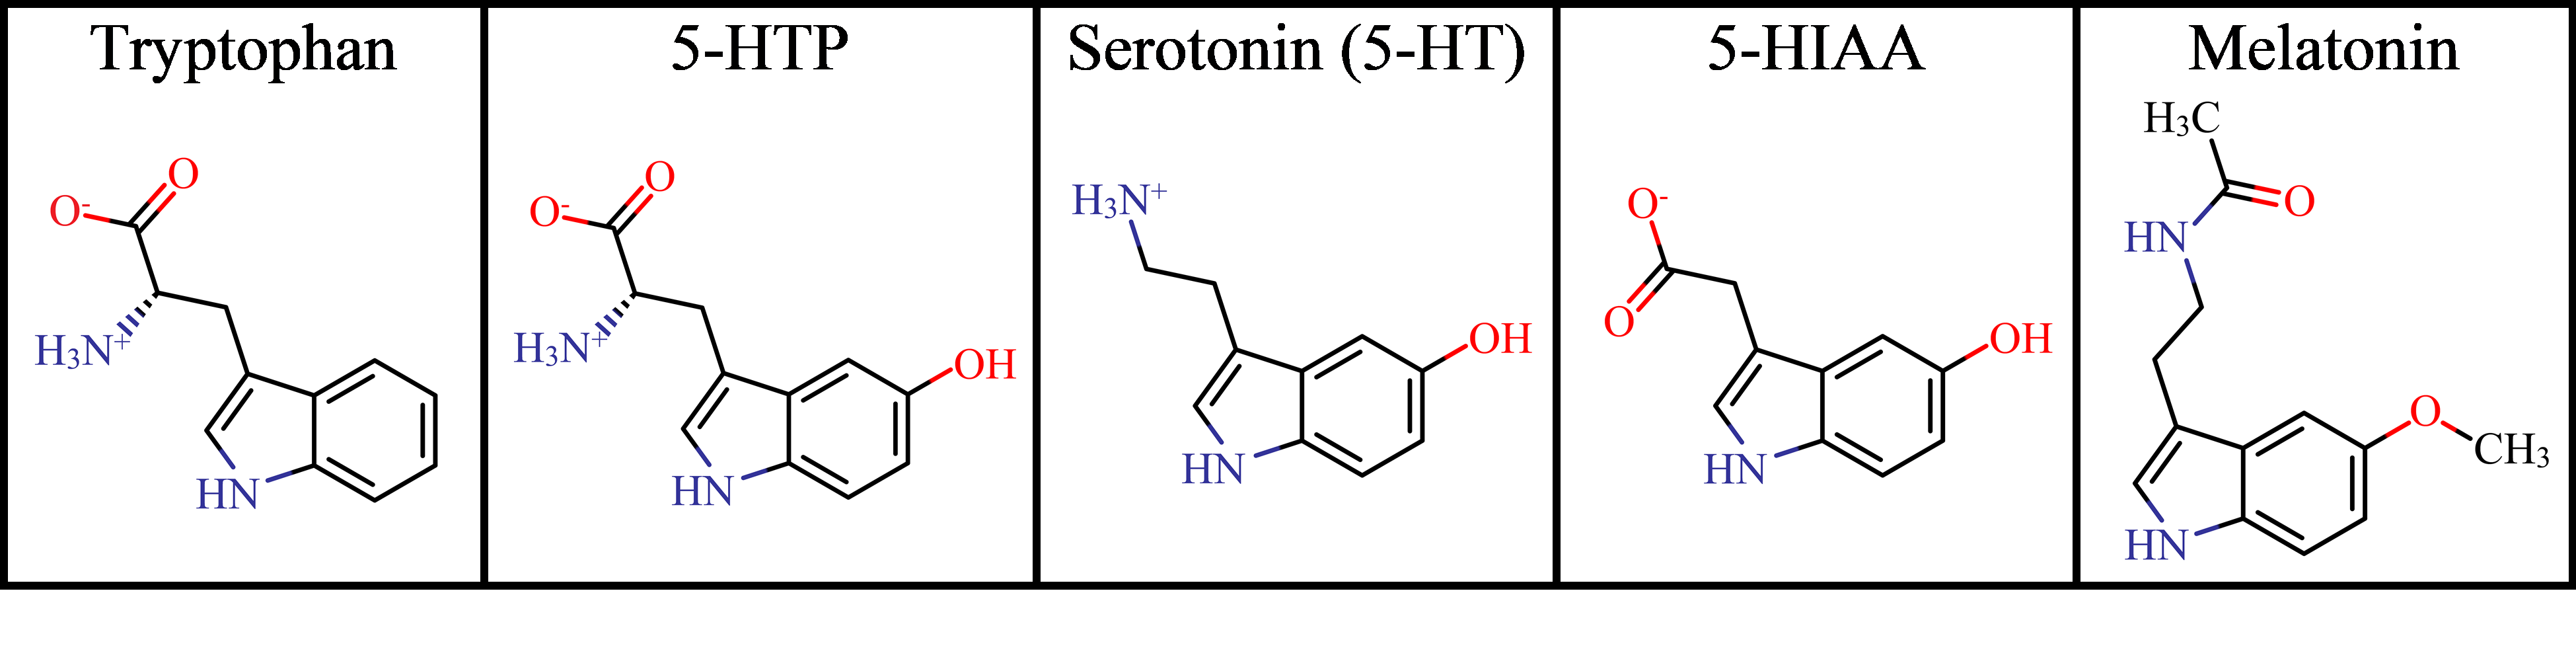
Relevant compounds involved in the synthesis and
breakdown of serotonin, excluding the catalytic enzymes and cofactors. Dominant
protonation states (> 93.8%) in the pH range 5.5 – 7.4 were illustrated
using MarvinSketch (ChemAxon, San Diego, CA).
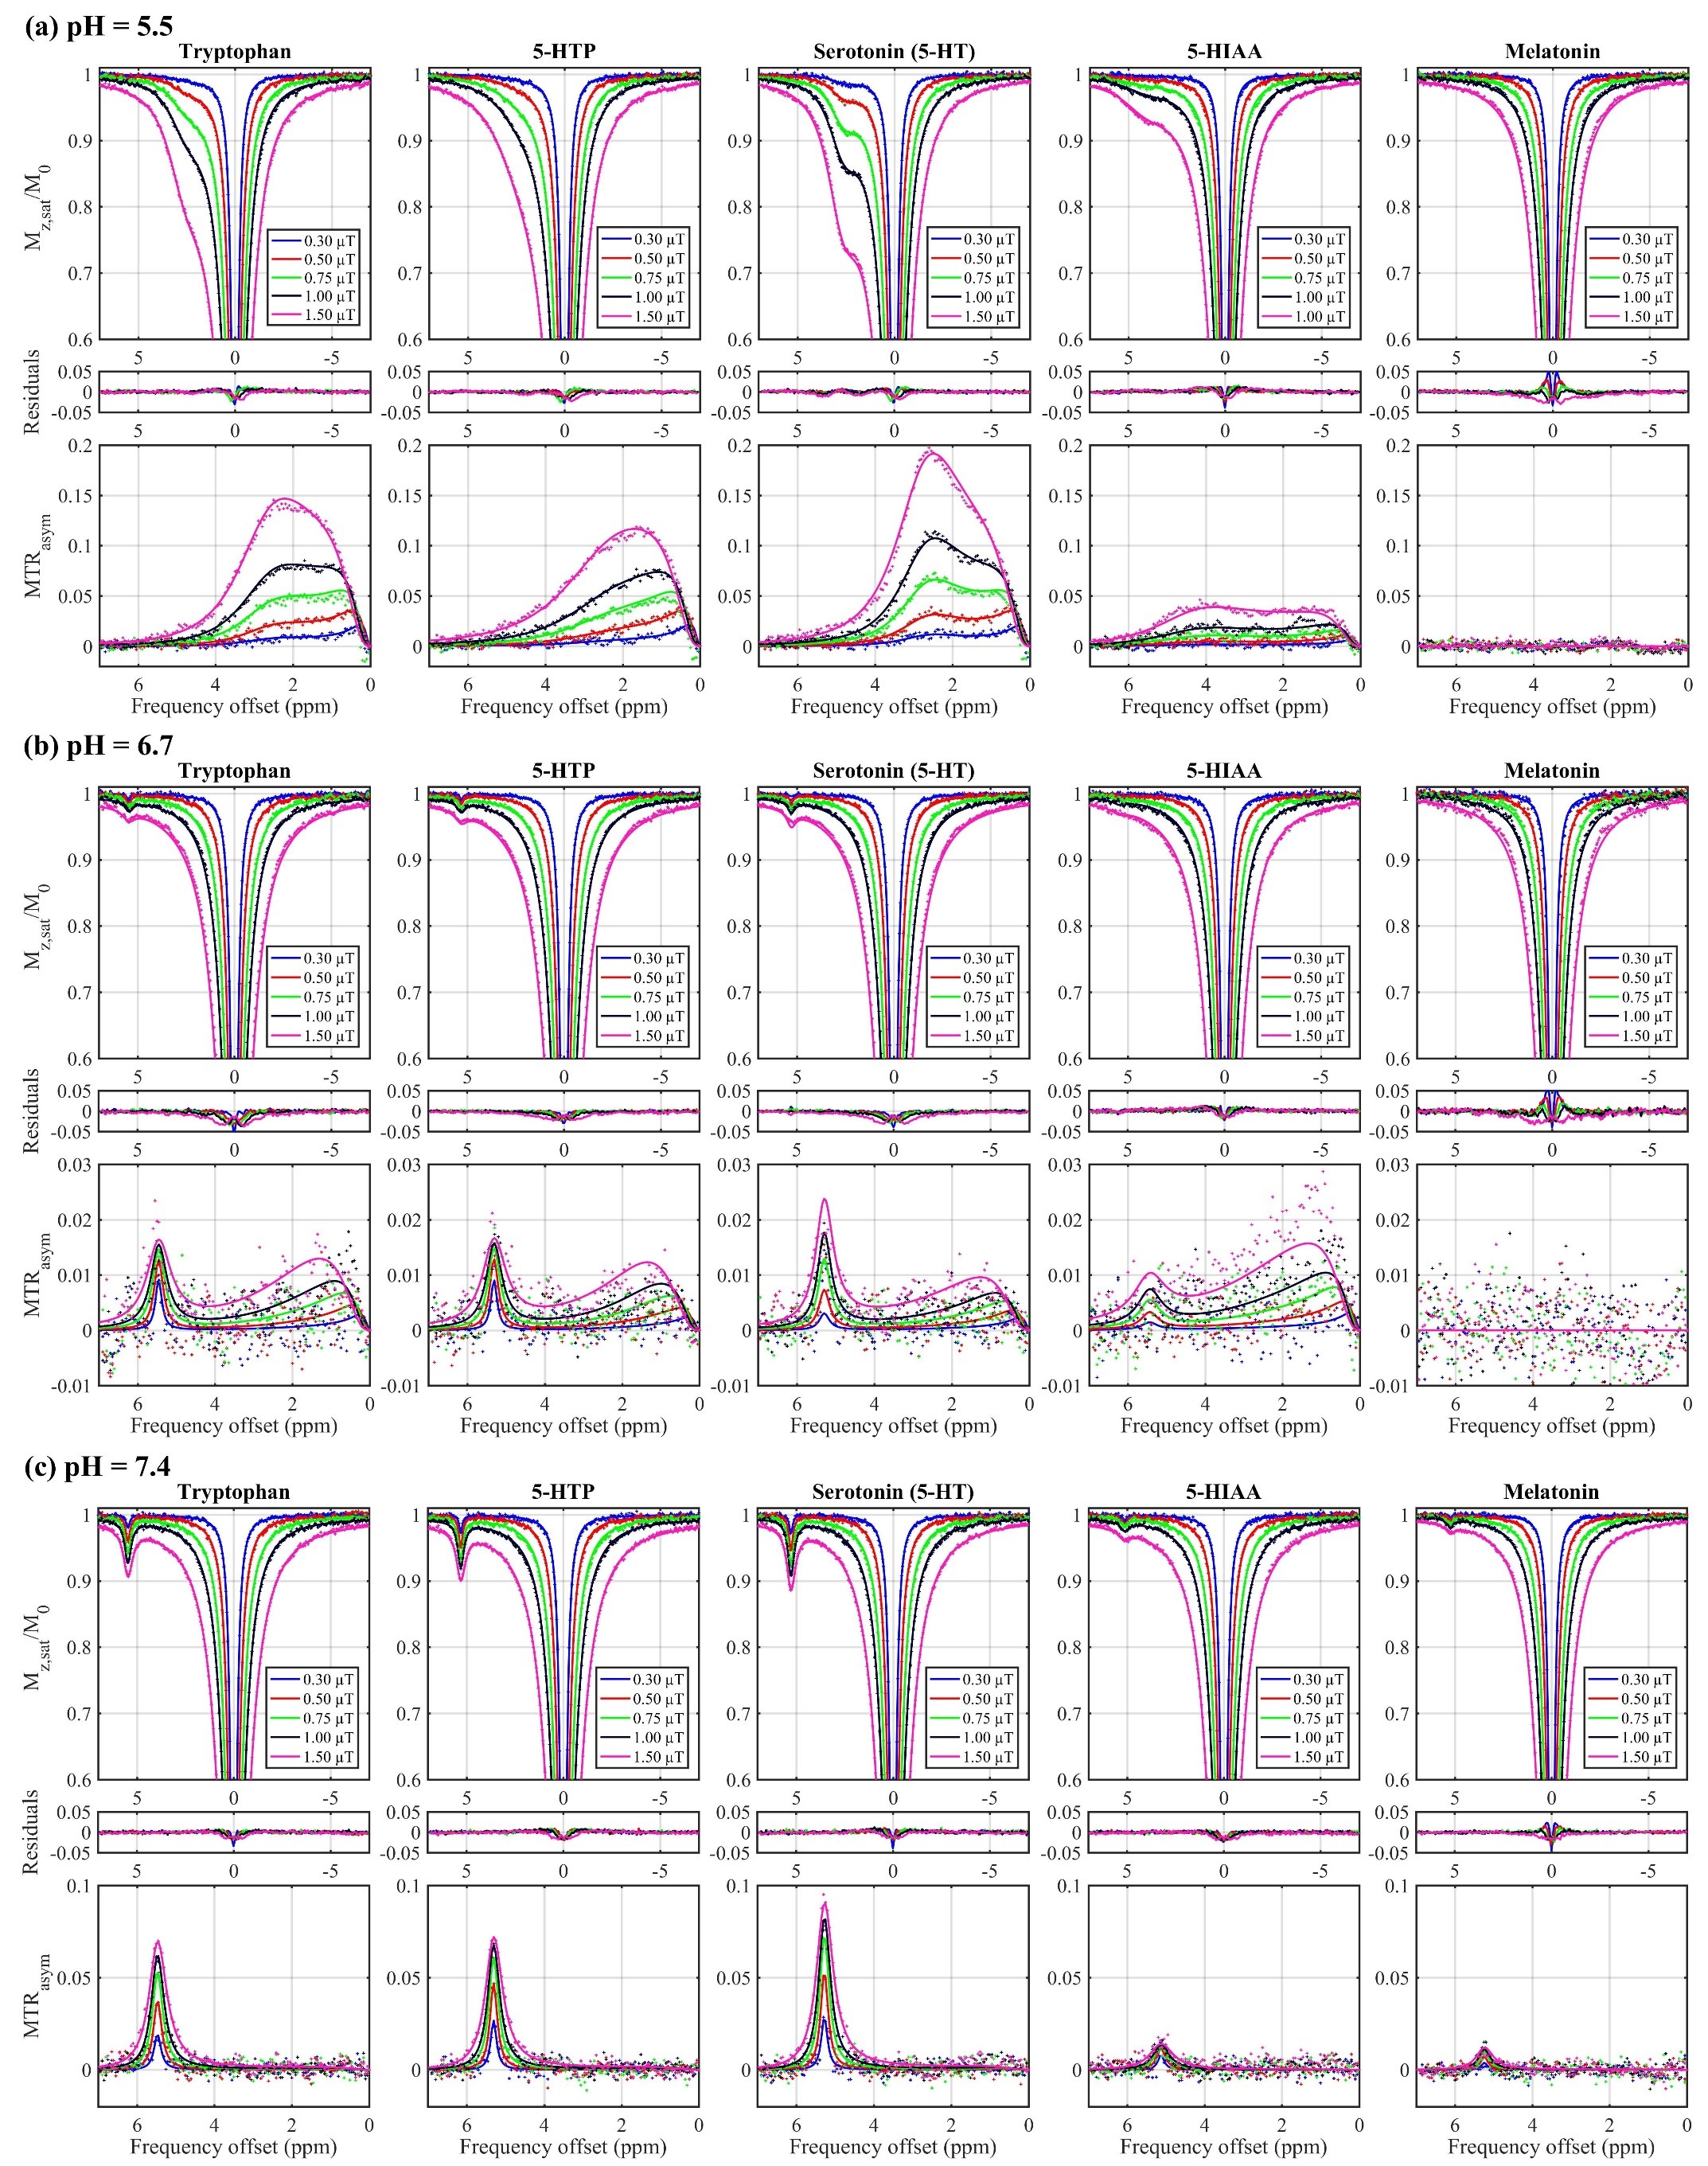
Z-spectra and MTRasym for Tryptophan,
5-HTP, Serotonin (5-HT), 5-HIAA, and Melatonin at pH (a) 5.5, (b) 6.7, and (c)
7.4. Points are measured data and lines are fit results.
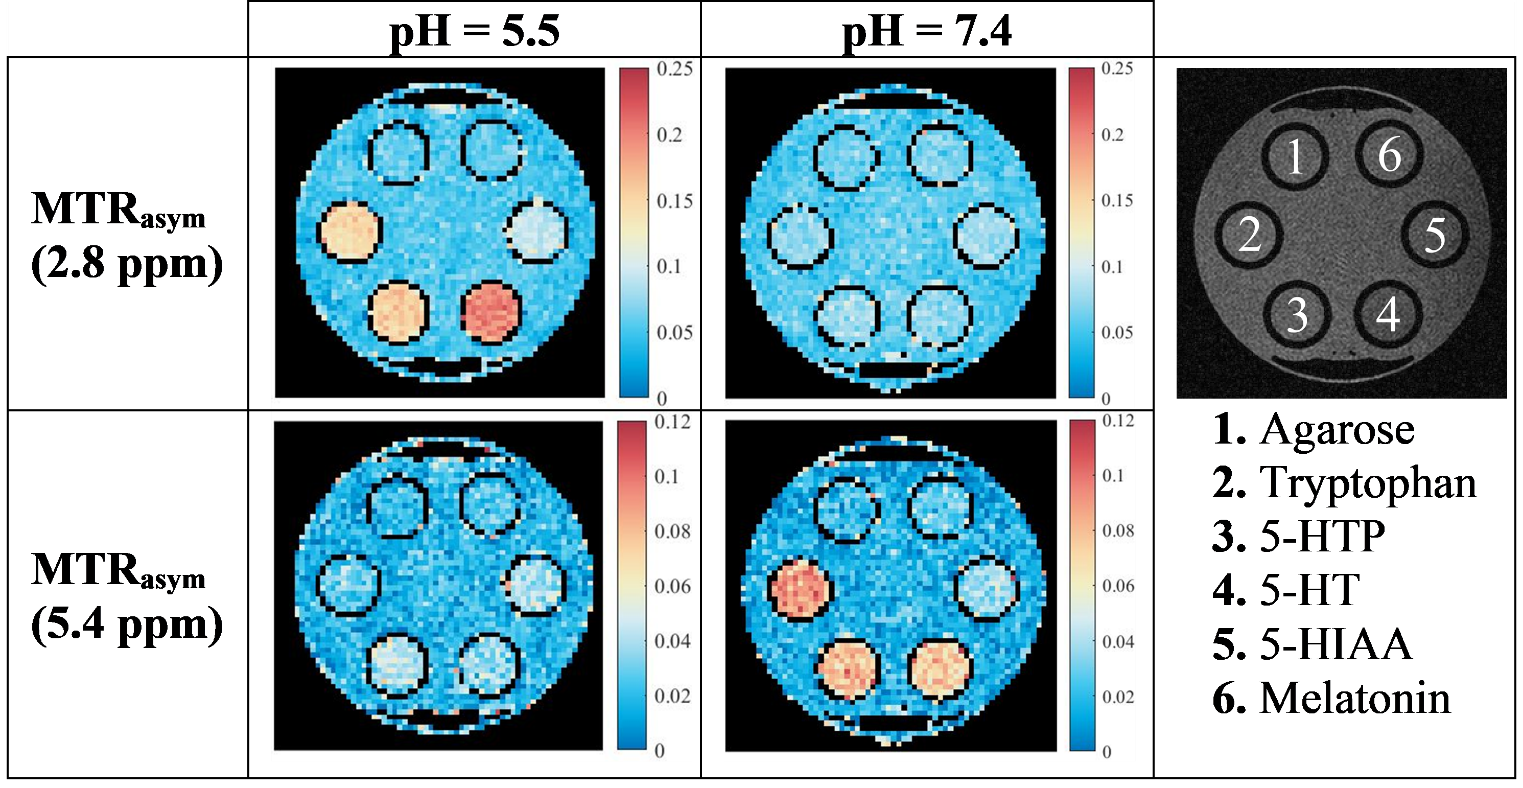
Magnetization
transfer ratio asymmetry (MTRasym) maps at 2.8 and 5.4 ppm for each
of the five metabolites in two biologically relevant pH environments. These
maps can be used to identify the samples with the highest CEST contrast at one
particular resonance frequency offset Δω0C.
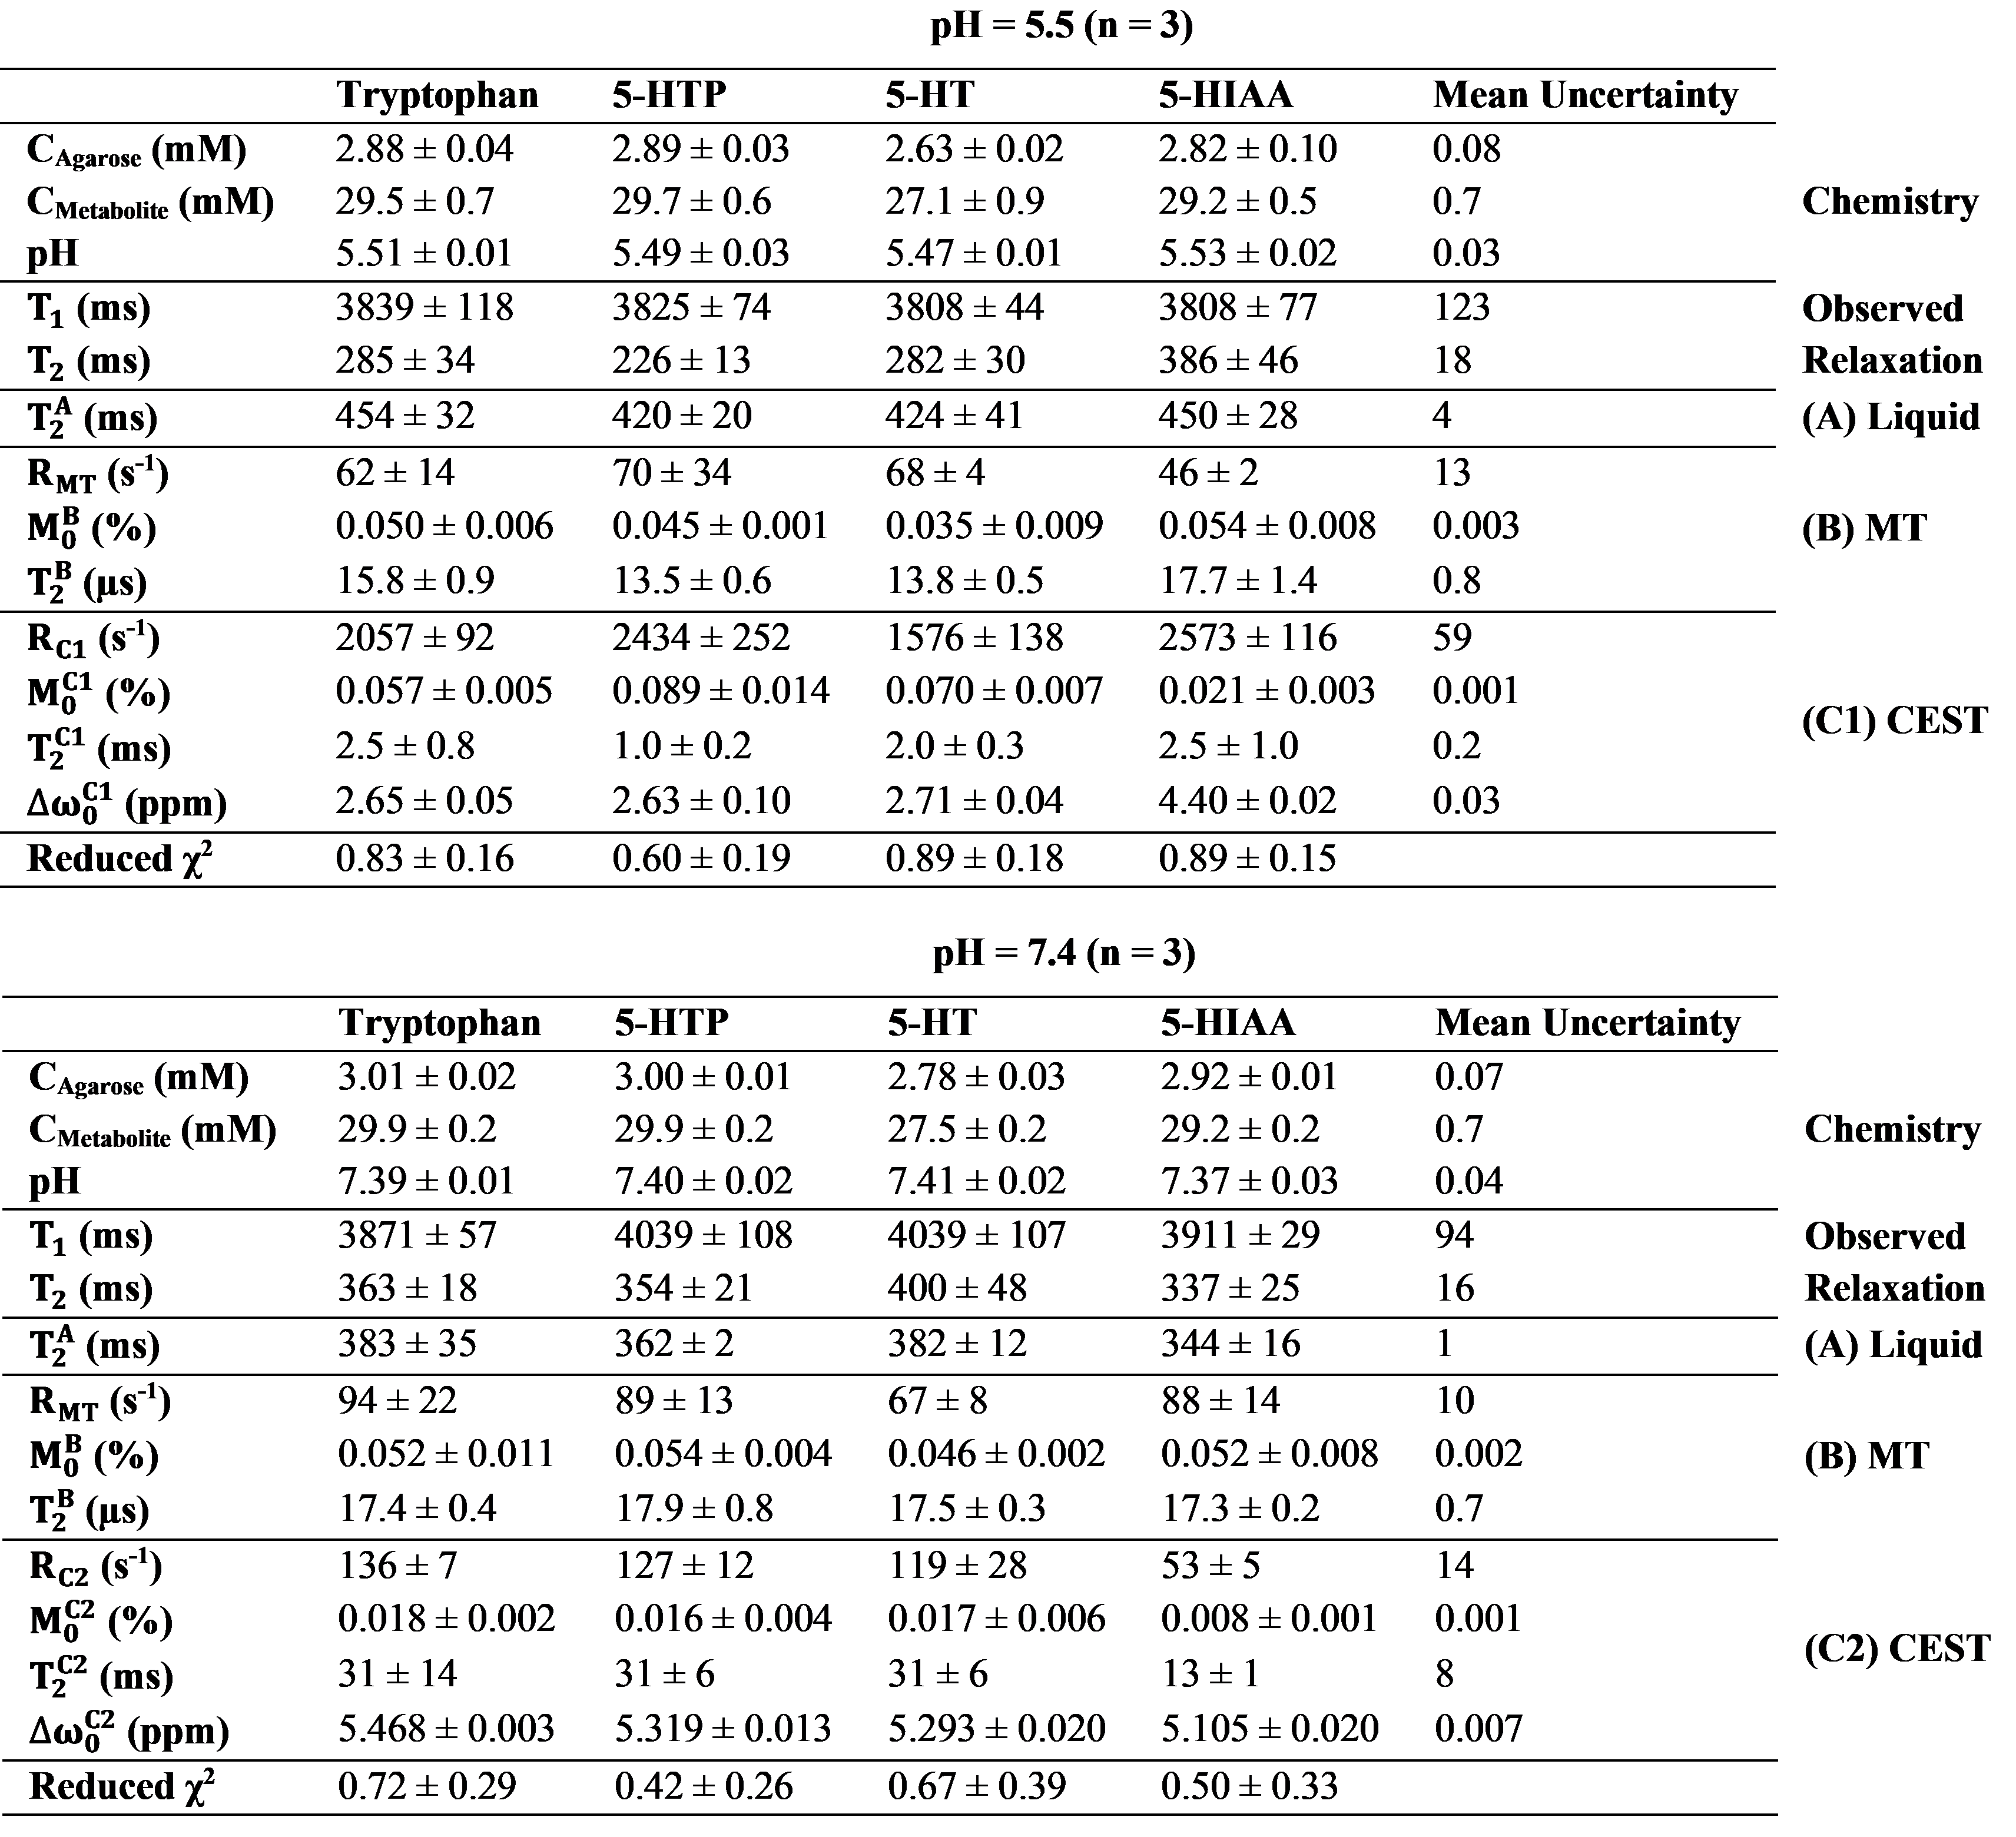
Estimated parameters
from the three-pool Bloch-McConnell model. Each parameter is stated as mean ±
standard deviation of the measurements of the phantoms made in triplicate and
the mean uncertainties represent the average fitting error for each parameter excluding
outliers. Melatonin and four-pool model estimates (of the pH 6.7 phantoms) are
not shown due to insufficiently high contrast-to-noise ratio.
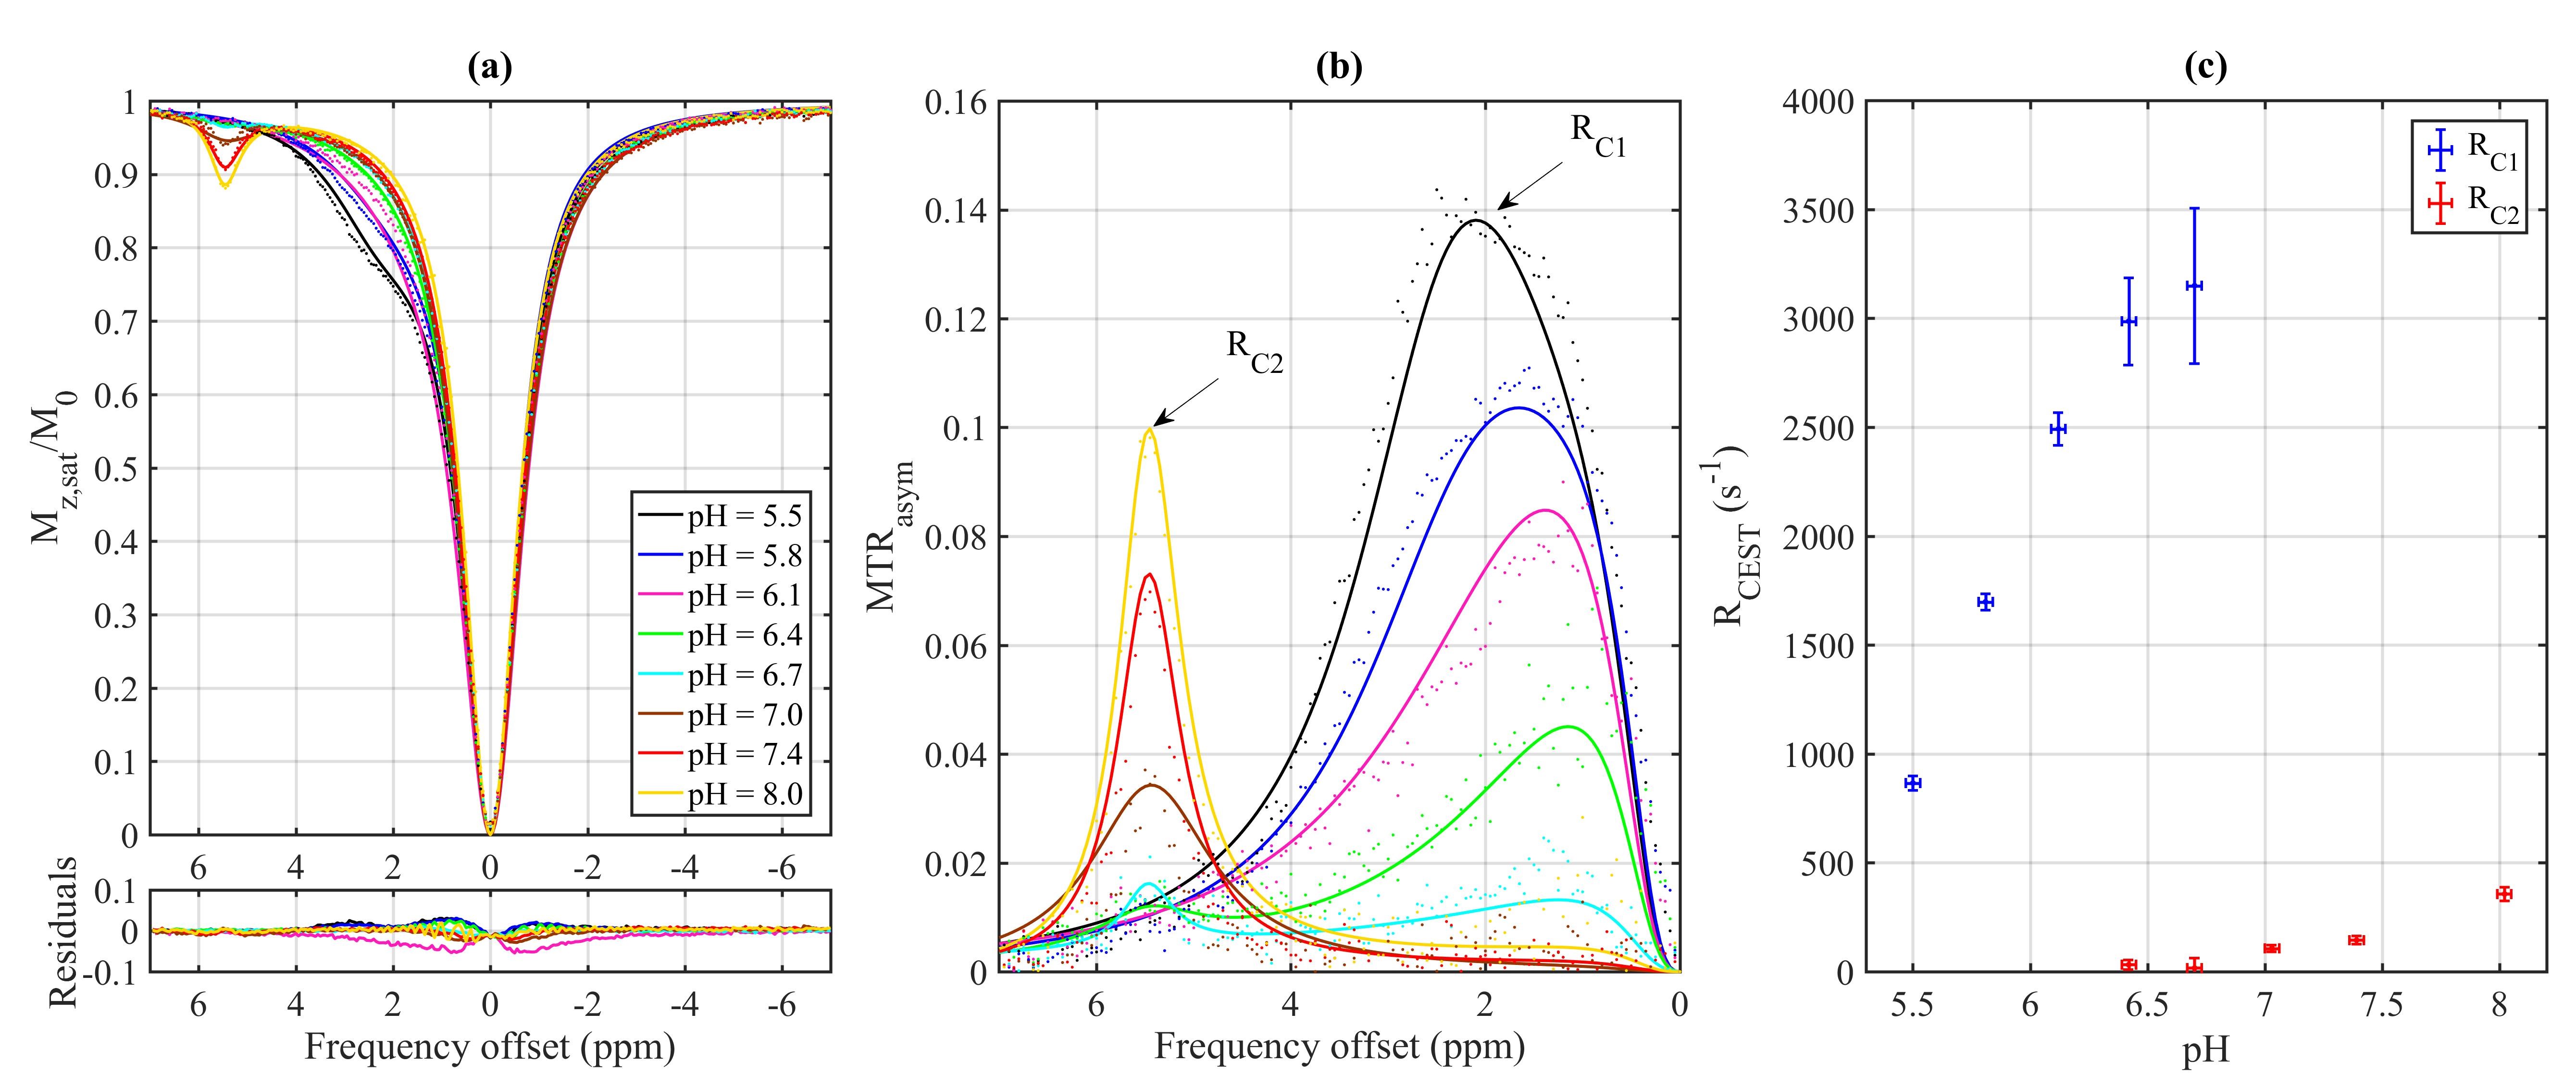
(a) Z-spectra and (b)
MTRasym for tryptophan prepared under pH environments ranging from
5.5 to 8.0. (c) Exchange rate (RCEST) as a function of pH for each
of the two peaks (C1 and C2) from fitting the four-pool model. Points are
measured data and lines are fit results.