3124
The perfusion contributing significantly to the CEST signal acquired by a UTE-CEST sequence1School of Biomedical Engineering, Southern Medical University, Guangzhou, China, 2Philips healthcare, Guangzhou, China
Synopsis
Chemical exchange saturation transfer (CEST) as a novel molecule MRI technique, was approved to detect some diseases, like tumor grading, kidney injure, osteoarthritis (OA) and etc. However, it is crucial to purify the CEST signal. In this study, we explored the perfusion contribution to the CEST signal acquired by a UTE-CEST sequence.
Synopsis
Chemical exchange saturation transfer (CEST) as a novel molecule MRI technique, was approved to detect some diseases, like tumor grading[1], kidney injure[2], osteoarthritis (OA) and etc. However, it is crucial to purify the CEST signal. In this study, we explored the perfusion contribution to the CEST signal acquired by a UTE-CEST sequence.Introduction
The quantification and separation of the CEST signal accurately is important for developing imaging metrics for various diseases diagnosis and grading, however, the ASL technique was quite similar to the CEST method in the pulse sequence and image post-processing. Both methods in ASL and CEST applied an pre-pulse to label and saturation, and in the image processing, the difference between the labeled (saturated) and unlabeled (unsaturated) image was applied to obtain perfusion and labile protons information for ASL and CEST respectively. Thus, the CEST signal may contain perfusion signal, especially in the region where the blood supply is abundant. Although Feliks Kogan’s result have showed that the perfusion has no effect on the in vivo CEST effect from Cr (CrCEST) in skeletal muscles[3], however muscles have slow blood flow. Here, we conduct the experiments in vitro and in rat kidney, demonstrating the perfusion effect maybe pollute the CEST signal.Method
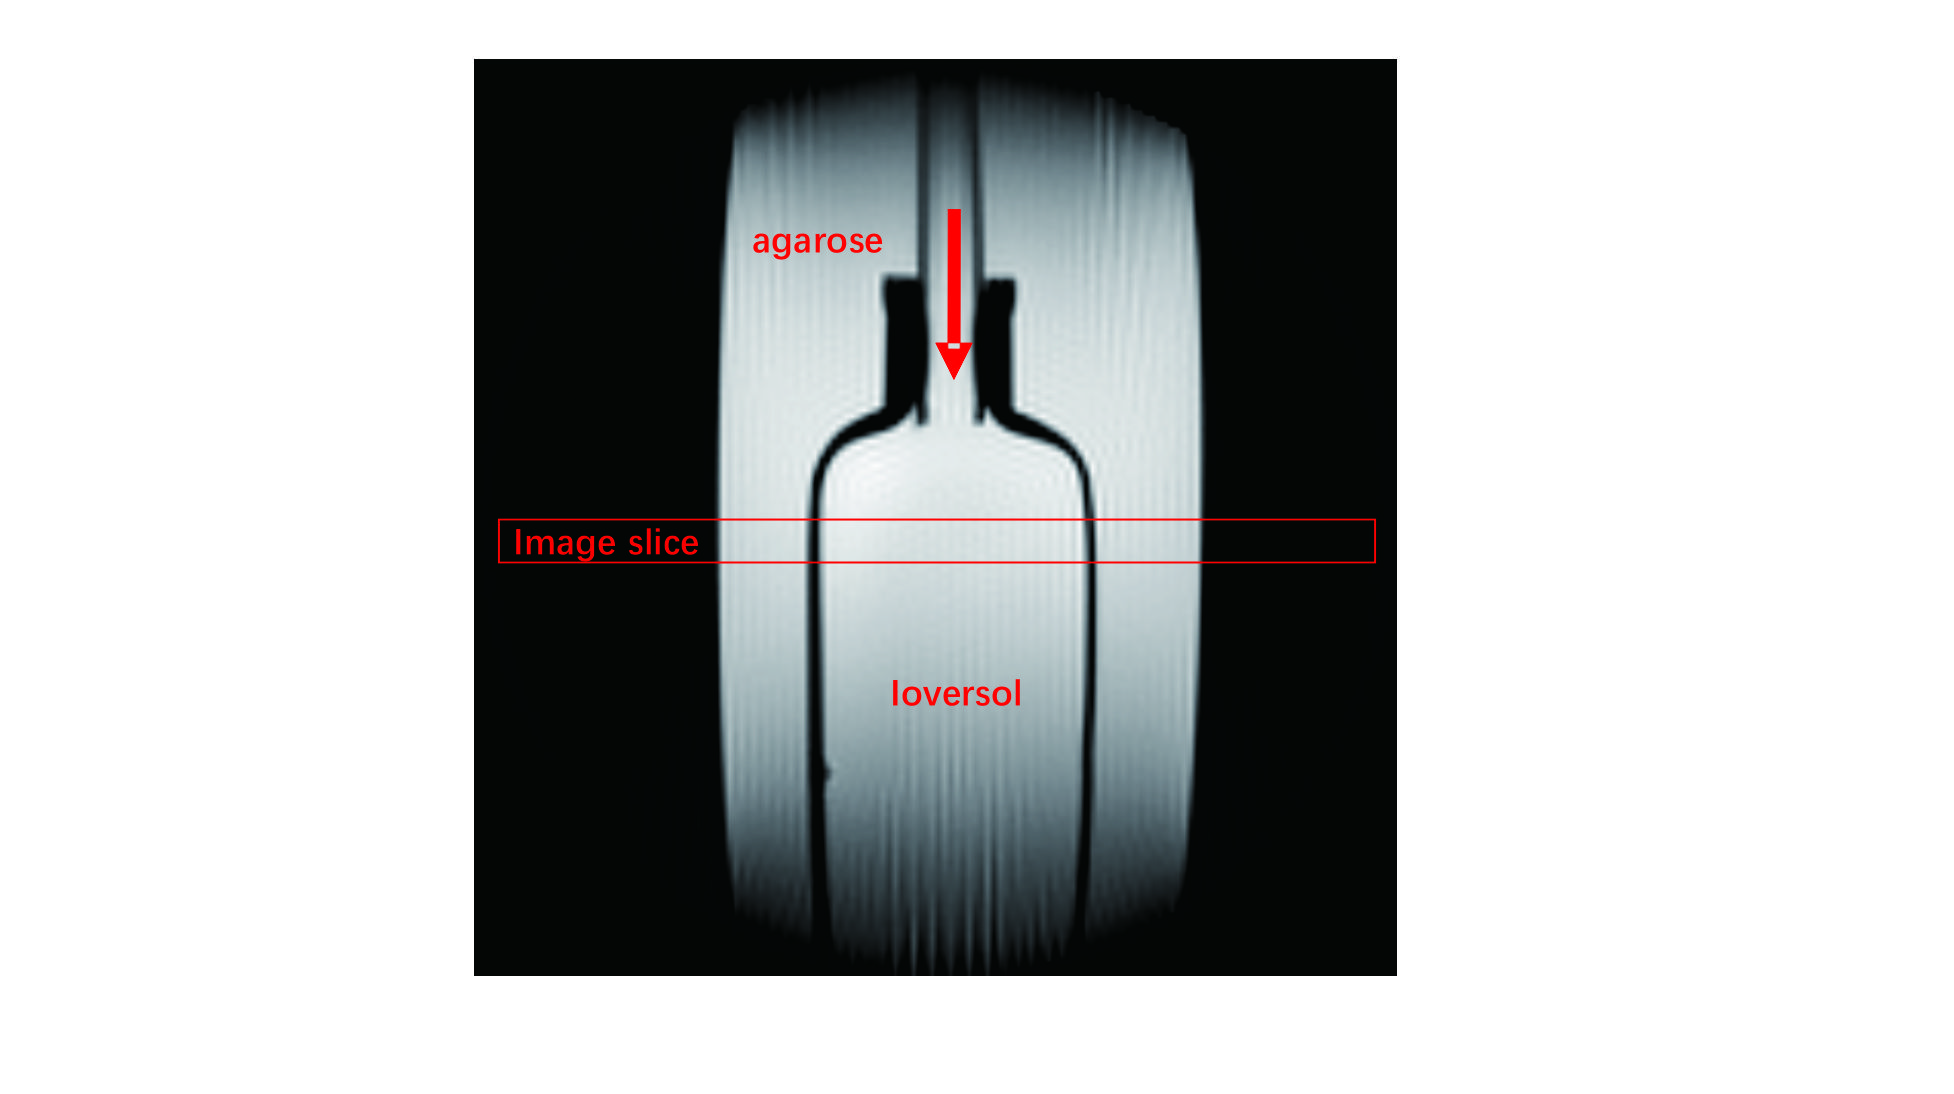
In vitro experiments: an rubber tubing contains ioversol solution (120mM) connected with peristaltic pump was to simulate the blood flowing (Figure 1.). Phantoms were scanned on a 7T small-bore MRI scanner (Bruker Biospec, Billerica, MA) equipped with a 40 mm volume coil. CEST imaging is under the flowing rate of 3 and 0 cm/s, and read out by ultrashort echo time (UTE). The resolution of CEST image is 0.25 mm2, TR=40 ms, TE=0.4 ms, saturation power=0.9 uT, saturation time=30 ms, the total saturation time for each offset is 12 s, and z-spectrum is acquired form -8 ppm to +8 ppm, the offset frequency is 0.2 ppm.In vivo experiments: rats were scanned on a 7T small-bore MRI scanner (Bruker Biospec, Billerica, MA) equipped with a 72mm volume coil and a rat heart array RF coil for signal transmission and reception respectively. In vivo imaging also used a UTE sequence for CEST signal readout. The resolution of CEST image is 0.4 mm2, TR=40 ms, TE=0.4 ms, imaging frequency is ±3.5 ppm, saturation power=0.9 uT, saturation time=30 ms, number of average=6. The resolution of ASL is the same as CEST, and TR=10000 ms, TI= 30, 100, 200, 300, 500, 800, 1200, 2000, 3000, 5000 ms.
Data processing The CEST signal was subtracted by MTR(±3.5ppm)=(M0-M±3.5ppm)/M0.
Results
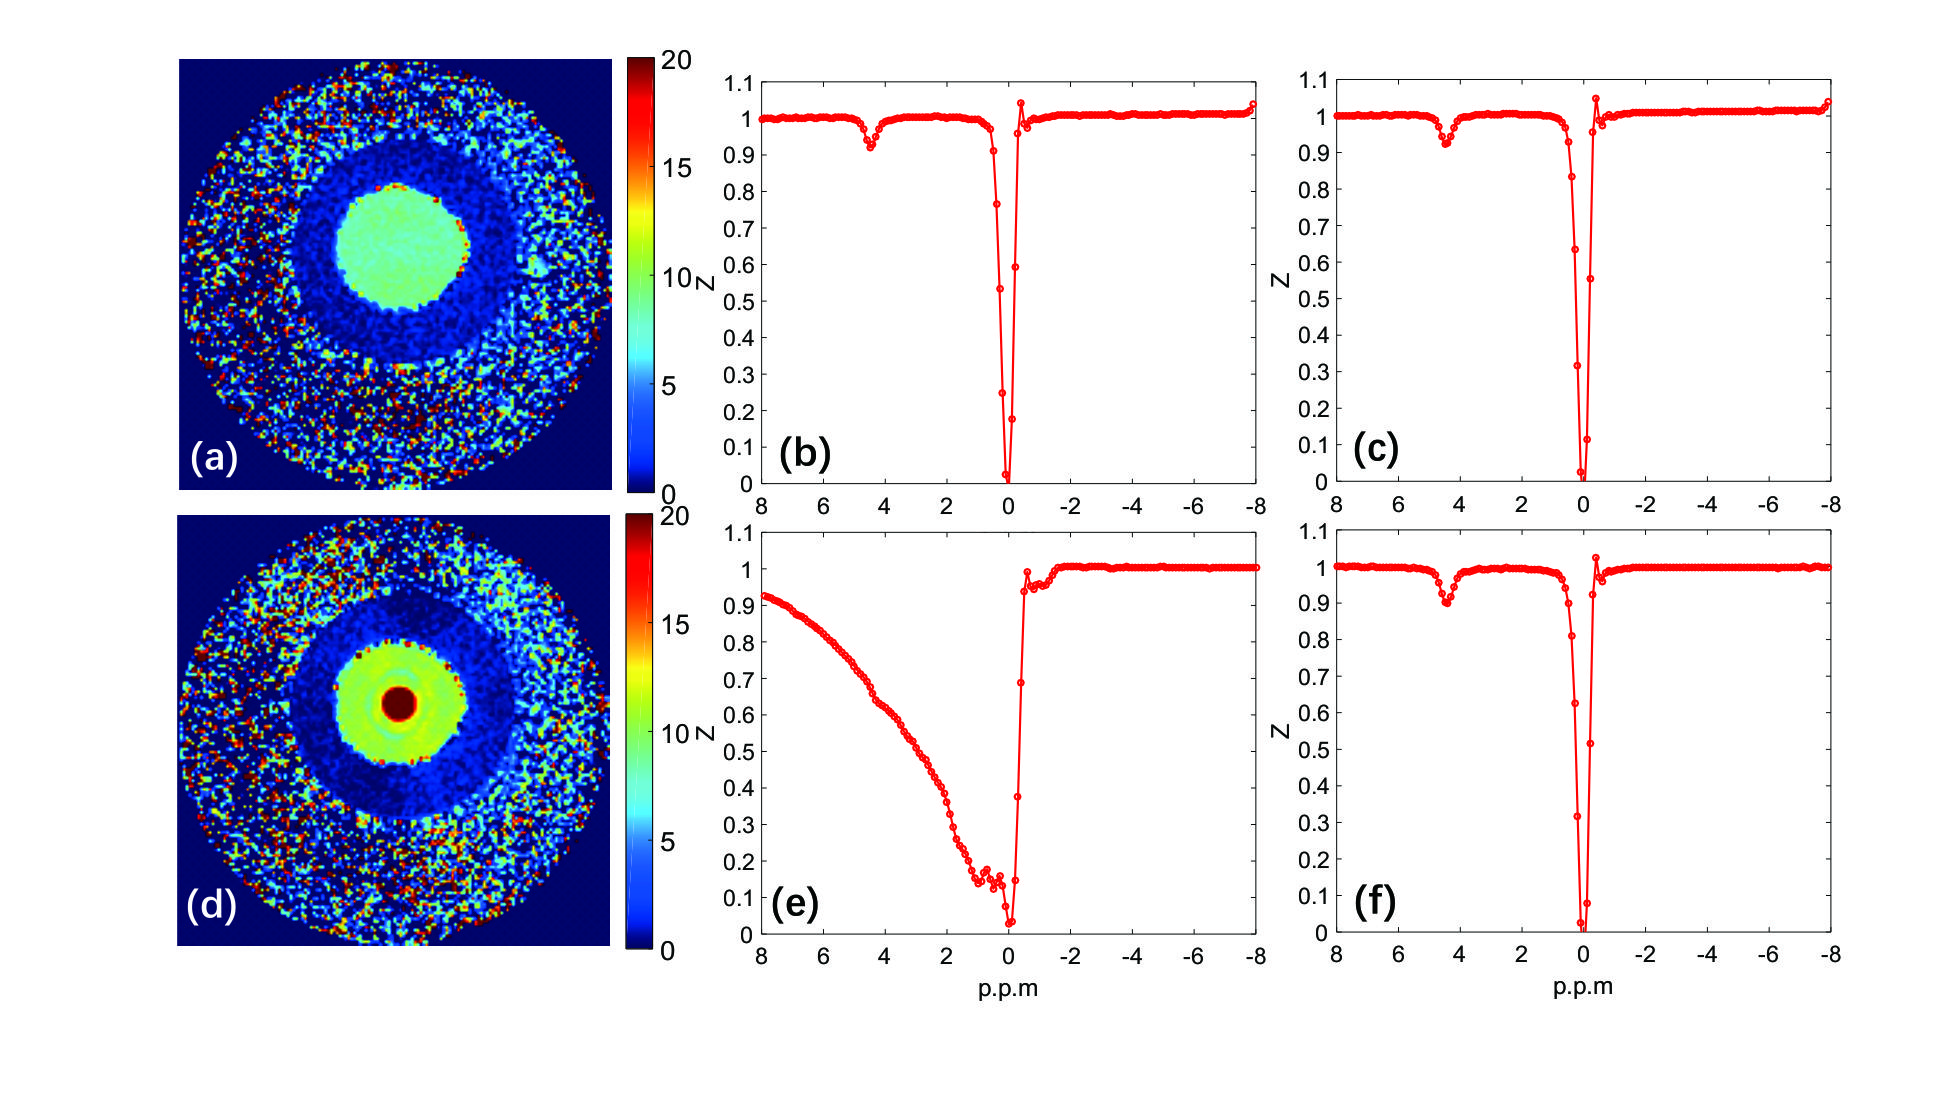
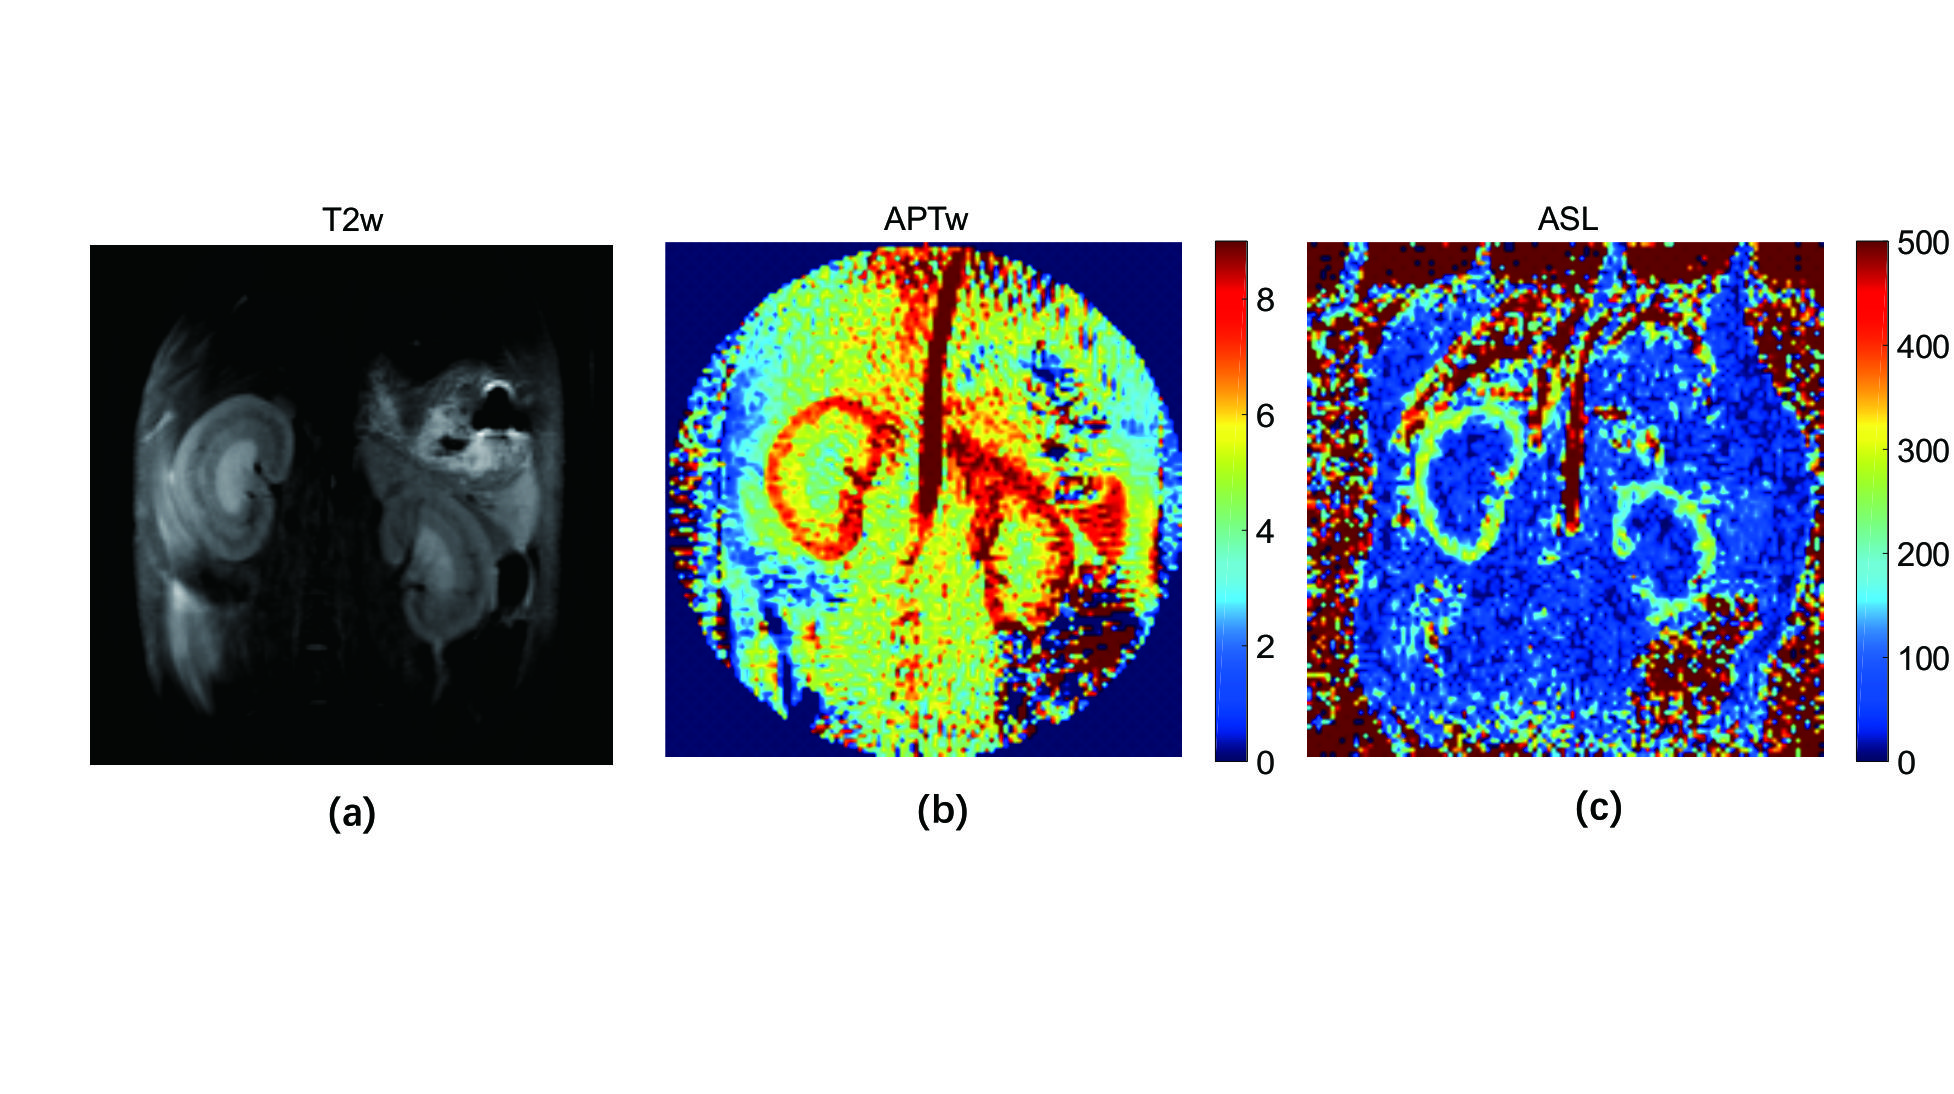
Figure 2 shown the CEST image of the phantom with the ioversol solution flowing with 3 and 0 cm/s. In figure 2(a), the MTR image on 4.3 ppm been shown, and (b), (c) show the z-spectrum of the center and exterior static solution. And the corresponding MTR image and z-spectrum of flowing solution also been shown in figure 2(d), (e), (f). In flowing solution, the MTR value improved drastically in the center, and smaller improved in the peripheral. Figure 3 shown the T2w, APT, and ASL image of the rats’ kidney. The APT signal of cortex is outclass that of medulla and pelvis, and highly consistent with ASL signal.Discussion and Conclusion
In this study, we quantify the CEST signal of the ioversol under the static and flowing situation, and found the CEST signal improvement if the ioversol flowing, which proved our assumption, the ASL signal will be mixing in CEST signal. And kidney experiment also be implemented, the CEST signal of cortex was much higher, and highly agreed with ASL signal. However, it not clear that if the perfusion effect alter with different CEST sequence, further detailed studies are still needed to confirm this assumption and purify the CEST signal.Acknowledgements
This work was supported by the Guangdong Provincal Medical Foundation (A2018268).References
[1] Zhou J, Heo H Y, Knutsson L, et al. APT‐weighted MRI: Techniques, current neuro applications, and challenging issues[J]. Journal of Magnetic Resonance Imaging, 2019.
[2] Liu J, Han Z, Chen G, et al. CEST MRI of sepsis‐induced acute kidney injury[J]. NMR in Biomedicine, 2018, 31(8): e3942.
[3] Kogan F, Stafford R B, Englund E K, et al. Perfusion has no effect on the in vivo CEST effect from Cr (CrCEST) in skeletal muscle[J]. NMR in Biomedicine, 2017, 30(1): e3673.
Figures