3123
Alzheimer’s Disease identification by an artificial neutral network based on chemical exchange saturation transfer (ANNCEST) MRI
Joseph H. C. Lai1, Jianpan Huang1, Xiongqi Han1, Jiadi Xu2,3, and Kannie W. Y. Chan1,2
1Department of Biomedical Engineering, City University of Hong Kong, Hong Kong, Hong Kong, 2Russell H. Morgan Department of Radiology and Radiological Science, Johns Hopkins University School of Medicine, Baltimore, MD, United States, 3F.M. Kirby Research Center for Functional Brain Imaging, Kennedy Krieger Research Institute, Baltimore, MD, United States
1Department of Biomedical Engineering, City University of Hong Kong, Hong Kong, Hong Kong, 2Russell H. Morgan Department of Radiology and Radiological Science, Johns Hopkins University School of Medicine, Baltimore, MD, United States, 3F.M. Kirby Research Center for Functional Brain Imaging, Kennedy Krieger Research Institute, Baltimore, MD, United States
Synopsis
There is an urgent need to develop an efficient and noninvasive methods to diagnose AD at an early stage. Artificial neural network (ANN) is a powerful model for prediction and classification of diseases, thus, it has been applied to facilitate prognosis and diagnosis. We propose to apply ANN based on chemical exchange saturation transfer (CEST) MRI at 3T to detect AD. Our phantom and AD mouse results showed that the trained ANN was able to identify AD from age-matched wild-type (WT) mice with high accuracy, which could provide valuable information for AD diagnosis.
Introduction
Stratification of Alzheimer’s disease (AD), which is a common form of dementia, has played an important role to guide treatments, especially in the aging populations. Many disease-modifying treatments are available to slow-down disease progression, which are effective when AD is diagnosed at an early stage (1,2). Hence, there is an urgent need to develop an efficient and noninvasive methods to diagnose early-stage AD. Chemical exchange saturation transfer (CEST) MRI is an imaging technique, which can detect low-concentration metabolites with exchangeable protons in vivo, such as protein, glucose or lipid (3-10). The so-called Z-spectrum containing these molecular information is used to characterize CEST contrast (5,11,12). We have demonstrated that CEST MRI can detect the protein aggregation or altered glucose uptake in AD mouse brain (13,14). However, these unique contrasts could overlap when Z-spectrum is acquired at low fields (e.g. ≤3T), resulting in subtle differences between AD and wild type (WT) mice. ANN is a powerful approach that can assist prediction and classification when features are obscure (15-18). Here, we proposed to apply ANN based on z-spectra to identify AD mice from WT mice. To mimic pathological changes in protein levels, we examined the feasibility of using ANN to classify different concentrations of bovine serum albumin (BSA) in vitro. Then we applied the ANN to identify Z-spectra of AD mouse brains from that of WT mouse brains based on CEST MRI at 3T.Methods
A phantom containing three 2-mL tubes was designed to mimic the protein concentrations (13,19). All components were kept constant except the BSA concentrations (Table 1, 5%, 10% and 15% for three tubes respectively). The components were dissolved in PBS at pH=7.2. Three AD mice (APP/PS1, 16M, male, Jackson Laboratory, Maine) and three age-matched WT mice (16M, male) were used in this study. All MRI experiments were performed on a horizontal bore 3T Bruker BioSpec system (Bruker, Germany). CEST sequence was a continuous wave (CW) saturation module followed by a Rapid Acquisition with Relaxation Enhancement (RARE) sequence as a read-out module. The imaging parameters were as follows: repetition time (TR)=8000ms; echo time (TE)=5.8ms; field of view (FOV)=20×20mm2; matrix size=96×96; slice thickness=2mm; slice number=3; RARE factor=32; saturation power (B1)= 0.8μT and saturation time (tsat)=2s. Frequency offsets of Z-spectrum were uniformly distributed between ±8ppm with 0.2ppm step size (81 points) and four M0 images at 200ppm were acquired, resulting in a total scanning time of 34min for each set. The ANN is a fully connected neural network with two hidden layers (120 and 84 neurons, respectively), as shown in Fig. 1, where the input is a full Z-spectrum and the output is a N×1 vector containing the probabilities for categories (N=3 for phantom and N=2 for mouse brain here). Dropout with keep probability of 0.9 was applied in the two hidden layers to prevent ANN from overfitting (20). The activation function in hidden layers was ReLU (21) and the optimized algorithm was Adam (22). The training and testing data size are shown in Table 2. Batch size was set to 512, and number of epochs was 50 for phantom and 5000 for mouse brain, thus leading to a training time of 10s and 417s for phantom and mouse brain respectively. Training and testing were performed on MATLAB R2018b (Mathworks, Natick, MA) on a personal computer (Intel Core i7, 16 GB memories).Results and Discussion
Phantom was scanned six times (five for training and one for testing) in independent MRI experiments. Representative Z-spectra of phantoms are shown in Fig. 2B, differences were observed at different protein levels, especially at ±3.5ppm which represents the APT and NOE. Therefore, the ANN can be fast trained to reach a promising classification accuracy and an extremely low training loss (Fig. 2C). The training accuracy is 99.95% and the testing accuracy is 97.64%, as shown in Table 3. The prediction map generated by the trained ANN clearly showed the classification of three tubes, especially the tube with 5% BSA (Fig. 2D). There were some pixels in the boundary of tubes with 10% and 15% BSA were not well predicted, mainly due to the partial volume effect. For the mouse brain, the Z-spectra did not have obvious differences between AD and WT mice (Fig. 3A), which lead to a larger variation in the training accuracy and loss curves (Fig. 3B). Nevertheless, the ANN was still well trained to a right trend, with a training accuracy of 87.43% and test accuracy of 78.54% at last (Table 3). The prediction maps composed of probability of each pixels also showed an apparent identification of AD from WT (Fig. 3D&E).Conclusion
We applied an ANN based on Z-spectrum of CEST MRI to detect AD at 3T. Phantom results showed that the trained ANN can achieve a testing accuracy of 97.64% for classifying phantoms with different BSA concentrations. Similarly, ANN can identify Z-spectra of AD mouse brains from age-matched WT mouse brains with a training accuracy of 87.43% and testing accuracy of 78.54%. This approach could provide valuable information for the AD diagnosis.#J.H.C. Lai and J. Huang contributed equally.
Acknowledgements
We are grateful to receive funding support from the Research Grants Council (RGC) of Hong Kong [9042620] and the City University of Hong Kong [9610362, 7004859, 7005210].References
- Mangialasche F, Solomon A, Winblad B, Mecocci P, Kivipelto M. Alzheimer's disease: clinical trials and drug development. Lancet Neurol 2010;9(7):702-716.
- Goedert M, Spillantini MG. A century of Alzheimer's disease. Science 2006;314(5800):777-781.
- Jones KM, Pollard AC, Pagel MD. Clinical applications of chemical exchange saturation transfer (CEST) MRI. J Magn Reson Imaging 2018;47(1):11-27.
- van Zijl PC, Lam WW, Xu J, Knutsson L, Stanisz GJ. Magnetization transfer contrast and chemical exchange saturation transfer MRI. Features and analysis of the field-dependent saturation spectrum. NeuroImage 2018;168:222-241.
- Van Zijl PC, Yadav NN. Chemical exchange saturation transfer (CEST): what is in a name and what isn't? Magn Reson Med 2011;65(4):927-948.
- Ward K, Aletras A, Balaban RS. A new class of contrast agents for MRI based on proton chemical exchange dependent saturation transfer (CEST). J Magn Reson 2000;143(1):79-87.
- Jones CK, Huang A, Xu J, Edden RA, Schär M, Hua J, Oskolkov N, Zacà D, Zhou J, McMahon MT. Nuclear Overhauser enhancement (NOE) imaging in the human brain at 7 T. NeuroImage 2013;77:114-124.
- Zhou J, Lal B, Wilson DA, Laterra J, van Zijl PC. Amide proton transfer (APT) contrast for imaging of brain tumors. Magn Reson Med 2003;50(6):1120-1126.
- Chan KW, McMahon MT, Kato Y, Liu G, Bulte JW, Bhujwalla ZM, Artemov D, van Zijl PC. Natural D‐glucose as a biodegradable MRI contrast agent for detecting cancer. Magn Reson Med 2012;68(6):1764-1773.
- Walker-Samuel S, Ramasawmy R, Torrealdea F, Rega M, Rajkumar V, Johnson SP, Richardson S, Gonçalves M, Parkes HG, Årstad E. In vivo imaging of glucose uptake and metabolism in tumors. Nat Med 2013;19(8):1067-1072.
- Zaiß M, Schmitt B, Bachert P. Quantitative separation of CEST effect from magnetization transfer and spillover effects by Lorentzian-line-fit analysis of z-spectra. J Magn Reson 2011;211(2):149-155.
- Zaiss M, Bachert P. Chemical exchange saturation transfer (CEST) and MR Z-spectroscopy in vivo: a review of theoretical approaches and methods. Phys Med Biol 2013;58(22):R221-R269.
- Chen L, Wei Z, Chan KW, Cai S, Liu G, Lu H, Wong PC, van Zijl PC, Li T, Xu J. Protein aggregation linked to Alzheimer's disease revealed by saturation transfer MRI. NeuroImage 2019;188:380-390.
- Huang J, Xu J, Dong CM, Chen L, Han X, Wu EX, Van Zijl P, Chan KW. Impaired glucose uptake in mouse brain with Alzheimer’s disease detected by dynamic glucose enhanced (DGE) MRI at 3T. Alzheimers Dement 2019;15(7):747.
- Dreiseitl S, Ohno-Machado L. Logistic regression and artificial neural network classification models: a methodology review. J Biomed Inform 2002;35(5-6):352-359.
- Amato F, López A, Peña-Méndez EM, Vaňhara P, Hampl A, Havel J. Artificial neural networks in medical diagnosis. Elsevier; 2013.
- Chen L, Schär M, Chan WYK, Huang J, Wei Z, Lu H, Qin Q, Weiss GR, van Zijl CMP, Xu J. High-resolution phosphocreatine mapping of human skeletal muscle by artificial neural network-based chemical exchange saturation transfer MRI at 3T. 2019; Montreal, Canada. ISMRM 27th Annual Meeting & Exhibition.
- Zaiss M, Deshmane A, Schuppert M, Herz K, Glang F, Ehses P, Lindig T, Bender B, Ernemann U, Scheffler K. DeepCEST: 9.4 T Chemical exchange saturation transfer MRI contrast predicted from 3 T data–a proof of concept study. Magn Reson Med 2019;81(6):3901-3914.
- Pfeuffer J, Tkáč I, Provencher SW, Gruetter R. Toward an in vivo neurochemical profile: quantification of 18 metabolites in short-echo-time 1H NMR spectra of the rat brain. J Magn Reson 1999;141(1):104-120.
- Srivastava N, Hinton G, Krizhevsky A, Sutskever I, Salakhutdinov R. Dropout: a simple way to prevent neural networks from overfitting. J Mach Learn Res 2014;15(1):1929-1958.
- Nair V, Hinton GE. Rectified linear units improve restricted boltzmann machines. 2010. p 807-814.
- Kingma DP, Ba J. Adam: A method for stochastic optimization. arXiv preprint arXiv:14126980 2014.
Figures

Fig.
1. Scheme of the ANNCEST with an input of Z-spectrum and output of N×1 vector containing
the probabilities for categories (N=3 for phantom and N=2 for mouse brain
here).
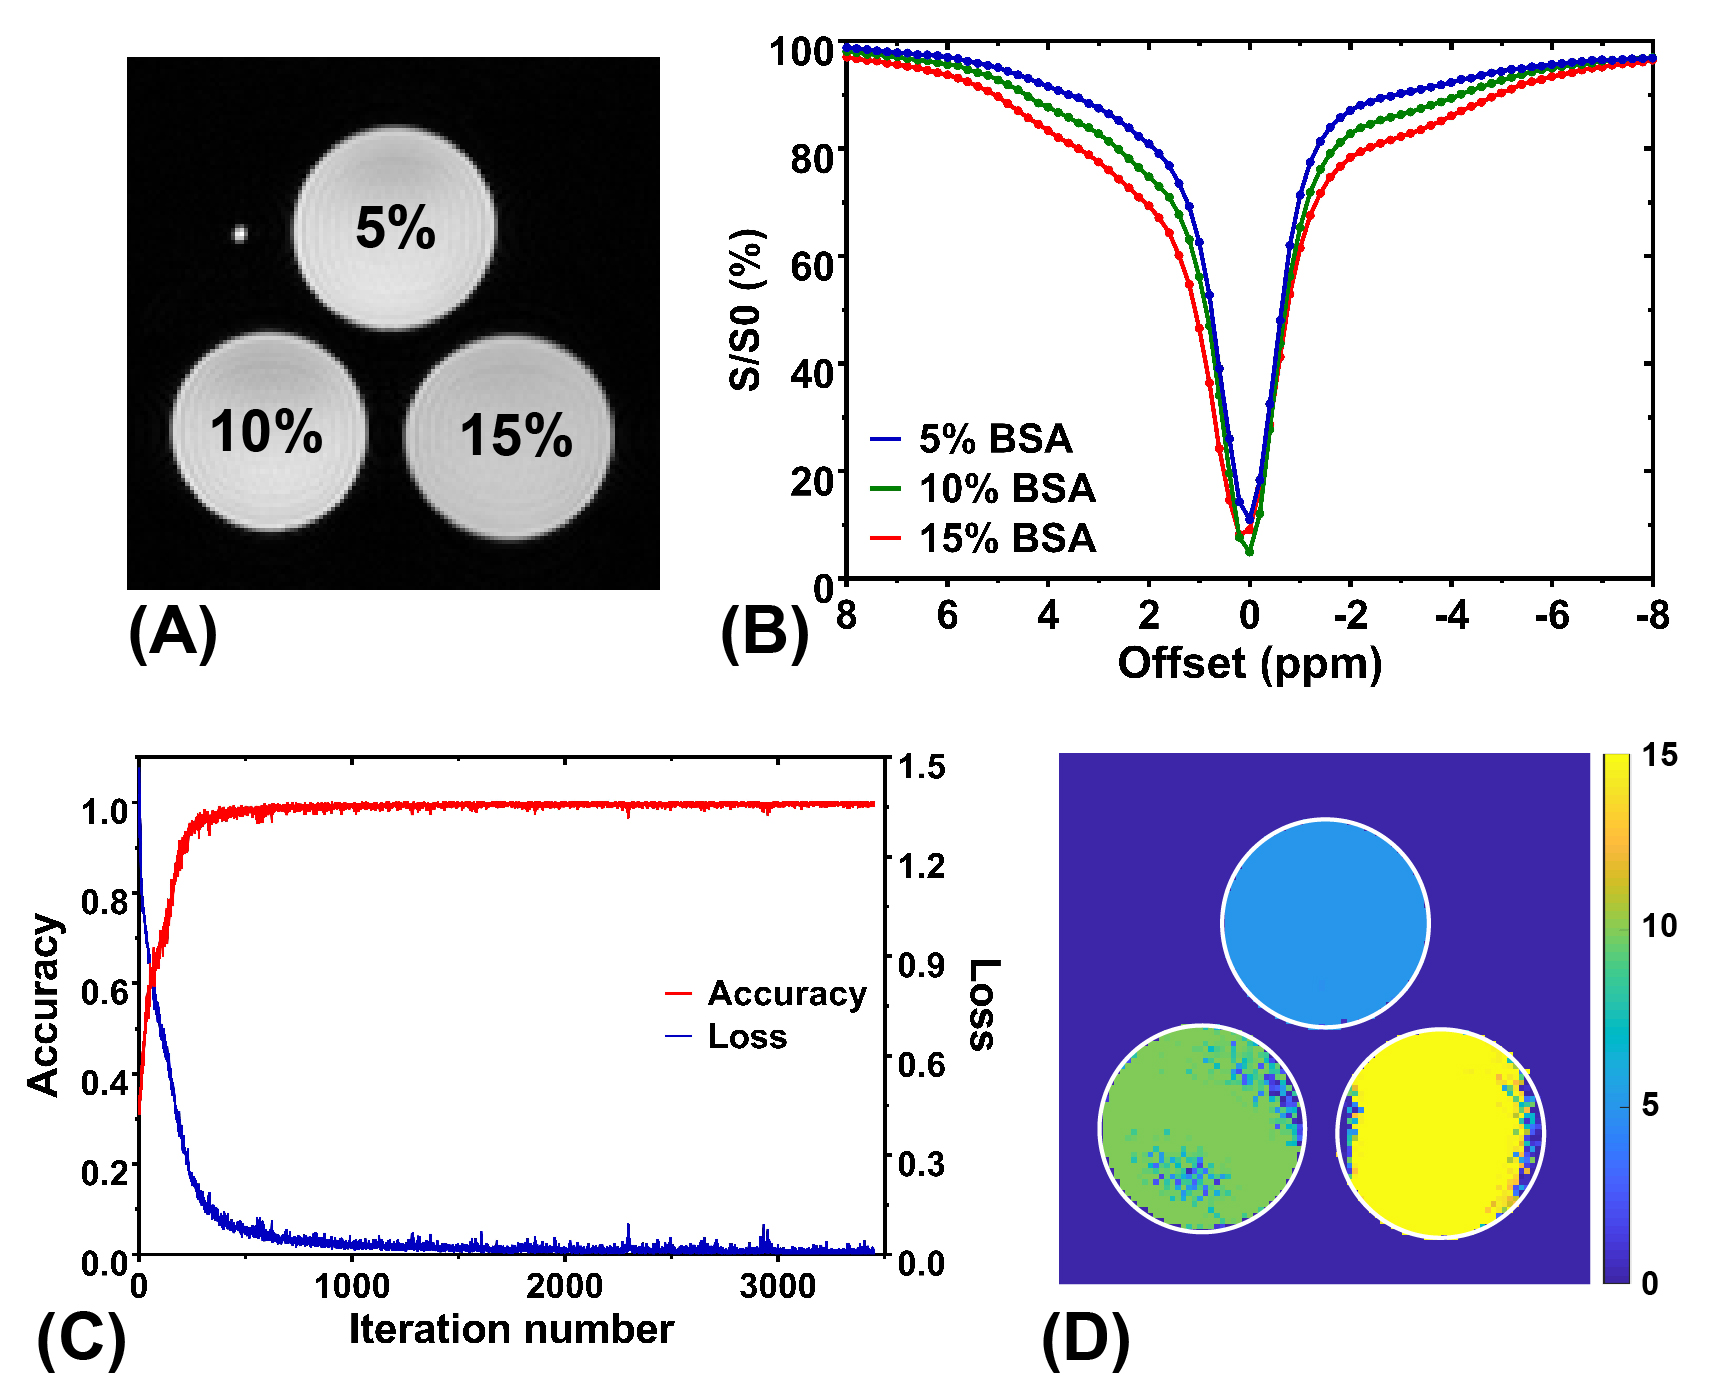
Fig.
2. Results of ANNCEST on phantom. (A) T2 weighted anatomical image of three
tubes with different BSA concentrations. (B) Z-spectra for three tubes. (C)
ANNCEST training accuracy and loss. (D) The prediction map for three tubes with
different concentrations. The pixel value (pv) for phantom prediction map is
calculated by: pv=p(n)×conc(n), where p(n) and conc(n) are probability
generated by ANNCEST and concentrations of nth tube, respectively.
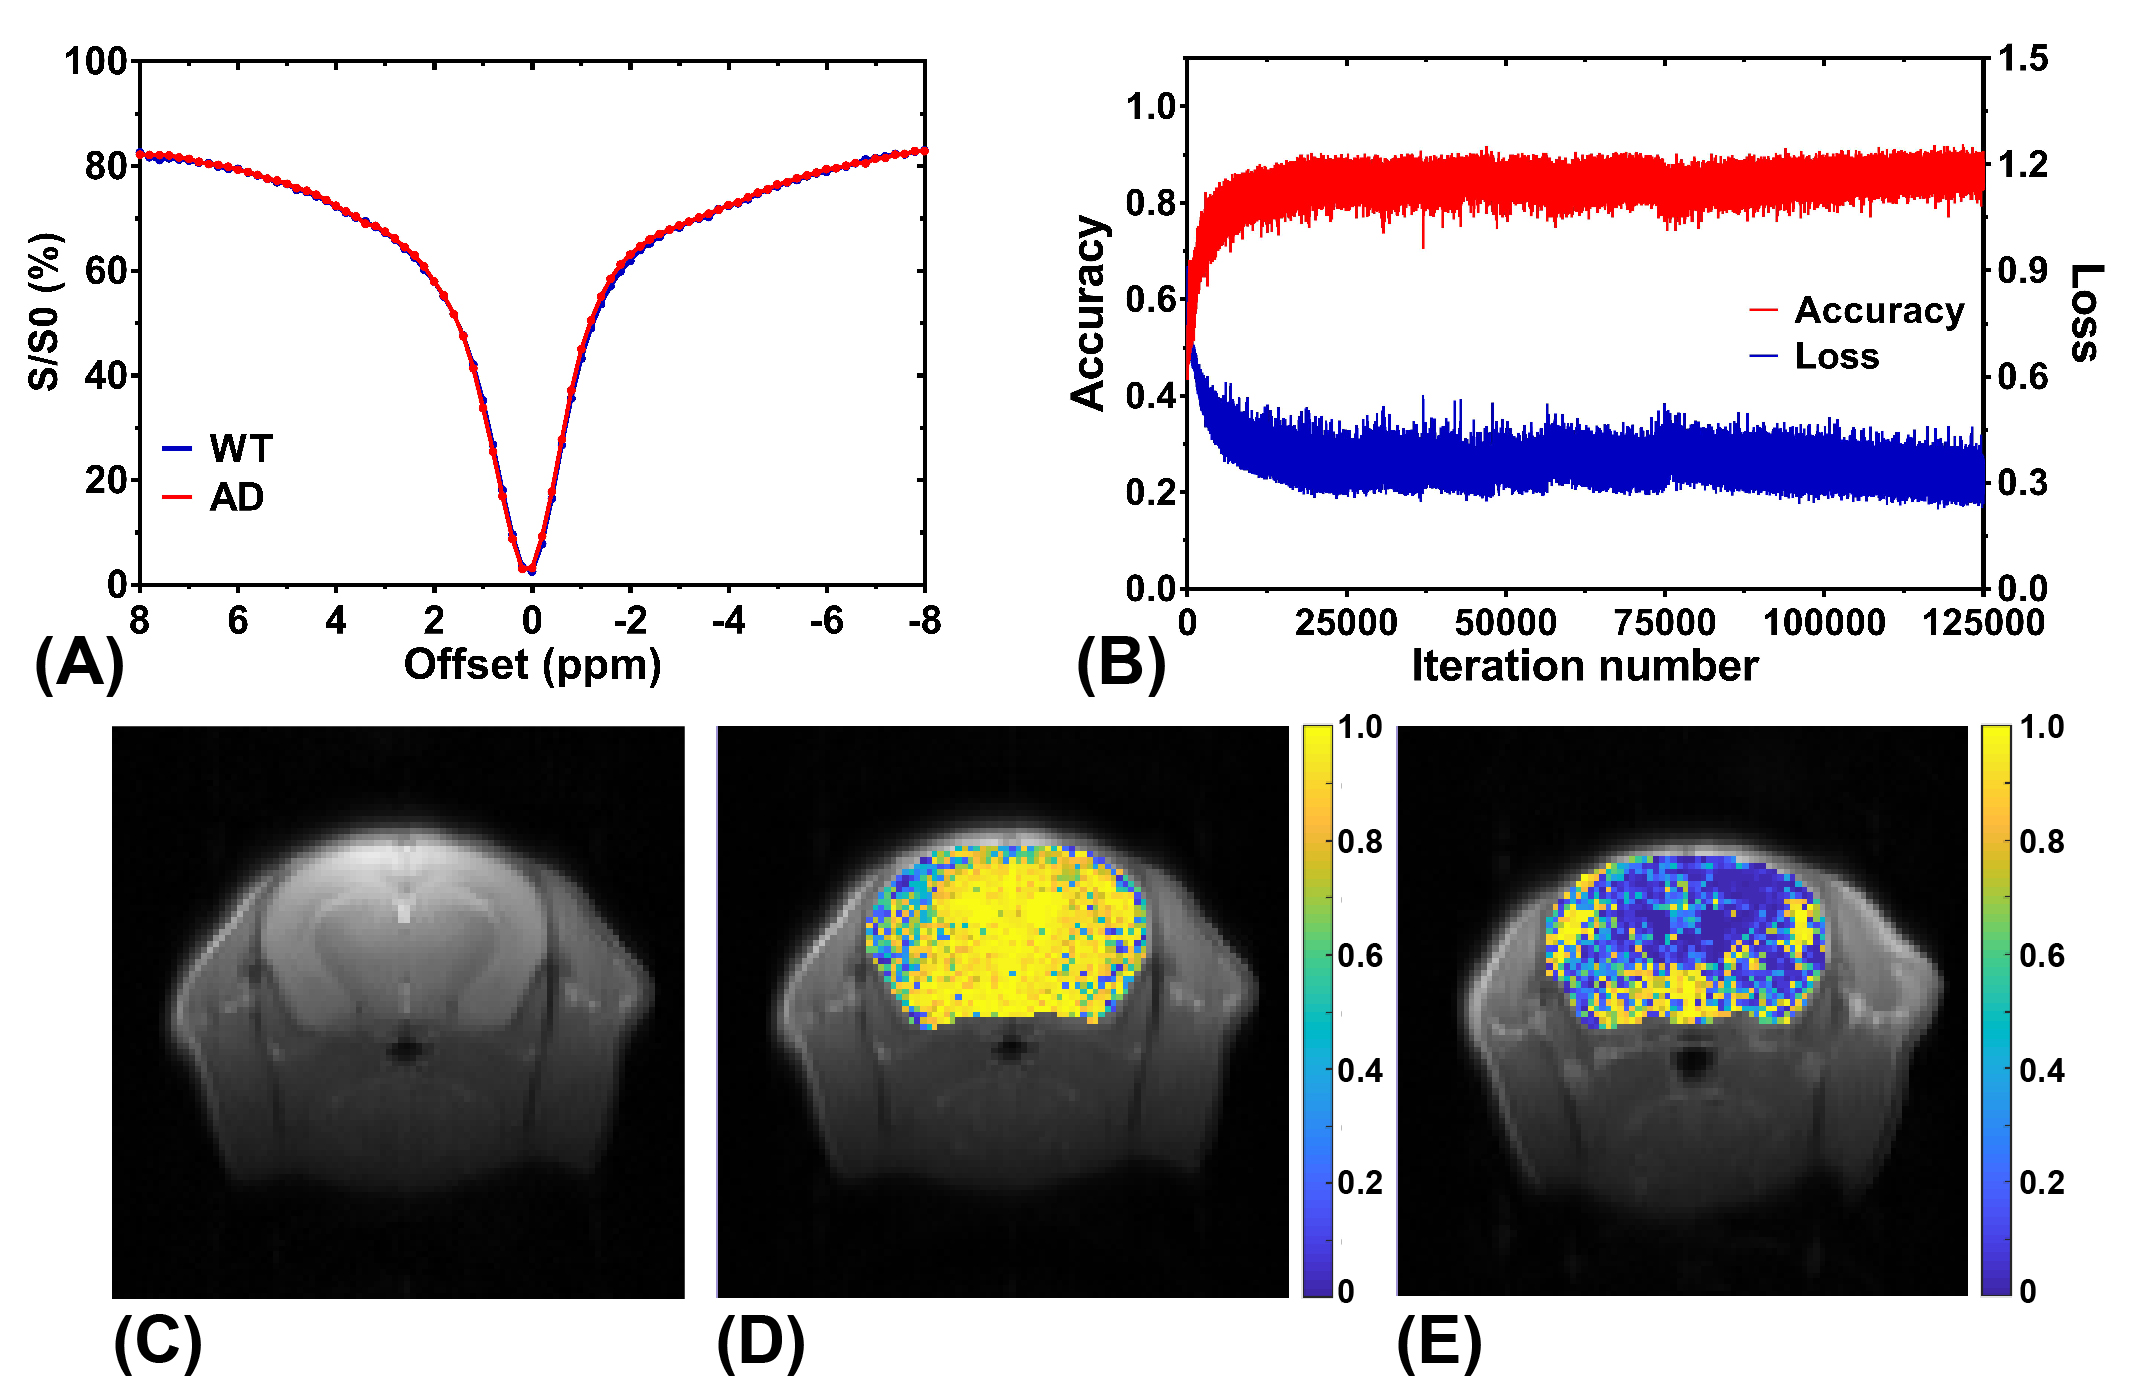
Fig.
3. Results of ANNCEST on AD mouse. (A) Z-spectra for AD and WT mouse. (B)
ANNCEST training accuracy and loss. (C) T2 weighted anatomical image testing AD
mouse. (D&E) The prediction map for testing AD and WT mouse respectively.
The pixel value (pv) for mouse prediction map is calculated by: pv=p(AD), where
p(AD) is the probability of AD generated by ANNCEST.
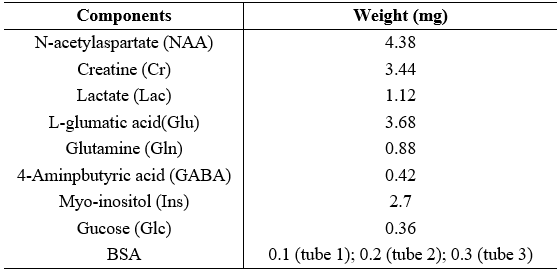
Table
1. Components and their concentrations in phantom
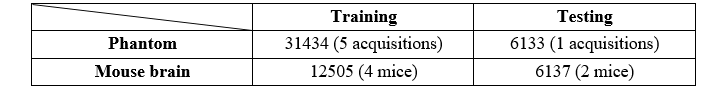
Table
2. Data size of Z-spectra for training and test
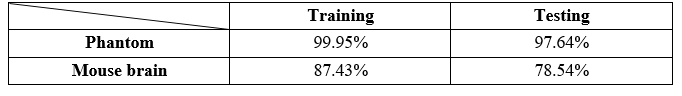
Table
3. Training and test accuracy