3121
Optimized CEST acquisition and analysis for treatment assessment of response to neoadjuvant chemotherapy in triple negative breast cancer
Shu Zhang1, Abeer H. Abdelhafez2, Jong Bum Son3, Benjamin C. Musall3, Mitsuharu Miyoshi4, Xinzeng Wang5, Ken-Pin Hwang3, Gaiane M. Rauch2, Jingfei Ma3, and Mark D. Pagel1
1Cancer Systems Imaging, The University of Texas MD Anderson Cancer Center, Houston, TX, United States, 2Abdominal Imaging, The University of Texas MD Anderson Cancer Center, Houston, TX, United States, 3Imaging Physics, The University of Texas MD Anderson Cancer Center, Houston, TX, United States, 4Global MR Applications & Workflow, GE Healthcare Japan, Tokyo, Japan, 5Global MR Applications & Workflow, GE Healthcare, Houston, TX, United States
1Cancer Systems Imaging, The University of Texas MD Anderson Cancer Center, Houston, TX, United States, 2Abdominal Imaging, The University of Texas MD Anderson Cancer Center, Houston, TX, United States, 3Imaging Physics, The University of Texas MD Anderson Cancer Center, Houston, TX, United States, 4Global MR Applications & Workflow, GE Healthcare Japan, Tokyo, Japan, 5Global MR Applications & Workflow, GE Healthcare, Houston, TX, United States
Synopsis
In our ongoing study of 13 completed patients, we compared two saturation power levels (2.0 μT vs. 0.9 μT) and two analysis methods (MTRasym vs. Lorentzian line fitting) of CEST for assessing treatment response to neoadjuvant chemotherapy of triple-negative breast cancer (TNBC). A consistently decreasing trend of the CEST signals was observed with the longitudinal treatment when a higher saturation power of 2.0 μT was used with the amide MTRasym analysis method. In contrast, the same trend was observed when a lower saturation power of 0.9 μT was used for the Lorentzian line fitting analysis method.
Introduction
Chemical exchange saturation transfer (CEST) MRI is potentially useful for early assessment of treatment response of cancer.1 However, there are several different acquisition and analysis methods that could impact the quantitative CEST signals. In this study, we investigated e CEST MRI as an imaging biomarker for early treatment response for triple-negative breast cancer (TNBC) patients receiving neoadjuvant chemotherapy (NAC) and compared two saturation power levels and two analysis methods to determine if they affect the CEST signal changes during the patient treatment.Methods
Our study was approved by the institutional IRB and all patients provided their written informed consent. In total, 13 patients with biopsy-proved TNBC were scanned on a 3T GE human scanner (Discovery MR750) using an 8-channel bilateral breast coil in a prone position. The patients were scanned before the NAC (baseline or BL, N = 13), after 2 cycles of treatment (C2, N = 9), after 4 cycles of treatment (C4, N = 9), and before surgery (presurgery or PS, N = 6). CEST images were acquired using a single-shot fast spin echo (SSFSE) sequence with Field of view Optimized and Constrained Undistorted Single shot (FOCUS). 2 The same sequence was scanned first with a CEST saturation power of 0.9 μT and a saturation time of 3500 ms, and then repeated with a CEST saturation power of 2.0 μT and a saturation time of 2000 ms. For both acquisitions, 29 saturation frequencies from -7 to 7 ppm were used in addition to a reference image without CEST saturation. WASSR was acquired in the same scan series for field inhomogeneity correction.3 Fat saturation pulses were employed for fat suppression. Other parameters included FOV = 180 mm × 144 mm, slice thickness = 8 mm and acquisition matrix size = 128 × 128. For both low and high saturation power sequences, TR/TE = 6000/33.6 ms and the total scan time was 4 min 18 sec.For data acquired at both saturation settings, we measured the CEST signal using MTRasym averaged between 3.0 – 4.0 ppm (MTRasym3-4) and Lorentzian line fitting with 2 line shapes that represent water and amide signals at 3.5 ppm. Only the data from 7 to -1 ppm in the Z-spectrum were used in order to minimize the influence of residual fat and NOE signals on the fitting. The magnitude of the fitted amide line was used to represent the CEST signal (Mag3.5). Tumor ROIs were drawn manually on the CEST images by an experienced breast radiologist with reference to the DWI and DCE images. The biopsy marker clip and necrosis were excluded from the measurement ROIs. The changes of the CEST signals for each patient during their treatment were monitored and analyzed.
Results
The MTRasym maps and their corresponding Z-spectra and MTRasym are shown for a representative patient from BL to C4 scans in Figs. 1 and 2, respectively. The Mag3.5 maps and fitted lines for the same patient are also shown in Figs. 3 and 4. The average results for all patients are shown in Fig. 5. The Z-spectra were relatively smooth and no obvious fat residual signals or NOE effects were observed. The low power Z-spectra were nosier than the high power spectra (Fig. 2). The high power MTRasym3-4 was higher than that of the low power at baseline and showed a decreasing trend as the treatment progressed. In comparison, the low power MTRasym3-4 were similar from BL to C4 (Fig. 2 and 5a). The low power Mag3.5 was higher than that of the high power at baseline and also showed a decreasing trend from BL to C4. However, the high power Mag3.5 had similar values from BL to C4 (Fig. 4 and 5b).Discussion
Despite being potentially useful for monitoring cancer treatment, there is currently no consensus on the optimal acquisition and analysis methods for CEST imaging. In our study of TNBC during NAC treatment, the MTRasym in combination with the high saturation power or the Lorentzian line fitting method in combination with the low saturation power demonstrated more consistent CEST signal changes. A potential explanation of our findings may relate to the amide signal strength and lineshape: the amide has a slow exchange rate and hence is expected to produce higher CEST signal with higher saturation power. 4 In comparison, lower saturation power produces narrower CEST peaks which are more amenable to line fitting.Conclusion
Decreasing CEST signals were observed during the NAC treatment of TNBC. However, signal changes were best observed when MTRasym was used for data acquired at a high saturation power and when Lorentzian line fitting was used for data acquired at a low saturation power.Acknowledgements
This work was supported in part by the Odyssey Program and Cockrell Foundation Award for Scientific Achievement at The University of Texas MD Anderson Cancer Center (S.Z.).References
- Jones KM, Pollard AC, Pagel MD. Clinical Applications of Chemical Exchange Saturation Transfer (CEST) MRI. J Magn Reson Imaging. 2018; 47(1): 11-27.
- Miyoshi M, Matsuda T, Kabasawa H. CEST imaging with phase cycled rectangular RF preparation pulse: analytical solution, simulation and phantom study. Proceedings of ISMRM 2014, 3299.
- Kim M, Gillen J, Landman BA, et al. Water saturation shift referencing (WASSR) for chemical exchange saturation transfer (CEST) experiments. Magn Reson Med. 2009; 61(6): 1441-1450.
- Zhou J, Wilson DA, Sun PZ, et al. Quantitative description of proton exchange processes between water and endogenous and exogenous agents for WEX, CEST, and APT experiments. Magn Reson Med. 2004; 51(5): 945-952.
Figures
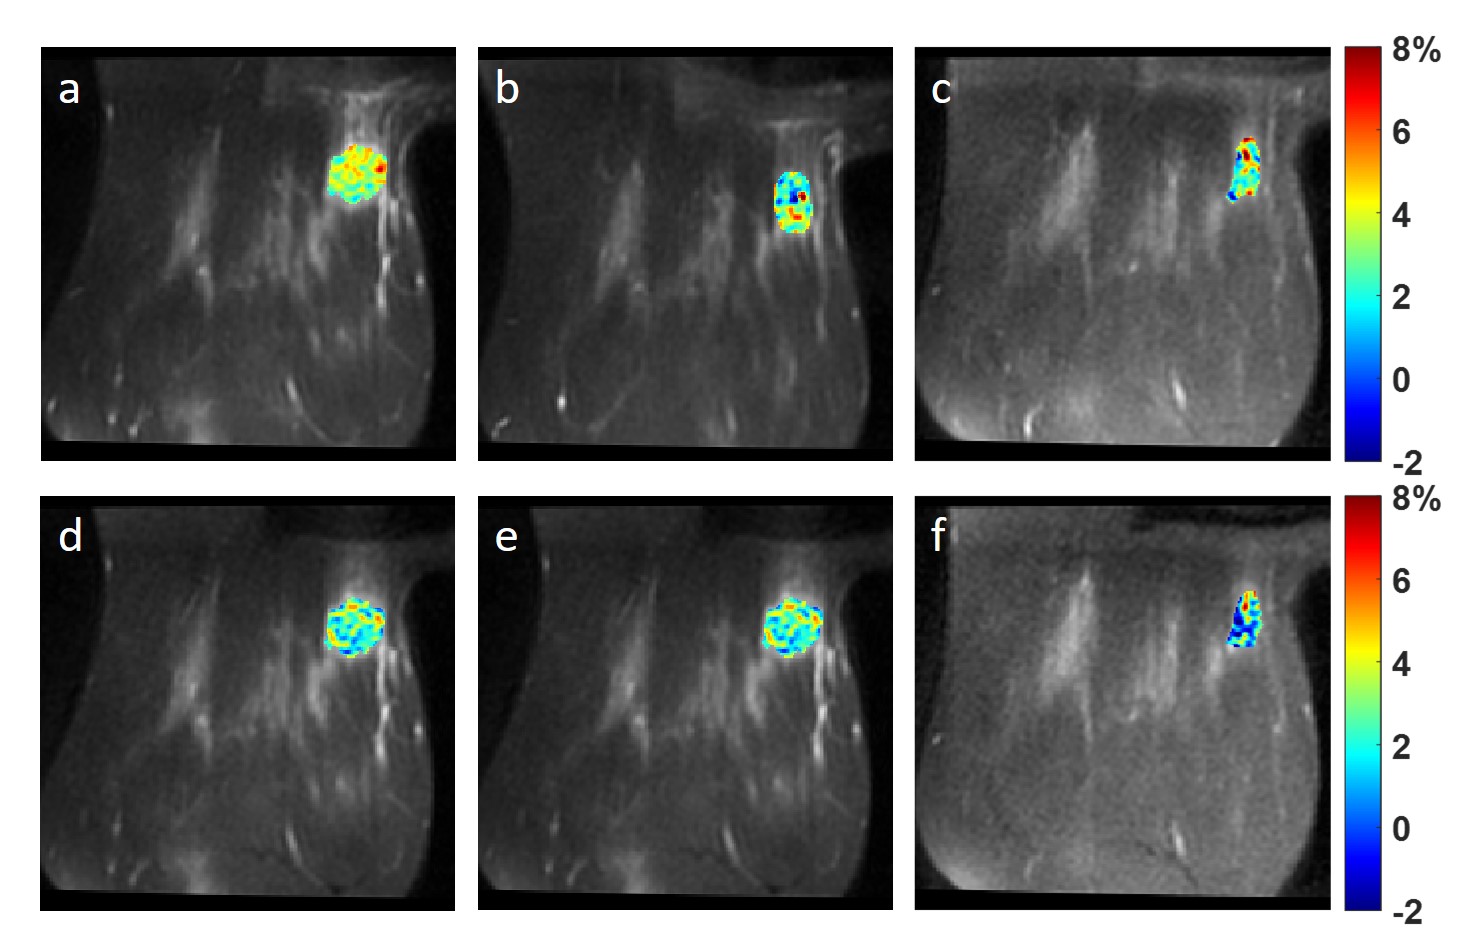
Figure 1. MTRasym map averaged in 3.0
- 4.0 ppm using 2.0 μT
saturation power (a-c) and 0.9 μT
saturation power (d-f) at BL (a,d), C2 (b,e) and C4 (c,f) of a TNBC
patient.
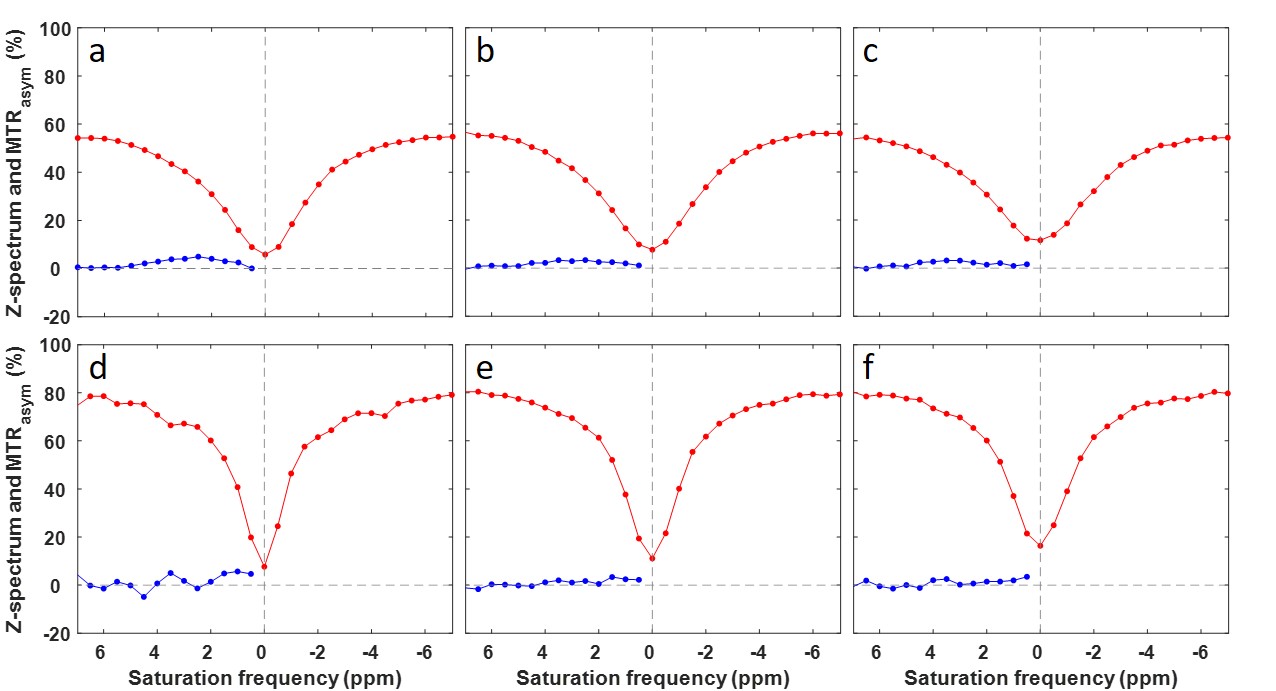
Figure 2. ROI averaged Z-spectra and MTRasym
using 2.0 μT saturation power
(a-c) and 0.9 μT saturation power
(d-f) at BL (a,d), C2 (b,e) and C4 (c,f) of a TNBC patient.
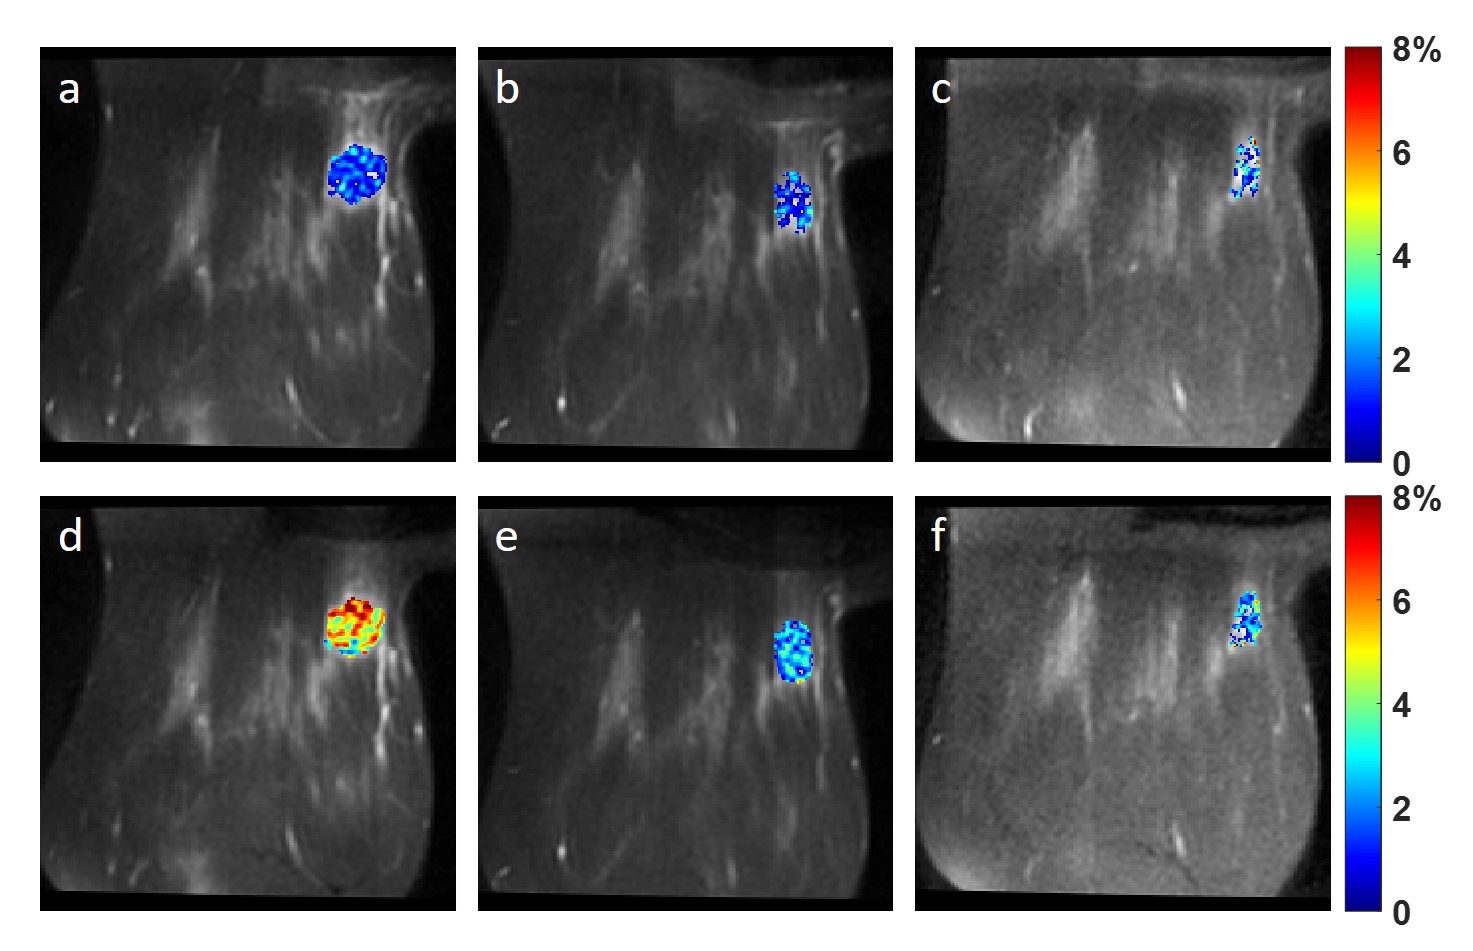
Figure 3. Magnitude map of the fitted Lorentzian
line at 3.5 ppm using 2.0 μT
saturation power (a-c) and 0.9 μT
saturation power (d-f) at BL (a,d), C2 (b,e) and C4 (c,f) of a TNBC
patient.
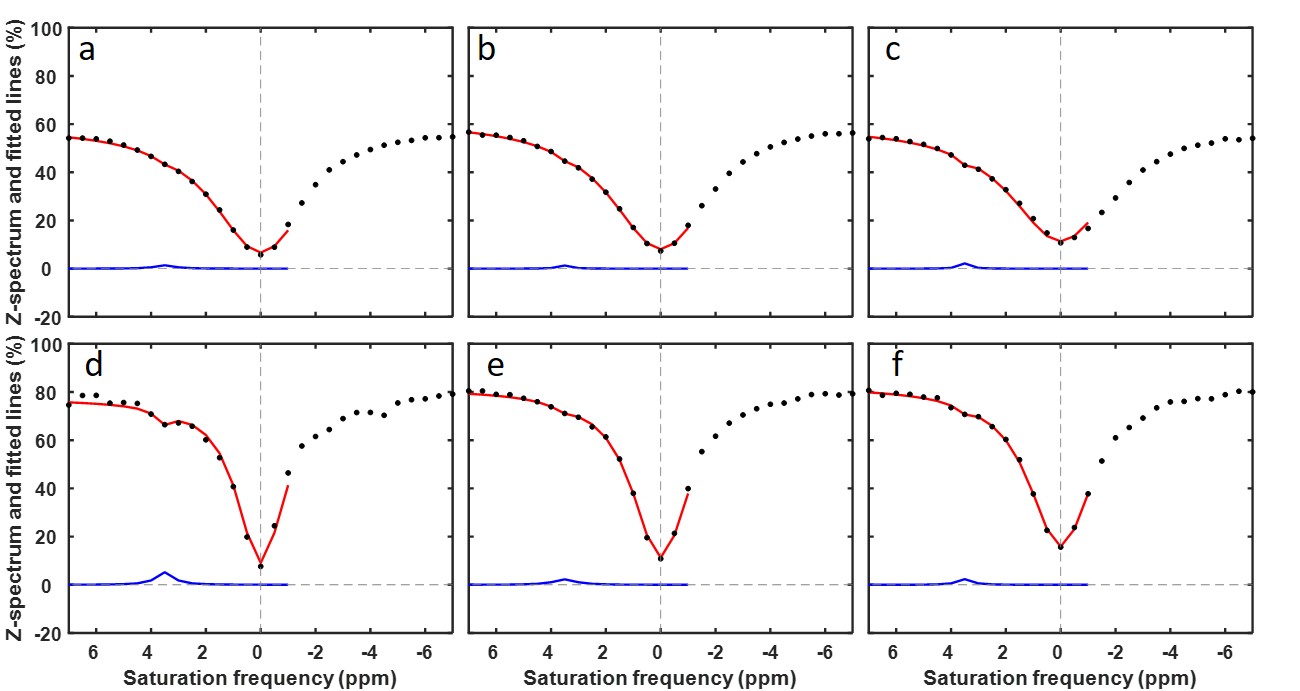
Figure 4. ROI averaged fitted spectrum (red
line) and Lorentzian line at 3.5 ppm (blue) using 2.0 μT
saturation power (a-c) and 0.9 μT
saturation power (d-f) at BL (a,d), C2 (b,e) and C4 (c,f) of a TNBC
patient. The acquired, ROI averaged Z-spectrum was showing as black dots.
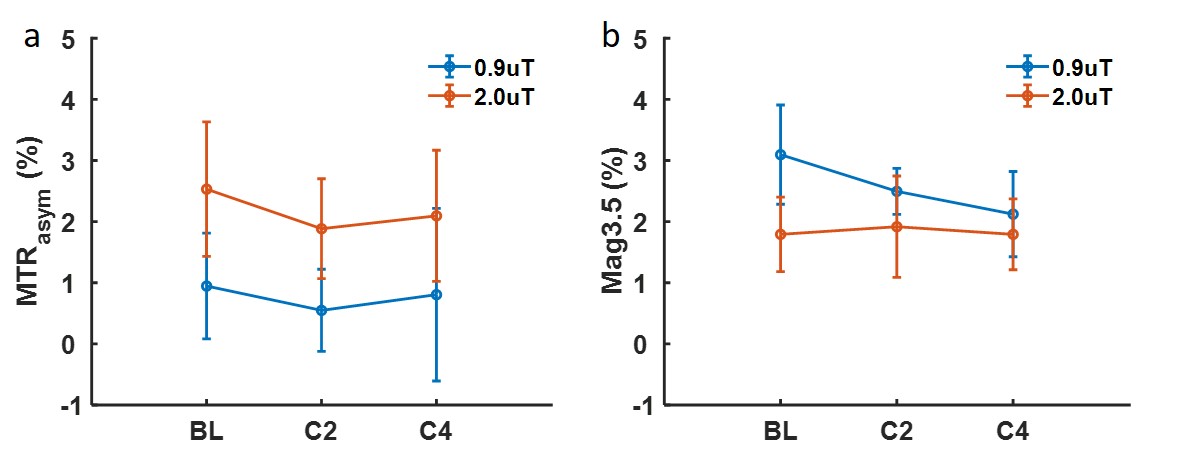
Figure 5. MTRasym averaged in 3.0 –
4.0 ppm of two power levels from BL to C4 (a). Magnitude of the fitted
Lorentzian line at 3.5 ppm of two power levels from BL to C4 (b).