3120
Application of GluCEST in monitoring abnormal glutamate dehydrogenase activity in Hyperinsulinism/Hyperammonemia (HI/HA) syndrome at 7.0T1Radiology, Perelman School of Medicine at The University of Pennsylvania, Philadelphia, PA, United States, 2Division of Endocrinology and Diabetes, Children's Hospital of Philadelphia, Philadelphia, PA, United States
Synopsis
Hyperinsulinism/Hyperammonemia (HI/HA) syndrome is an orphan disease characterized by fasting and protein-induced hypoglycemia, hyperammonemia, and has high prevalence of epilepsy, developmental delays, and learning disabilities. Understanding the mechanism involved in brain phenotype remains limited. Glutamate weighted chemical exchange saturation transfer (GluCEST) imaging was used to spatially map the glutamate levels of hippocampus. We observed a higher GluCEST contrast in the hippocampus of some of these subjects following a unilateral pattern. This preliminary study demonstrates for the first time the application of GluCEST MRI for studying the abnormal function of glutamate dehydrogenase (GDH) enzyme activity in human subjects with HI/HA syndrome.
Introduction
Hyperinsulinism/Hyperammonemia (HI/HA) syndrome is the second most common form of congenital HI and is caused by activating mutations in GLUD1, which encodes glutamate dehydrogenase (GDH)1-7. GDH is a mitochondrial enzyme expressed not only in pancreas but also in kidneys, liver and brain8-12. It is highly regulated in humans and is allosterically inhibited by GTP whereas it is allosterically activated by ADP, ATP and leucine13-18. In HI/HA subjects GDH is less sensitive to GTP inhibition, resulting in higher concentrations of alpha-ketoglutarate and this reaction is bidirectional, at least in some tissues. In the pancreatic beta cell, where the reaction is unidirectional, activating mutations in GDH causes excessive and inappropriate insulin secretion, resulting from excessive conversion of glutamate to alpha-ketoglutarate which enters the tricarboxylic acid (TCA) cycle and produces adenosine-triphosphate (ATP). The hyperammonemia results from the effect of the activating mutation in the kidney7. Children with HI/HA syndrome suffer from recurrent hypoglycemia due to inappropriate secretion of insulin and also have persistent HA from which they appear to be asymptomatic7. They are also susceptible to epileptic seizures, developmental delays and learning disabilities. Since there is only limited pathophysiological understanding of the central nervous system (CNS) manifestations, current therapies are limited only to treat the HI, but not the HA or brain manifestations. Chemical Exchange Saturation Transfer (CEST) imaging of glutamate (GluCEST) has gained importance in the recent years and its applications in vivo in human studies such as temporal lobe epilepsy, brain gliomas and in early psychosis are promising19-22. This is the first study to use GluCEST MRI to investigate the abnormal functioning of GDH enzyme activity in human subjects with HI/HA syndrome.Methods
Eight subjects (4M/4F; mean age: 28.1 years; range 16-56 years) with HI/HA syndrome, participated in the approved IRB study. GluCEST MRI was acquired on each subject using a 7.0T Siemens scanner with a 32-Channel phased-array head coil. For 2D GluCEST, an axial slice was selected and imaging parameters were, slice-thickness=5mm, in-plane resolution=1x1mm2, matrix size=208x256, B1rms=3.06μT, pulse duration=800ms (series of 100ms pulses), single shot GRE read out TR/TE=6.2/2.4ms, BW=560Hz/pixel, number of shots=2, averages=2, and shotTR=8000ms. Raw CEST images were acquired at varying saturation offset frequencies from ±1.8 to ±4.2ppm (relative to water resonance set as 0ppm) with a step-size of ±0.3ppm. For MTR, ±20 and ±100 ppm offsets were also acquired. Water saturation shift referencing (WASSR) images (from ±0 to ±1.5ppm with a step-size of ±0.15ppm) with a saturation pulse at B1rms of 0.29μT with 200ms duration were collected to compute B0 map23. Relative B1 map was generated from the three images obtained using square preparation pulses with flip-angles 20°, 40° and 80°. Overall, acquisition time for CEST, WASSR and B1 together was ~15min. MP2RAGE which is a 2D multi-slice Siemens product sequence was used with the same spatial parameters as described for CEST to generate a T1 map which is used for segmentation of gray matter, white matter and CSF. The B0 and B1-corrected GluCEST contrast map was then averaged for the region of interests (ROIs) drawn on hippocampus.Results
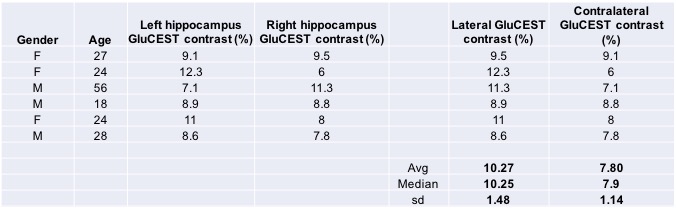
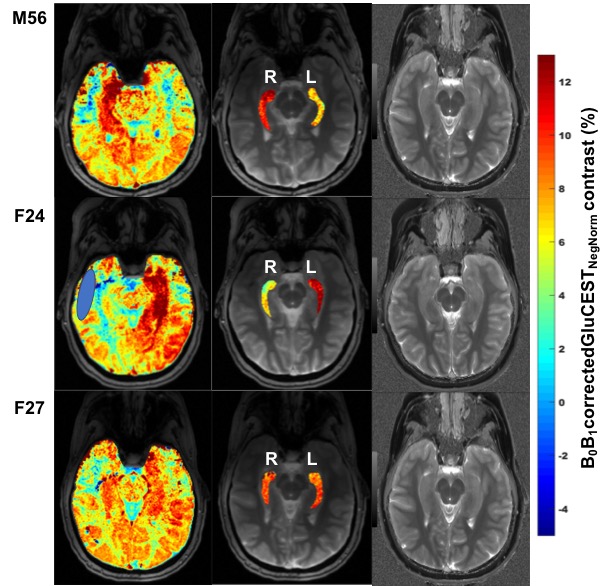
GluCEST contrast values from all the six volunteers for the ROIs drawn on left and right hippocampal regions are shown in Figure 1. Rest of the two volunteers, the data were not usable due to severe motion artifacts. Representative B0 and B1-corrected GluCEST map of a parent and both of his offspring are shown in Figure 2. On the lateral side (here on, the side where GluCEST contrast was higher) of hippocampus, the median GluCEST contrast was 10.25±1.48% (range 8.6 – 12.3%) whereas on the contralateral side of hippocampus, the median GluCEST contrast was 7.9±1.14% (range 6 – 9.1%). Since the sample size is small and not normally distributed, we have reported median values, although these do not differ from the means reported in Figure 1.Discussion
GluCEST imaging has been previously implemented in the study of some of the diseases hypothesized to be due to excitotoxicity such as temporal lobe epilepsy (TLE), early psychosis and in brain gliomas. But in the HI/HA syndrome, we hypothesize that the increase in glutamate we observe may be due to the overactivity in the GDH enzyme which is bidirectional. Since this enzyme is also overexpressed in hippocampus24 which is a region for memory we have applied the GluCEST on this slice. The magnitude of measured change in GluCEST contrast in hippocampus we have observed in this small set of subjects is higher than that observed in the TLE subjects20. One reason could be the saturation of the downstream enzymes involved in the conversion of alpha-ketoglutarate and ammonia that could potentially favor the conversion back to glutamate although this saturation of downstream enzymes hypotheses needs to be proven.Conclusion
This preliminary study demonstrates for the first time the application of GluCEST MRI for studying glutamergic changes, presumably due to GDH enzyme activity in human subjects with HI/HA syndrome. This opens the door to further understand the mechanisms involved in the brain phenotype of this orphan disease and may aid in the development of new therapies in this unexplored area.Acknowledgements
This project was supported by the National Institute of Biomedical Imaging and Bioengineering of the National Institute of Health through grant number p41-EB015893, the National Institute of Neurological Disorders and Stroke through grant number R01NS087516, the Children’s Hospital of Philadelphia Frontier Program for the Advancement of Hyperinsulinism Care and Research, The University of Pennsylvania Center for Magnetic Resonance Imaging and Spectroscopy, and NIH T32 DK063688 (ER).References
1. Zammarchi E, Filippi L, Novembre E, et al. Biochemical evaluation of a patient with a familial form of leucine-sensitive hypoglycemia and concomitant hyperammonemia. Metabolism 1996;45(8):957-960.
2. Weinzimer SA, Stanley CA, Berry GT, et al. A syndrome of congenital hyperinsulinism and hyperammonemia. J Pediatr. 1997;130(4):661-664.
3. Stanley CA, Lieu YK, Hsu BYL, et al. Hyperinsulinism and hyperammonemia in infants with regulatory mutations of the glutamate dehydrogenase. N Eng J Med. 1998;338:1352-1357.
4. Yorifuji T, Muroi J, Uematsu A, et al. Hyperinsulinism-hyperammonemia syndrome caused by mutant glutamate dehydrogenase accompanied by novel enzyme kinetics. 1999;104:476-479.
5. Miki Y, Tomohiko T, Obura T. Novel missense mutations in the glutamate dehydrogenase gene in the congenital hyperinsulinism-hyperammonemia syndrome. J Pediatr 2000;136:69-72.
6. Stanley CA, Fang J, Kutyna K, et al. Molecular basis and characterization of the hyperinsulinism/hyperammonemia syndrome: predominance of mutations in exons 11 and 12 of the glutamate dehydrogenase gene. Diabetes 2000;49:667-673.
7. Kelly A, Stanley CA. Disorders of glutamate metabolism. MRDD Research Reviews 2001;7:287-295.
8. Schmidt E, Schmidt FW. Distribution pattern of several enzymes in human liver and its variations during cell damage.III: on the methodology of enzyme determination in human organ extracts and serum. Enzymol Biol Clin. 1963;35:73-79.
9. Shashidharan P, Michaelidis TM, Robakis NK, et al. Novel human glutamate dehydrogenase expressed in neural and testicular tissues encoded by an X-linked intronless gene. J Biol Chem. 1994;269:16971-16976.
10. Spanaki C, Zaganas I, Kleopa KA, et al. Human GLUD2 glutamate dehydrogenase is expressed in neural and testicular supporting cells. J Biol Chem 2010;285(22):16748-16756.
11. Spanaki C, Kotzamani D, Petraki Z, et al. Heterogeneous cellular distribution of glutamate dehydrogenase in brain and in non-neural tissues. Neurochem Res. 2014;39(3):500-515.
12. Treberg JR, Banh S, Pandey U, et al. Intertissue differences for the role of glutamate dehydrogenase in metabolism. Neurochem Res. 2014;39(3):516-526.
13. Smith EL. The evolution of glutamate dehydrogenases and a hypothesis for the insertion or deletion of multiple residues in the interior of polypeptide chains. Proc Am Philos Soc. 1979;123:73-84.
14. Hudson RC, Daniel RM. L-glutamate dehydrogenases: distribution, properties and mechanism. Comp Biochem Physiol 1993;106:767-792.
15. Wrzeszczynski KO, Colman RF. Activation of bovine liver glutamate dehydrogenase by covalent reaction of adenosine 5’-O-S-4-bromo-2,3-dioxobutylthiophosphate with arginine-459 at an ADP regulatory site. Biochemistry 1994;33:11544-11553.
16. Cho SW, Ahn JY, Lee J, et al. Identification of a peptide of the guanosine triphosphate binding site within brain glutamate dehydrogenase isoproteins using 8-azidoguanosine triphosphate. Biochemistry 1996;35:13907-13913.
17. Gylfe E. Comparison of the effects of leucine, non-metabolizable leucine-analogues, and other insulin secretagogues on the activity of glutamate dehydrogenase. Acta Diabetol Lat 1976;13:20-24.
18. Fahien LA, MacDonald MJ, Kmiotek EH, et al., Regulation of insulin release by factors that also modify glutamate dehydrogenase. J Biol Chem. 1980;263:13619-13614.
19. Cai K, Haris M, Singh A, et al. Magnetic resonance imaging of glutamate. Nat Med. 2012;18(2):302-6.
20. Davis KA, Nanga RPR, Das S, et al. Glutamate imaging (GluCEST) lateralizes epileptic foci in nonlesional temporal lobe epilepsy. Sci Transl Med. 2015;7(309):309ra161.
21. Roalf DR, Nanga RPR, Rupert PE, et al. Glutamate imaging (GluCEST) reveals lower brain GluCEST contrast in patients on the psychosis spectrum. Mol Psychiatry. 2017;22(9):1298-1305.
22. Neal A, Moffat BA, Stein JM, et al. Glutamate weighted imaging contrast in gliomas with 7Tesla magnetic resonance imaging. Neuroimage Clin. 2019;22:101694.
23. Kim M, Gillen J, Landman BA, et al. Water saturation shift referencing (WASSR) for chemical exchange saturation transfer (CEST) experiments. Magn Reson Med. 2009;61(6):1441-50.
24. Rothe F, Schmidt W, Wolf G. Postnatal changes in the activity of glutamate dehydrogenase and aspartate aminotransferase in the rat nervous system with special reference to the glutamate transmitter metabolism. Brain Res. 1983;313:67-74.
Figures