3119
Inulin as a biodegradable contrast agent for CEST MRI1Department of Medical Radiation Physics, Lund University, Lund, Sweden, 2Procivitas, Malmö, Sweden, 3Department of Diagnostic Radiology, Lund University, Lund, Sweden, 4Lund University Bioimaging Center, Lund University, Lund, Sweden, 5Department of Clinical Physiology, Clinical Sciences, Lund University and Lund University Hospital, Lund, Sweden, 6Laboratory of Computing and Medical Informatics, School of Medicine, Aristotle University of Thessaloniki, Thessaloniki, Greece, 7Russell H. Morgan Department of Radiology and Radiological Science, Johns Hopkins University School of Medicine, Baltimore, MD, United States, 8F.M. Kirby Research Center for Functional Brain Imaging, Kennedy Krieger Institute, Baltimore, MD, United States
Synopsis
GlucoCEST (chemical exchange saturation transfer imaging using glucose as a contrast agent) has shown potential in tumor imaging. However, glucose enters cells and is rapidly metabolized, leading to disappearance of the glucoCEST signal over time. Inulin, a polysaccharide, is non-toxic and acts like an intravascular tracer when injected intravenously. A phantom including both glucose and inulin at different pH and concentrations was scanned at 3T to investigate the potential of inulin as a CEST agent. This study indicates that inulin shows CEST contrast comparable to glucose on a per-OH-unit basis and has potential as a biodegradable CEST agent.
Introduction
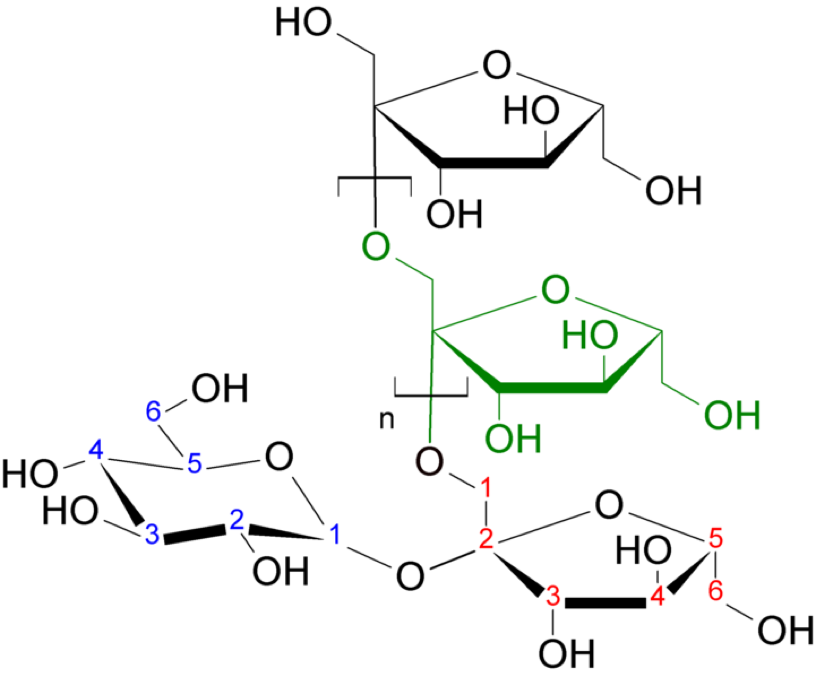
Recently, glucoCEST (chemical exchange saturation transfer imaging using glucose as a contrast agent) has shown potential in tumor imaging 1-4. Although promising, the glucoCEST method has drawbacks including a low CEST effect at clinical field strengths (~1% of the water signal), sensitivity to patient motion 5, and sensations related to the glucose injection 6. Also, since the blood glucose level increases during and after administration of glucose, the glucoCEST method may not be suitable for diabetic patients. Therefore, we investigated the potential of inulin as a biodegradable CEST agent. The structure and chemical formula of inulin are included in Figure 1. Inulin is a polysaccharide (a collection of fructose polymers with a terminal glucose molecule) that is not naturally abundant in the human body. It is non-toxic and considered as gold standard method to measure glomerular filtration rate in renal function studies. Inulin is non-metabolizable and does not cross the blood-brain barrier 7; hence, it has potential as an intravascular tracer 8. Inulin is rapidly excreted in urine 9 (within hours) and has minimal impact on blood glucose levels 10. Important for its CEST properties, glucose has five -OH groups per ring, while inulin has three per fructosyl and five in the terminating glucosyl ring.Methods
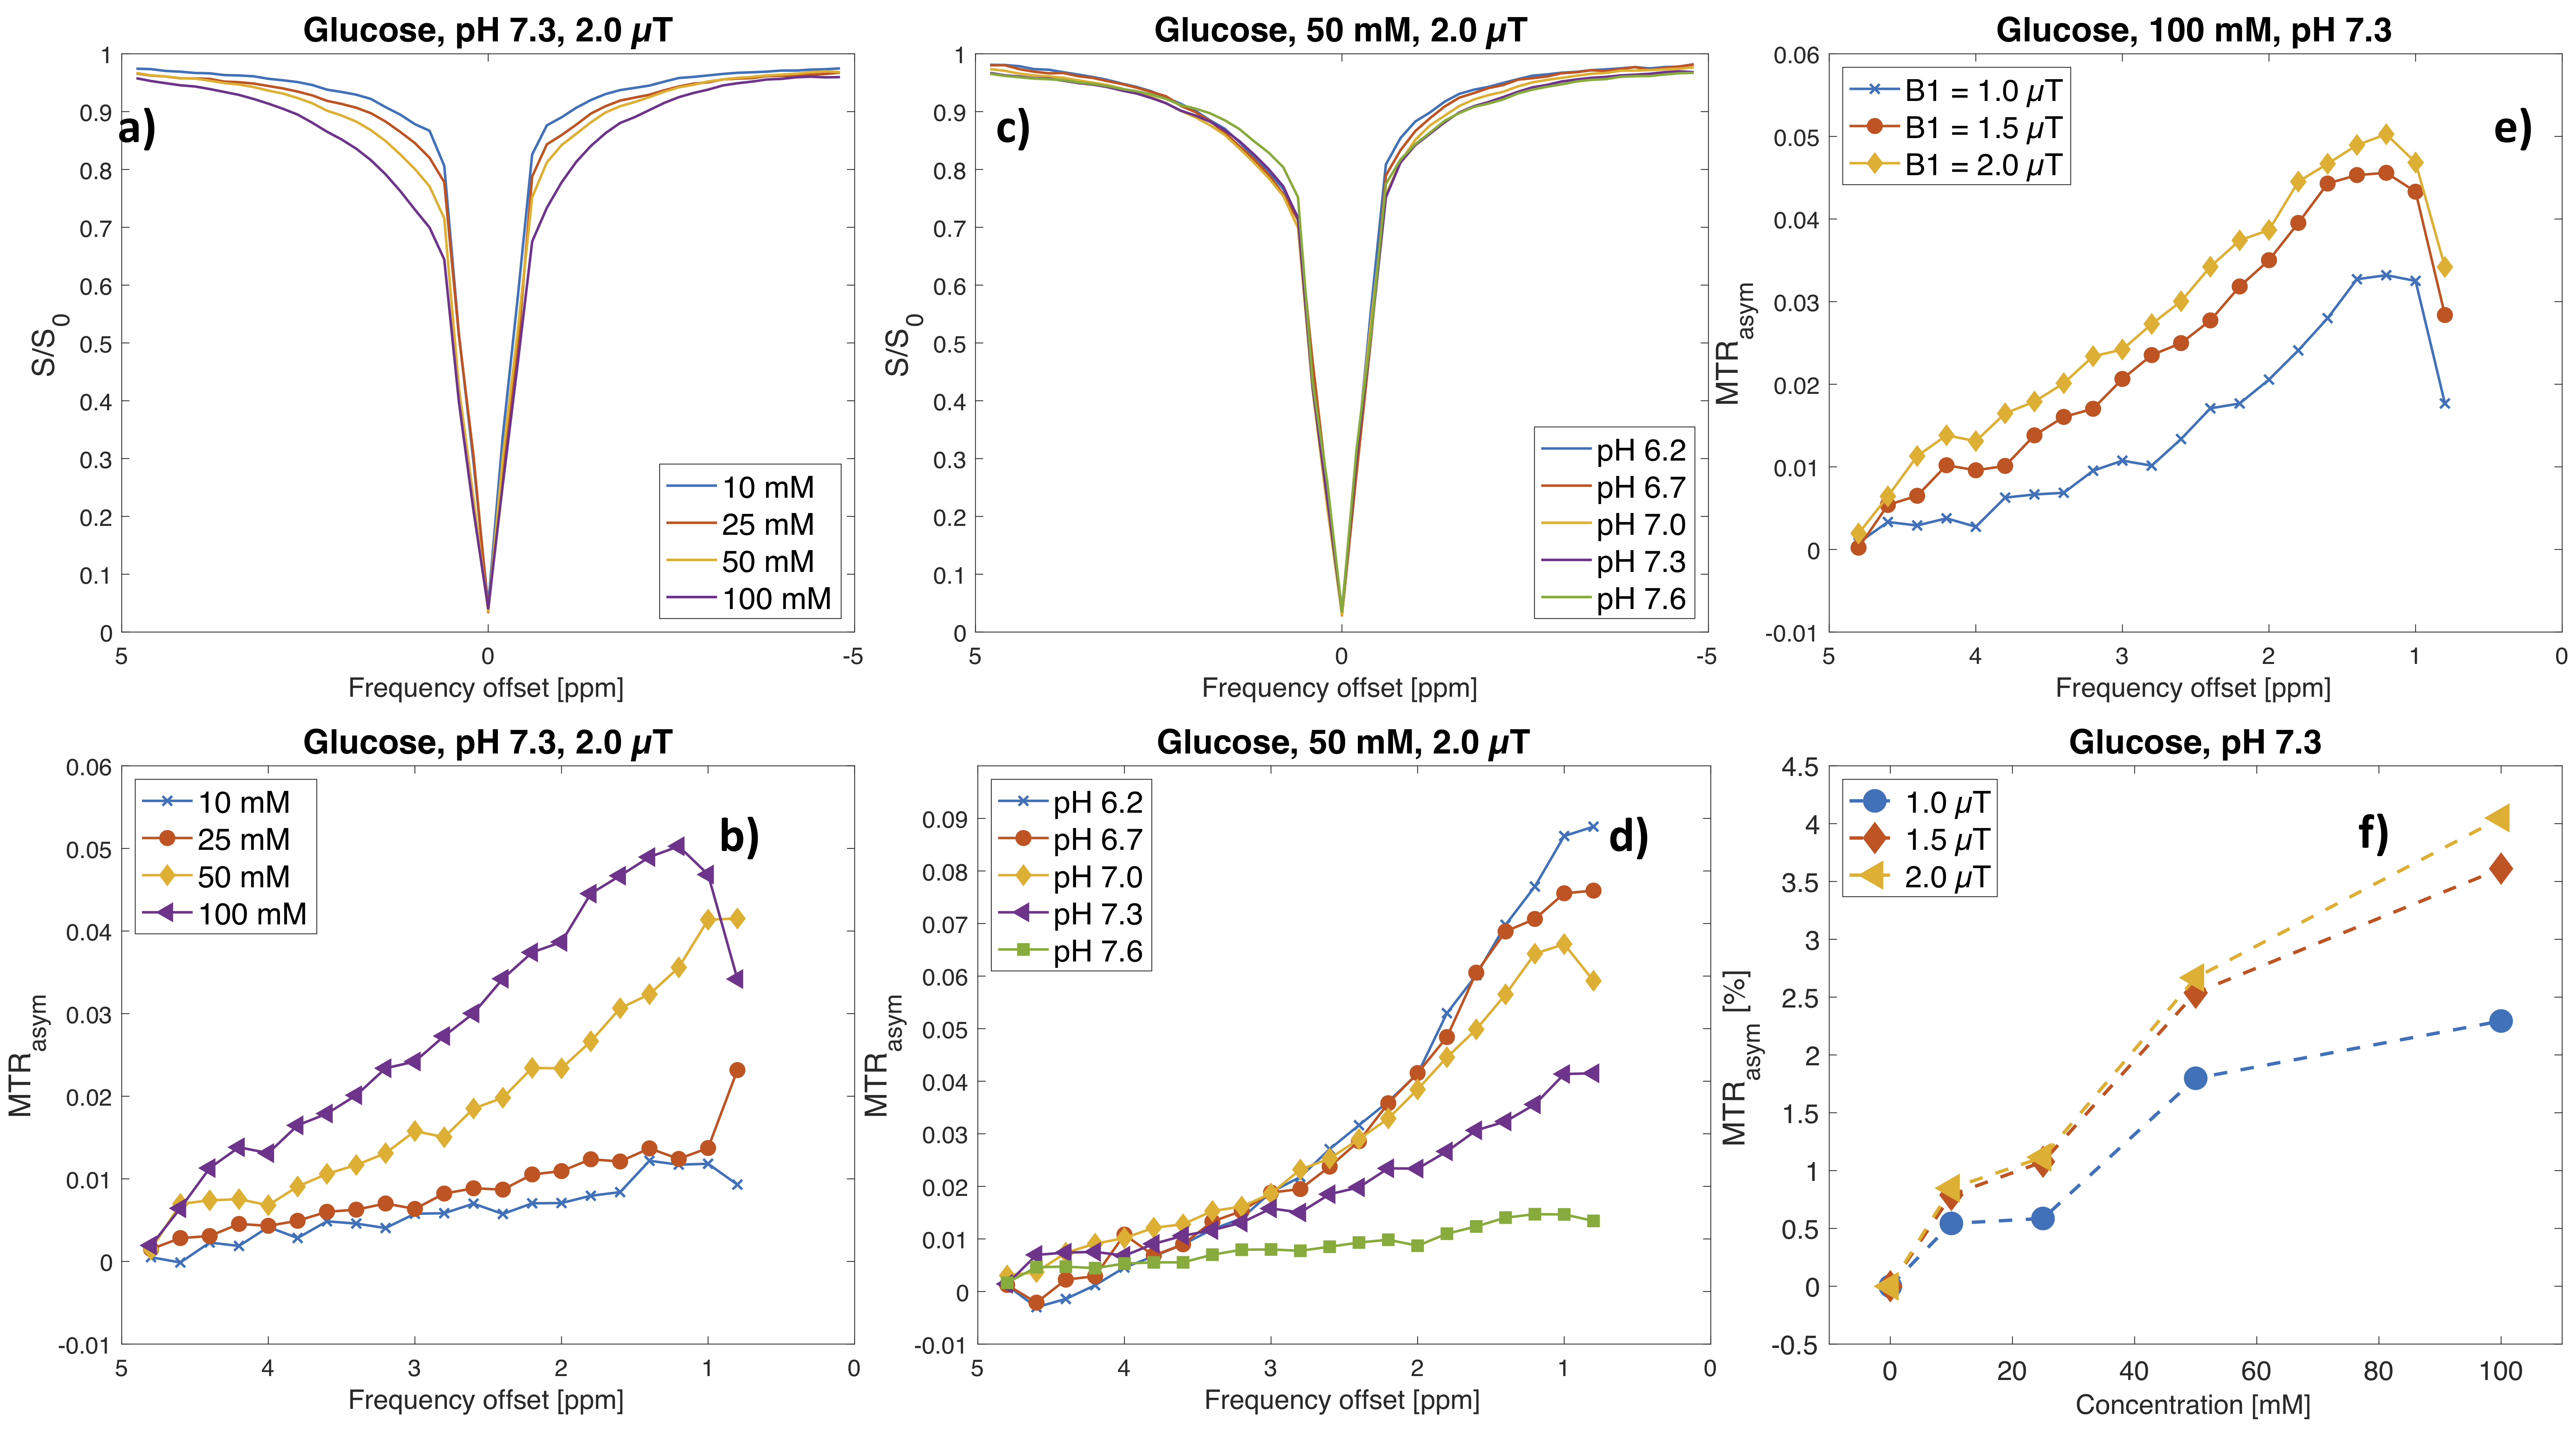
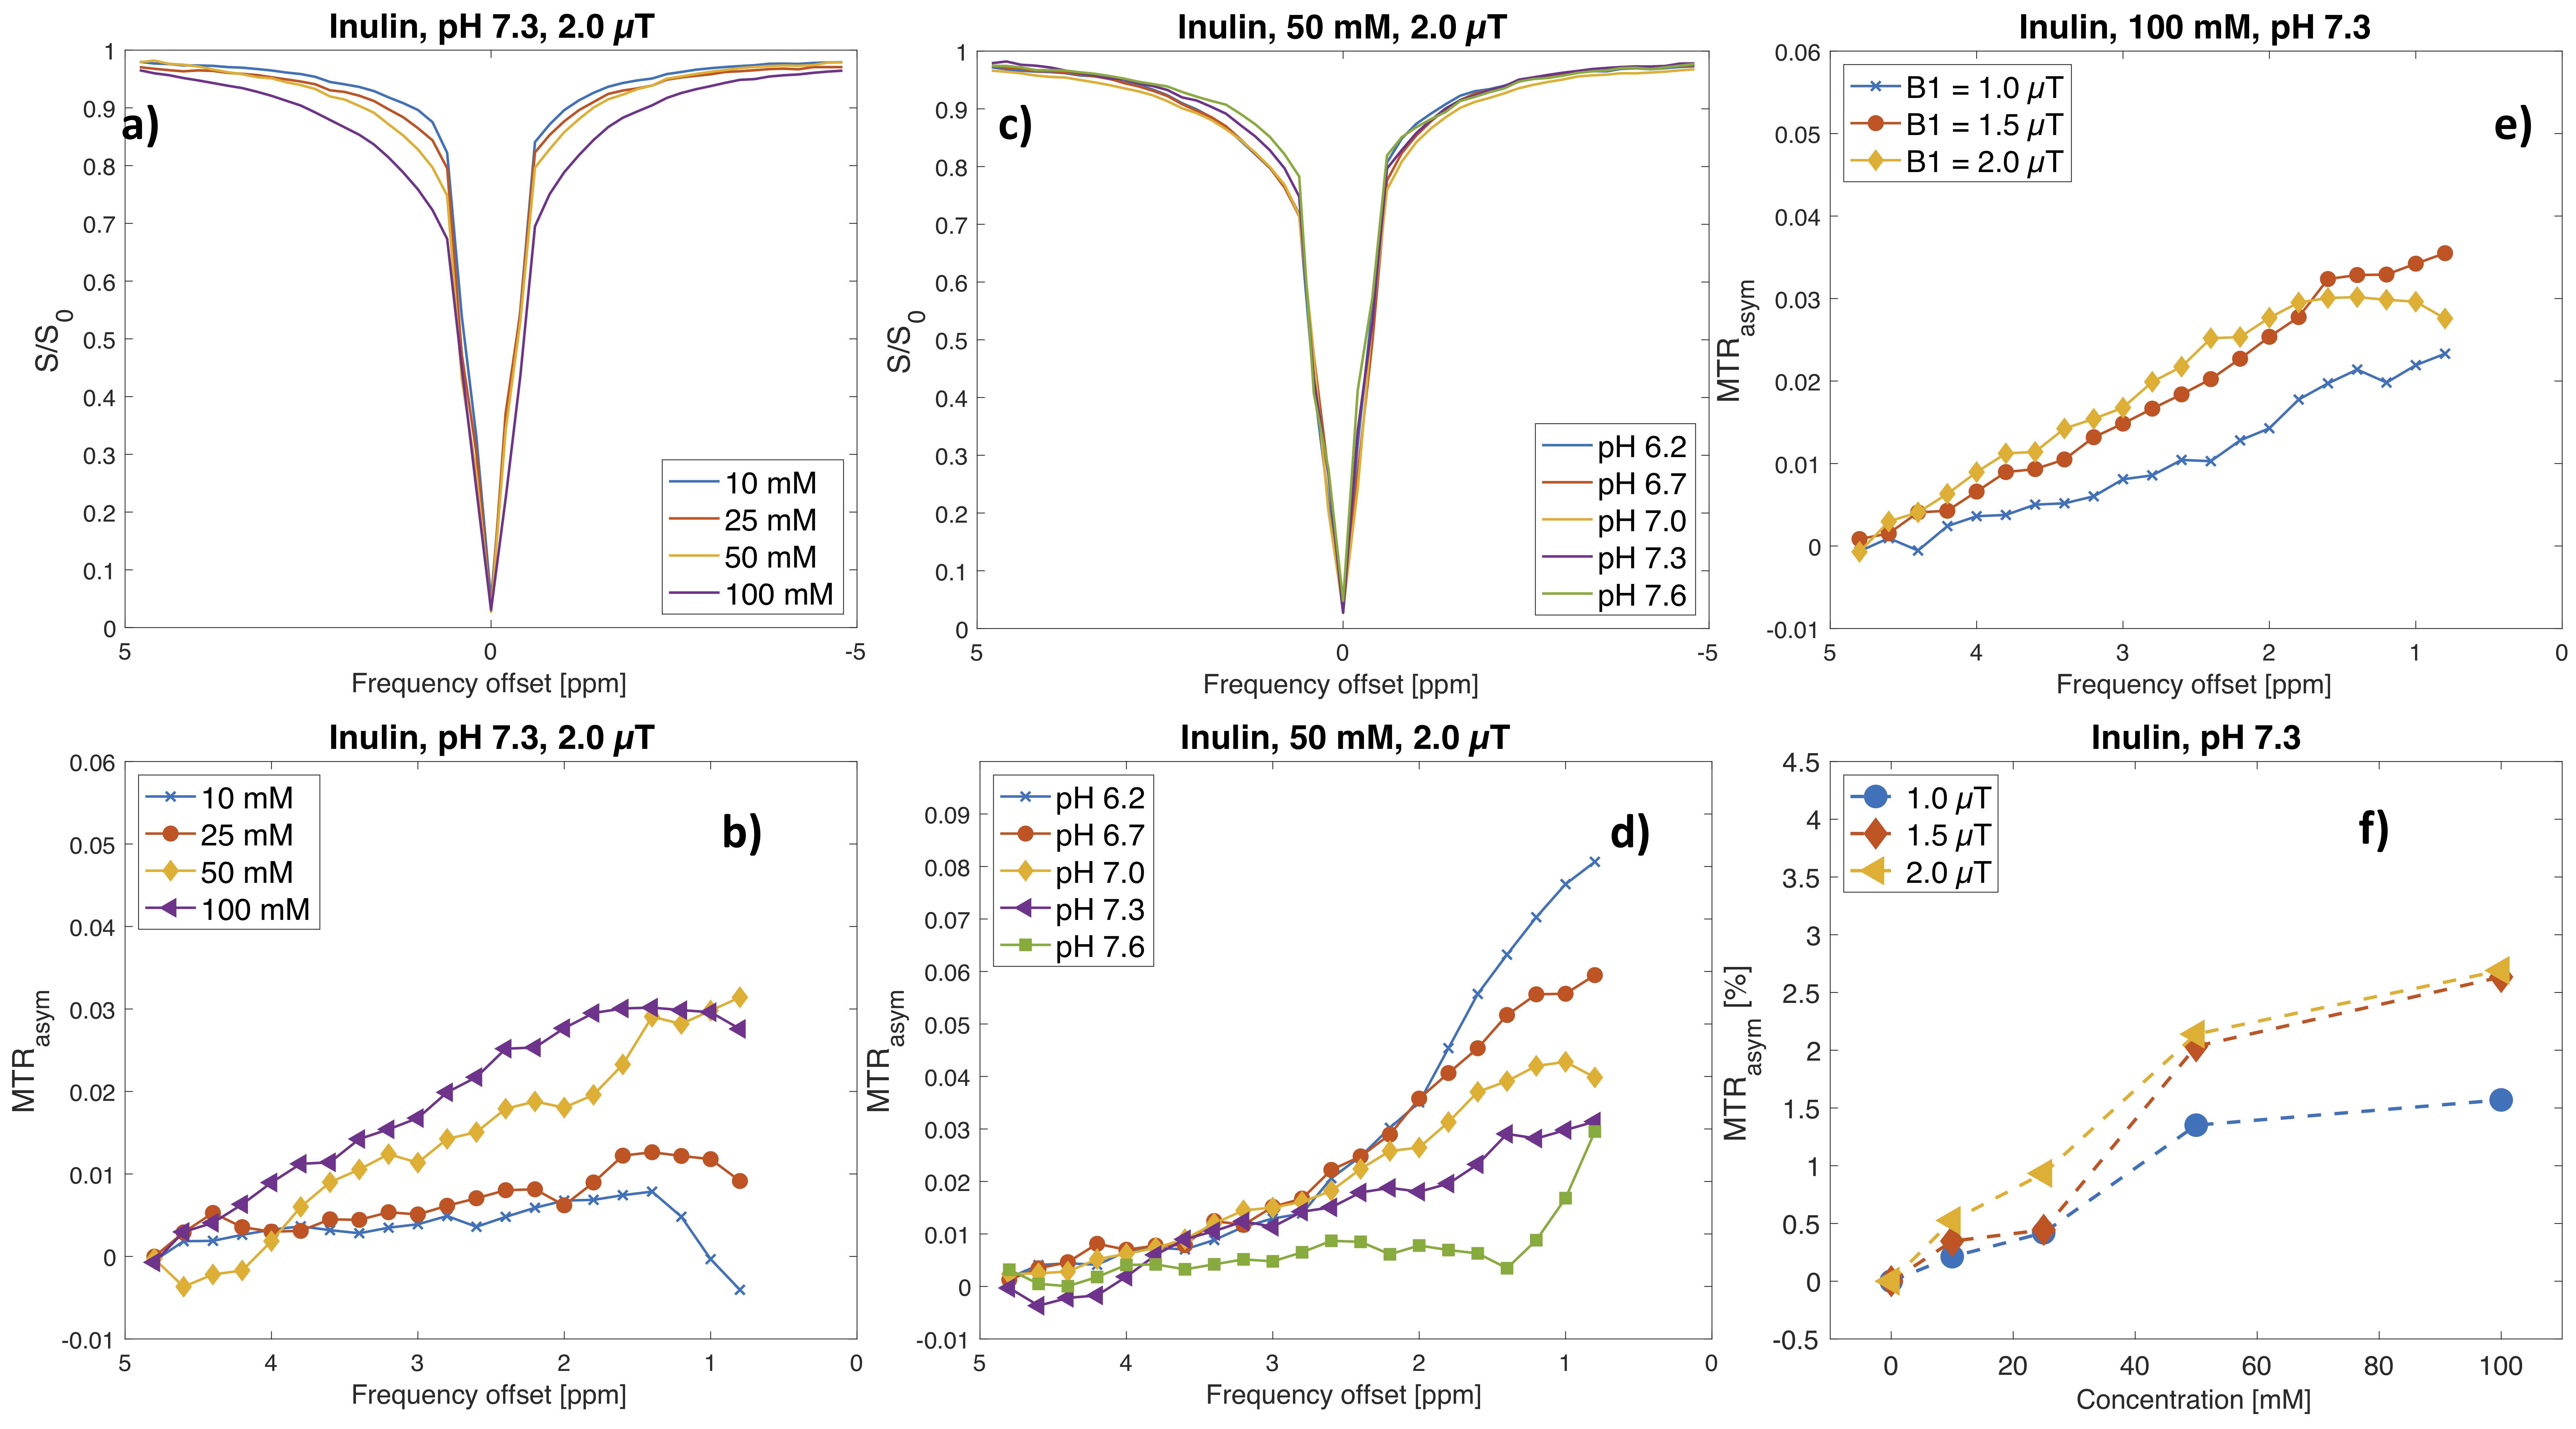
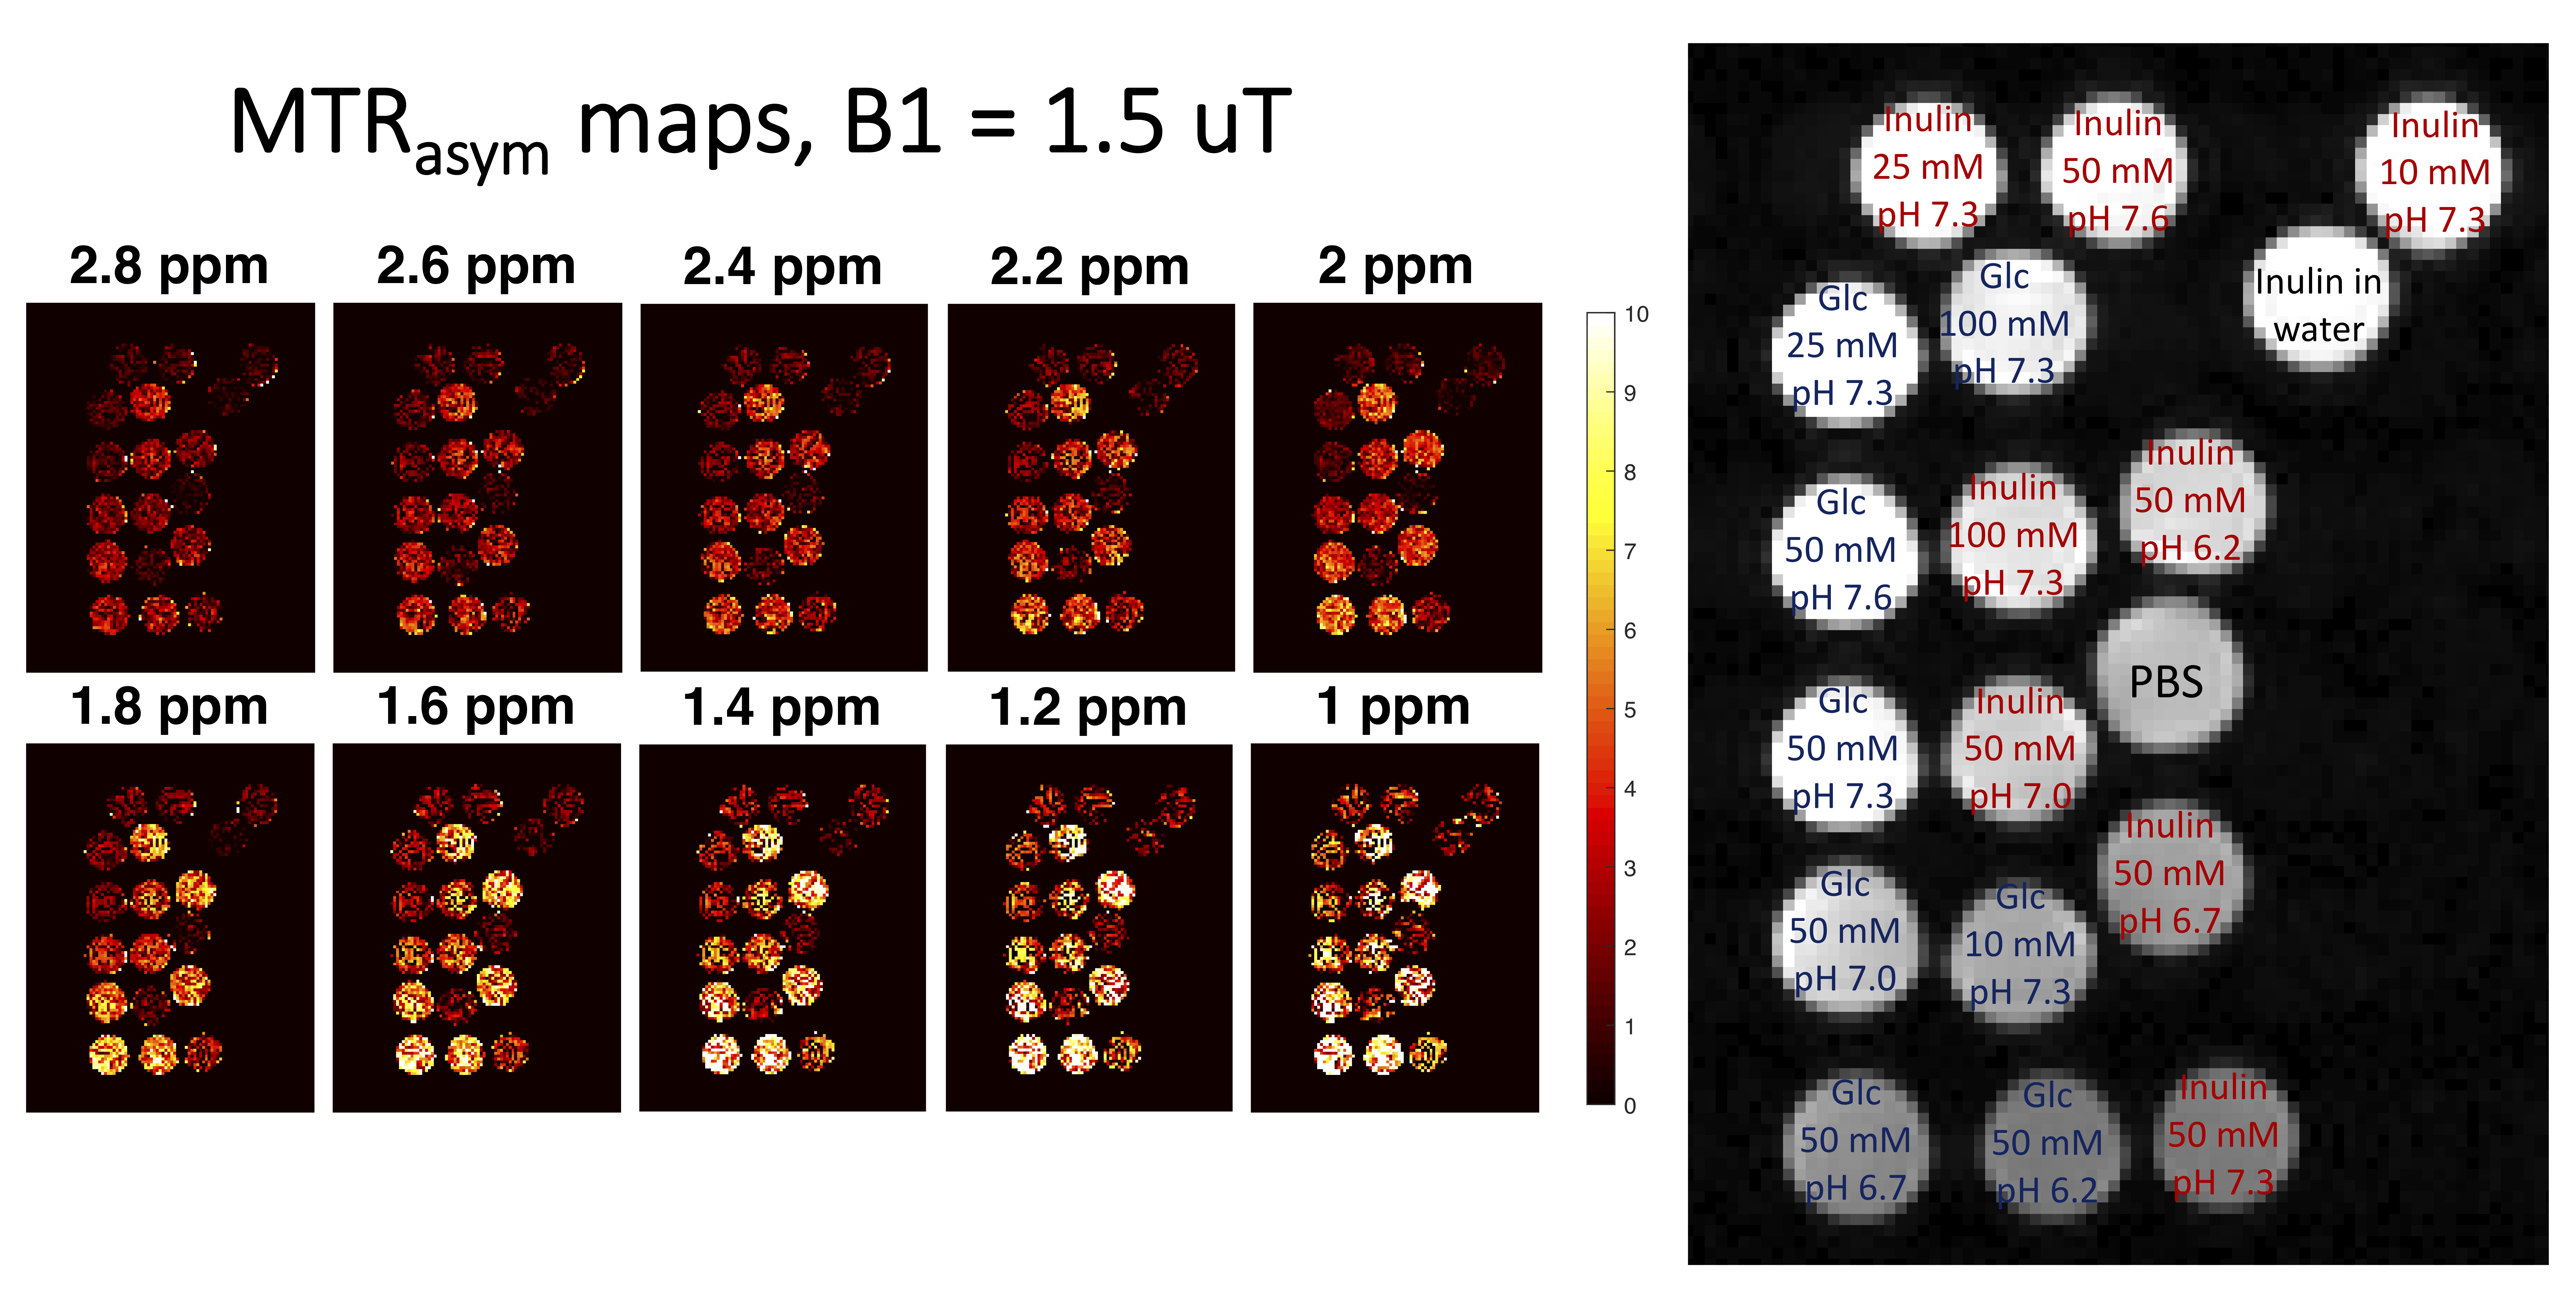
A series of solutions was prepared by dissolving glucose (C6H12O6) and inulin (C6nH10n+2O5n+1) in phosphate-buffered saline (PBS) in 40 ml tubes, at concentrations of 10 mM (pH 7.3), 25 mM (pH 7.3), 50 mM (pH 6.2, 6.7, 7.0, 7.3 and 7.6) and 100 mM (pH 7.3) per ring unit, and one tube with PBS. All tubes were combined into one phantom. The phantom was imaged at room temperature with a 3T MAGNETOM Prisma MR system (Siemens Healthcare, Erlangen, Germany) using a prototype CEST sequence with gradient echo readout and TR/TE/FA = 735 ms/1.96 ms/10°. The spatial resolution was 2x2x6 mm3, and a single slice was imaged. CEST Z-spectra were collected using saturation at 49 frequency offsets ranging from -4.8 to 4.8 ppm relative to the water frequency, with three different B1 values (1.0, 1.5, and 2.0 µT). The saturation duration was 0.5 seconds, consisting of five 100 ms hyperbolic secant pulses with 61 ms interpulse delays. The total image acquisition time was 9 minutes. B0-correction was performed by finding the position for the lowest signal intensity in each voxel and centering the Z-spectrum by moving the lowest intensity value to 0 ppm. The CEST contrast was quantified using a magnetization transfer ratio asymmetry (MTRasym) analysis relative to the water frequency over the saturation frequency offset range 0.8-4.8 ppm:$$\text{MTR}_{\text{asym}}(Δω) = \frac{S(−Δω) − S(Δω)}{S_0},$$
where $$$S$$$ is the signal intensity for each saturation frequency offset ($$$Δω$$$), and $$$S_0$$$ is an image without saturation. The ratio between the averaged inulin and glucose MTRasym value in the range 1.0-1.4 ppm, referred to as $$$r_{\text{MTR}_{\text{asym}}}$$$,was calculated for the different concentrations at pH 7.3 and B1 = 2 µT. This ratio was compared to the ratio between the number of -OH groups in inulin and glucose, respectively (about ⅗ = 0.6).
Results
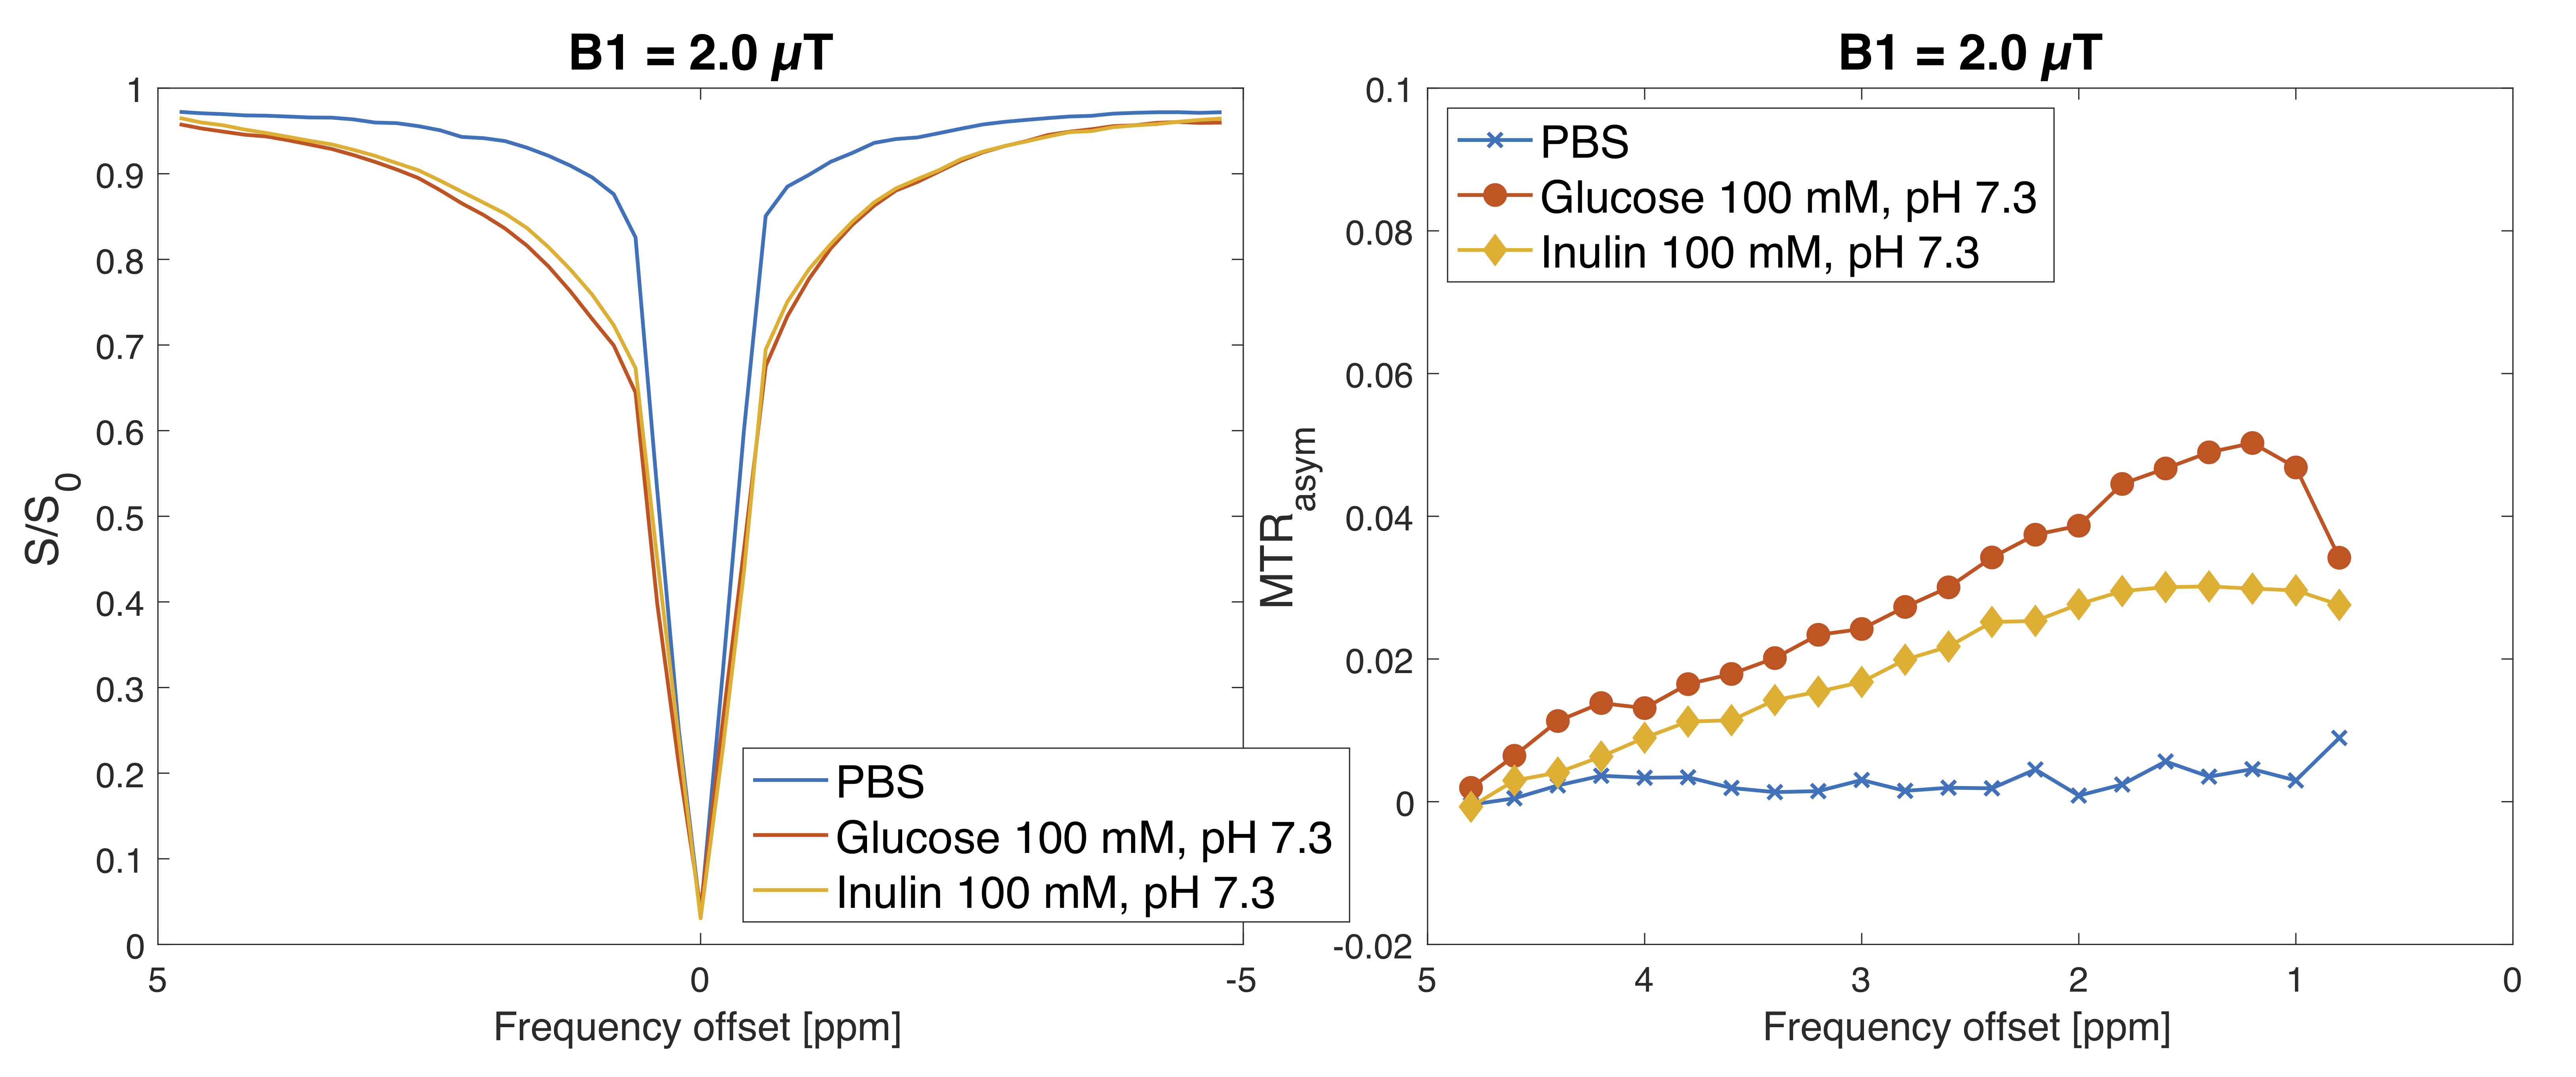
Figures 2 and 3 include Z-spectra and MTRasym spectra for the different concentrations and pH values, and MTRasym spectra for the different B1 values for glucose and inulin, respectively. For visual comparison, Z-spectra and MTRasym spectra for glucose, inulin and PBS are presented in Figure 4. The ratio $$$r_{\text{MTR}_{\text{asym}}}$$$was 0.6 for 100 mM and 0.7 for 50 mM. For lower concentrations, this was hard to evaluate accurately due to low SNR. MTRasym maps of the phantom can be found in Figure 5, showing higher intensity for higher concentrations and lower pH.Discussion
As expected, based on the number of exchangeable protons per ring, inulin had a lower MTRasym value (on average 30% lower than glucose) per ring unit, but a similar pH-, B1- and concentration-dependence as well as chemical shift as glucose. The ratio $$$r_{\text{MTR}_{\text{asym}}}$$$was reasonably close to the theoretical ratio (0.6) for the higher concentrations (100 mM and 50 mM), but not for the lower concentrations. MTR asymmetry analysis is a poor measure of CEST effect magnitude for low concentrations. The reason is the broad -OH resonance seen on both sides of the water resonance due to the occurrence of fast exchange at 3T 11,12. However, this should not be a problem in dynamic glucose-enhanced 3-5 (DGE) imaging, which is performed by calculating difference images between a baseline (pre-injection) image and post-injection images saturated at one single frequency offset. The lower CEST signal from inulin could possibly be compensated by the fact that inulin is non-metabolizable and acts like an intravascular tracer, unlike glucose which enters the cells where it is metabolized. Inulin could thus have an advantage as a CEST MRI contrast agent since it is more similar to conventional contrast agents (e.g. gadolinium) meaning that the same tracer kinetic models could in principle be utilized.Conclusion
Inulin has CEST contrast comparable to glucose on a per-OH-unit basis and thus has potential as a biodegradable CEST agent. Inulin is expected to have advantages over glucose in vivo because it acts like an intravascular tracer, is not metabolized, and does not induce an insulin response.Acknowledgements
We thank Patrick Leibig at Siemens Healthcare AG, Germany, for providing the CEST prototype sequence as a work-in-progress package.References
1. Chan KW, McMahon MT, Kato Y, et al. Natural D-glucose as a biodegradable MRI contrast agent for detecting cancer. Magn Reson Med 2012;68(6):1764–1773.
2. Walker-Samuel S, Ramasawmy R, Torrealdea F, et al. In vivo imaging of glucose uptake and metabolism in tumors. Nat Med 2013;19(8):1067-72.
3. Xu X, Yadav NN, Knutsson L, et al. Dynamic glucose-enhanced (DGE) MRI: Translation to human scanning and first results in glioma patients. Tomography 2015;1(2):105-14.
4. Xu X, Chan KWY, Knutsson L, et al. Dynamic glucose enhanced (DGE) MRI for combined imaging of blood–brain barrier break down and increased blood volume in brain cancer. Magn Reson Med 2015; 74(6):1556-1563.
5. Zaiss M, Herz K, Deshmane A, et al. Possible artifacts in dynamic CEST MRI due to motion and field alterations. J Magn Reson 2019;298:16-22.
6. Knutsson L, Seidemo A, Rydhög Scherman A, et al. Arterial input functions and tissue response curves in dynamic glucose-enhanced (DGE) imaging: Comparison between glucoCEST and blood glucose sampling in humans. Tomography 2018 Dec;4(4):164-171.
7. The blood-brain barrier. Biology and research protocols - Edited by Nag, S. Humana Press, Totowa, NJ; 549 pages; 2003; ISBN 1-58829-073-5.
8. Morrison AB. The distribution of intravenously- injected inulin in the fluids of the nervous system of the dog and rat. J Clin Invest 1959;38(10):1769-1777.
9. Quantitative human physiology: An introduction. Feher, S. Academic Press. 960 pages; 2012; ISBN 978-0-12-382163-8.
10. Florijn KW, Barendregt JNM, Lentjes EWM, et al. Glomerular filtration rate measurement by "single-shot" injection of inulin. Kidney International 1994;46:252-259.
11. van Zijl PCM, Lam WW, Xu J, et al. Magnetization transfer contrast and chemical exchange saturation transfer MRI. Features and analysis of the field-dependent saturation spectrum. NeuroImage 2018;168;222-241.
12. Zaiss M, Anemone A, Goerke S, et al. Quantification of hydroxyl exchange of D‐Glucose at physiological conditions for optimization of glucoCEST MRI at 3, 7 and 9.4 Tesla. NMR in Biomedicine 2019;32:e4113.
Figures