3117
Accelerated 3D chemical exchange saturation transfer imaging using compressed SENSE for full Z-spectrum acquisition
Tatsuhiro Wada1, Chiaki Tokunaga1, Osamu Togao2, Masami Yoneyama3, Yasuo Yamashita1, Kouji Kobayashi1, Toyoyuki Kato1, and Hidetake Yabuuchi4
1Division of Radiology, Department of Medical Technology, Kyushu University Hospital, Fukuoka, Japan, 2Department of Clinical Radiology, Graduate School of Medical Sciences, Kyushu University, Fukuoka, Japan, 3Philips Japan, Fukuoka, Japan, 4Department of Health Sciences, Faculty of Medical Sciences, Kyushu University, Fukuoka, Japan
1Division of Radiology, Department of Medical Technology, Kyushu University Hospital, Fukuoka, Japan, 2Department of Clinical Radiology, Graduate School of Medical Sciences, Kyushu University, Fukuoka, Japan, 3Philips Japan, Fukuoka, Japan, 4Department of Health Sciences, Faculty of Medical Sciences, Kyushu University, Fukuoka, Japan
Synopsis
Multi-slice chemical exchange saturation transfer (CEST) imaging is difficult to use for clinical studies because data acquisition of the full z-spectrum is time-consuming. To accelerate the scan time for obtaining multi-slice CEST imaging, we applied the compressed sensing (CS) and sensitivity encoding (SENSE) technique (CS-SENSE) to 3D CEST imaging. The 3D CEST imaging combined with CS-SENSE was obtained without reducing the image contrast of the 2D CEST imaging. Moreover, 10 slice CEST images could be acquired in approximately 7 minutes including B0 map. 3D CEST imaging combined with CS-SENSE was shown to be useful for clinical study.
INTRODUCTION
Chemical exchange saturation transfer (CEST) imaging is based on the chemical exchange between free bulk water protons and solute protons which resonate at specific frequency.1 The CEST effects are evaluated using the z-spectrum generated by measuring the bulk water signal intensity after applying multiple radio frequency (RF) saturation frequency offsets. In acidoCEST, a form of exogenous CEST imaging using iopamidol, the ratio of the two CEST effects (amide proton resonates at +4.2 and +5.6 ppm from bulk water proton) can be used to reflect pH in a way that is independent from agent concentration.2,3 However, the 3D CEST imaging performed by completely measuring the z-spectrum is time-consuming due to the large number of RF saturation frequency offsets and multi-slice imaging. In a previous study, the acquisition time for 3D whole-brain CEST imaging was 14 min 24 sec.4 To reduce the MR imaging acquisition time, the acceleration method combined with a compressed sensing (CS) and sensitivity encoding (SENSE) technique (CS-SENSE) has been proposed. The purpose of this study was to examine the feasibility of 3D CEST imaging using the CS-SENSE method.METHODS
The CEST phantoms were prepared in seven vials containing different concentrations of iopamidol (Bayer Healthcare) mixed in phosphate buffered solution with different pH values (PBS). The four concentrations of iopamidol dissolved in PBS of pH 6.793–6.823 were 50, 100, 200 and 400 mM. The four pH values of PBS containing dissolved iopamidol at 100 mM were 6.034, 6.417, 6.798 and 7.235. CEST imaging were performed on 3T MR scanner (Ingenia 3.0T, Philips, Best, The Netherlands) using a 32-channel head coil. CEST imaging was acquired using four different parameters: 2D CEST imaging, and three different CS-SENSE factor 3D CEST imagings (Fig.1). In 3D CEST imaging, the three different CS-SENSE factors and TSE factor were modified for the same acquisition time. A dedicated plug-in was created to assess the z-spectrum and CEST ratio, equipped with a correction function for B0 inhomogeneity. The z-spectrum and CEST ratio were defined as: $$Z-spectrum= Ssat (∆ppm)/S0 [1]$$ $$CEST ratio=log_{10}[((S0-Ssat (+4.2 ppm))⁄Ssat (+4.2 ppm))/((S0-Ssat (+5.6 ppm))⁄Ssat (+5.6 ppm))] [2]$$ where Ssat (∆ppm) and S0 are the signal intensities at a target frequency and −1560 ppm, respectively. Regions-of-interest were placed in the seven vials.The agreement of the CEST ratios was assessed between 2D CEST imaging and each 3D method using a Bland-Altman plot analysis. The Pearson correlation coefficient was calculated to evaluate the dependence of pH and concentration of the CEST ratio in all methods. Values of p<0.05 were considered significant in all statistical analyses.
RESULTS
Figure 2 shows the z-spectrums obtained by the different methods used in this study. In 2D CEST imaging and all methods of 3D CEST imaging, the separation of peaks at +4.2 and +5.6 ppm was enabled at low pH phantoms and was difficult at high pH phantoms, and the CEST effect increased with concentration. The Bland-Altman plot analyses showed that the CEST ratio measured with the 3D CS 5 (Fig. 3a) resulted in a small bias of 0.04 and narrow 95% limits of agreement (from -0.06 to 0.13). Those measured with the 3D CS 7 (Fig. 3b) showed a larger bias of -0.05 and wider 95% limits of agreement (from -0.15 to 0.05) compare with those measured with CS 5. Those measured with the 3D CS 9 (Fig. 3c) showed a larger bias of -0.06 and wider 95% limits of agreement (from -0.23 to 0.11) compared with those measured with CS 5.The pH dependence of CEST ratios exhibited a very strong positive correlation in all methods (Fig. 4a). The concentration dependence of CEST ratios showed a positive correlation in 2D, 3D CS 5 and 3D CS 7, and a moderately negative correlation in 3D CS 9 (Fig. 4b). Figure 5 shows the CEST ratio images observed by the different methods. The signal intensity of the CEST ratio image varied with pH, but it was little affected by the concentration of iopamidol in all methods.
DISCUSSION
The 3D CEST imaging combined with CS-SENSE was able to obtain image quality nearly equivalent to that by 2D CEST imaging. However, the deviation of the CEST ratio between 2D CEST imaging and 3D CEST imaging was increased with CS-SENSE factor. These results were attributed to the decrease in the amount of acquisition data. The CS-SENSE enables a reduction in the readout time without decreasing the saturation pulse power and duration time, which are indispensable for the CEST effect. Moreover, shortening the readout time can increase the recovery time and reveal the recovery of saturated protons. In this study, the 2D CEST imaging required about 4 minutes including B0 map for 1 slice. On the other hand, the 3D CEST imaging with CS-SENSE required about 7 minutes including B0 map for 10 slices. The combination of 3D imaging and CS-SENSE is thus more clinically applicable than 2D CEST imaging for multiple slice acquisition due to the shorter scan time.CONCLUSION
The use of CS-SENSE could reduce the scan time and it enabled "3D" CEST imaging without losing the image contrast of 2D CEST imaging. The combination of 3D CEST with CS-SENSE can be applied to a clinical protocol.Acknowledgements
No acknowledgement found.References
- Ward KM, Aletras AH, Balaban RS. A new class of contrast agents for MRI based on proton chemical exchange dependent saturation transfer (CEST). J Magn Reson 2000;143(1):79-87.
- Chen LQ, Howison CM, Jeffery JJ, Robey IF, Kuo PH, Pagel MD. Evaluations of extracellular pH within in vivo tumors using acidoCEST MRI. Magn Reson Med 2014;72(5):1408-1417.
- Moon BF, Jones KM, Chen LQ, et al. A comparison of iopromide and iopamidol, two acidoCEST MRI contrast media that measure tumor extracellular pH. Contrast Media Mol Imaging 2015;10(6):446-455.
- Jones CK, Polders D, Hua J, et al. In vivo three-dimensional whole-brain pulsed steady-state chemical exchange saturation transfer at 7 T. Magn Reson Med 2012;67(6):1579-1589.
Figures

Fig. 1 The scan parameters of each imaging protocol.

Fig. 2
A comparison of the z-spectrums obtained with 2D and
each 3D CEST imaging. The z-spectrums of upper phantoms were obtained at
100 mM concentration, and those of lower phantoms were obtained at pH 6.793–6.823.
In all the methods, the CEST
effects were observed at +4.2 and +5.6 ppm in lower pH phantoms,
and they changed according to the pH condition (a-d); the CEST effects also
increased with concentration in each method (e-h).

Fig. 3
The Bland-Altman plot analyses of the comparison
between the 2D method and each 3D method. The CEST ratio measured with the 3D
CS-SENSE factor 5 showed a small bias and narrow limits of agreement (a). The
CEST ratio measured with the 3D CS-SENSE factor 7 (b) showed a larger bias and
wider 95% limits of agreement compared with that measured by CS-SENSE factor 5.
The ratio measured with the 3D CS-SENSE factor 9 (c) showed a larger bias and
wider 95% limits of agreement compared with that measured by CS-SENSE factor 5.
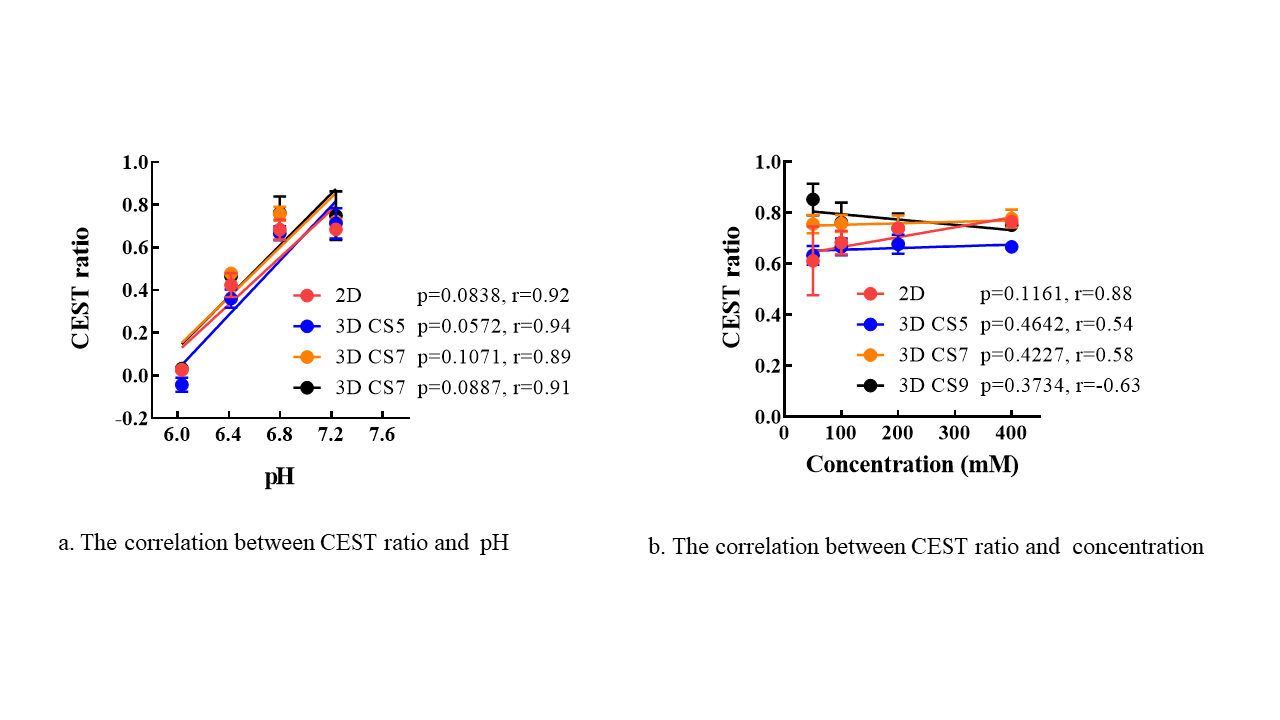
Fig. 4 Correlations between
the CEST ratio and pH (a) and the CEST ratio and concentration (b) under each
method. Strong positive correlations between the CEST ratio and pH were
obtained by all the methods (a). Positive correlations were observed for the
CEST ratios obtained by 2D, 3D CS-SENSE factor 5 and 3D CS-SENSE factor 7, and
negative correlations were observed for those obtained by 3D CS-SENSE factor 9
(b).
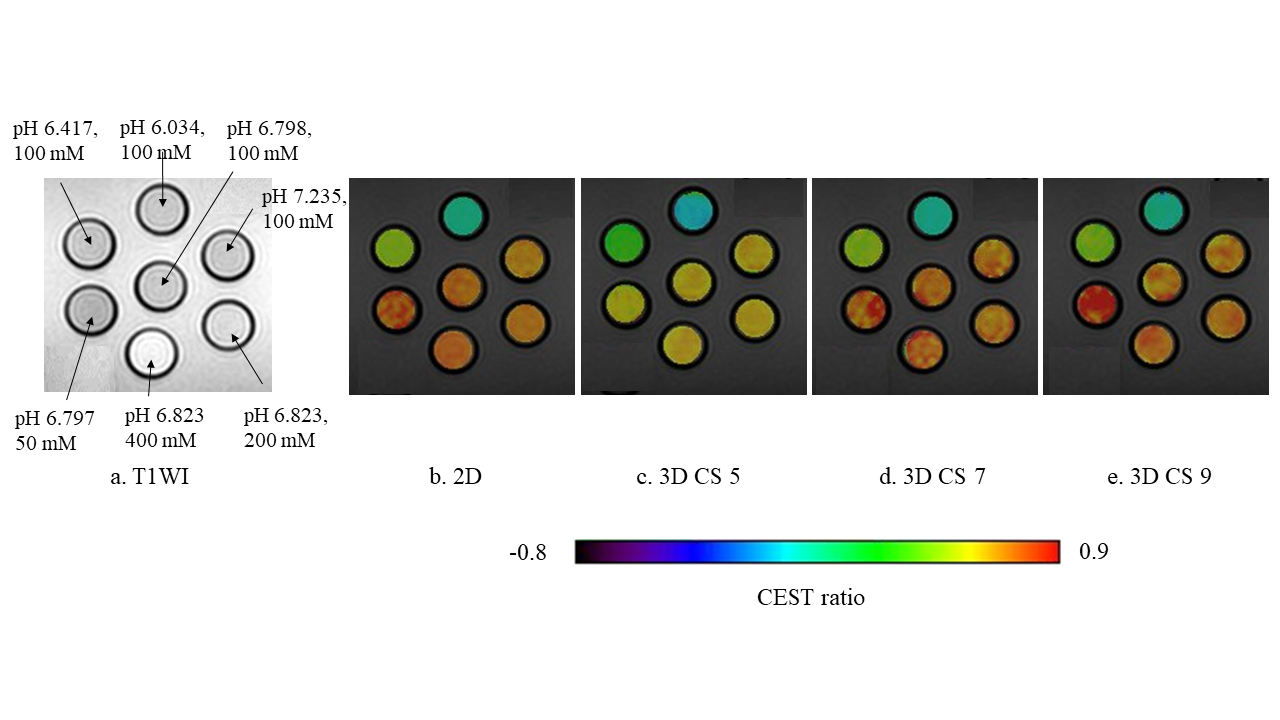
Fig. 5 The T1-weighted image
of the phantom (a) and CEST ratio images (b-e) were observed by all methods.
The signal intensity of the CEST ratio image varied with pH, but the intensity
was little affected by the concentration of iopamidol in all methods.