3116
Repeatability of Creatine Recovery Constants in Exercise Muscle Measured using 3D Creatine Chemical Exchange Saturation Transfer Imaging at 7T1Radiology, University of Pennsylvania, Philadelphia, PA, United States, 2Siemens Medical Solutions USA Inc, Malvern, PA, United States
Synopsis
Creatine CEST is a relatively new imaging technique, with the proven potential to assess the systemic energy deficiency in form of delayed creatine recovery in exercised skeletal muscles. However, this 2D method still suffers from limited volume coverage in slice encoding direction. Since the distribution of disease in many musculoskeletal disorders may vary across the muscle, there is a need to increase coverage in slice encoding direction. Towards this goal, we demonstrate the feasibility of 3D CrCEST, while still maintaining 30s time resolution necessary to capture underlying dynamics and also demonstrate its repeatability using data from five healthy volunteers.
Introduction
Systemic energy deficiency, traditionally measured as the delayed phosphocreatine (PCr) recovery, has been implicated in various disorders, such as primary mitochondrial disorders (1), muscle injury (2), cardiovascular disease (3) and diabetes mellitus (4). Traditionally 31P-MRS has been the preferred choice for measuring creatine kinase kinetics in exercised muscle, though it suffers from poor spatial resolution. Single slice 2D CrCEST, with slice thickness of 10-20 mm, was developed and optimized for 3T(5) and 7T(6) MRI scanners. Whereas 31P-MRS measures PCr time course in exercise muscle, CrCEST measures creatine level, a species in CK kinetics complementary to PCr (PCr + ADP + H+ ⇋ Cr + ATP). Further, 2D CrCEST was shown to capture systemic deficiency in genetic mitochondrial diseases (1). Though 3D coverage would have been very valuable in the case of many musculoskeletal diseases and disorders with different disease distributions along muscular length, the needs to have ~30s temporal resolution poses a considerable challenge given the longer readout.Methods
3D CrCEST MRI was acquired at a 7.0T MRI scanner (MAGNETOM Terra, Siemens Healthcare, Erlangen, Germany) using a 28-Channel phased-array knee coil. First baseline CrCEST data was performed for 2 minutes, followed by 2 minutes of mild plantar flexion exercise (with 30 push/second) and then 8 minutes of post exercise CrCEST imaging. The prototype sequence consisted of the pulse train (5x100ms Hanning windowed, duty cycle 99%, B1rms of 2.9 μT or 124 Hz), followed by single shot GRE read out with TR = 3.5ms, TE = 1.47ms, with a T1 recovery delay of 5 seconds. Other imaging parameters were: Voxel size 1.4x1.4x5mm3; FOV = 160x160; FOV phase 100%; averaging = 1; # slices = 8; BW = 710 Hz/pixel; Turbo factor = 422. Spiral with elliptical scanning in transverse orientation. CEST imaging was accelerated using GRAPPA with acceleration factors: along PE = 2, along 3D = 1, Reference lines = 24. Raw CEST images were acquired at 6 saturation offset frequencies from ±1.2, ±1.8,±2.4ppm (relative to water resonance set as 0ppm). WASSR images (from ±0 to ±0.9 ppm with a step-size of ±0.15 ppm), with a saturation pulse at B1rms of 0.29μT with 200ms duration, was used to correct for B0 in homogeneities (7). For B1-correction, linear correction was used.Plantar Flexion Exercise (PFE): An MR compatible pneumatical ergometer (Trispect, Ergospect, Innsbruck, Austria) was used in the manual mode for the plantar flexion exercise. The applied air pressure was kept at 8 psi (pound per square inch) and the pedaling frequency was kept at 30 beats per minute (BPM).Five healthy human volunteers (3 males, 2 females; aged 25-55 years old) participated in the approved study protocol. To assess the inter-day scan repeatability, all volunteers underwent 3D CrCEST acquisition following the PFE, on at least two different days. To assess the intra-day scan repeatability, three volunteers also underwent at least two sets of 3D CrCEST experiment within same session following separate PFEs and a minimum of 20 minutes separation was maintained between successive PFEs to ensure full creatine recovery.Results
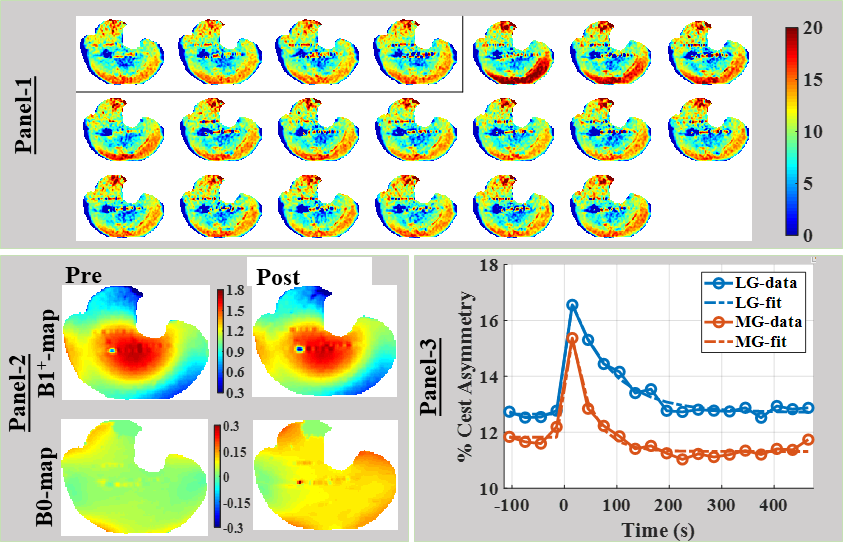
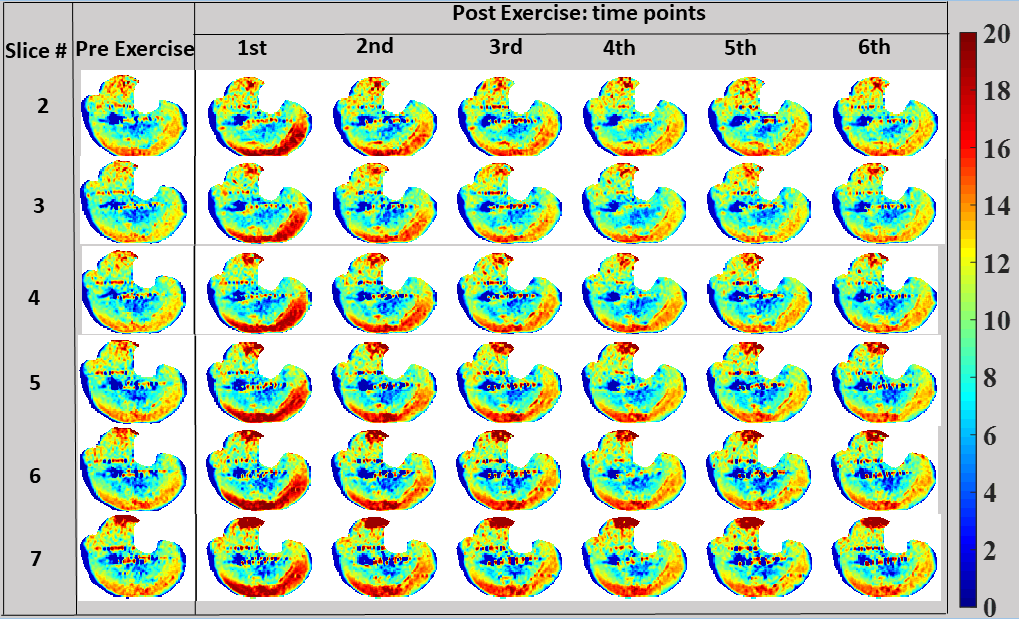
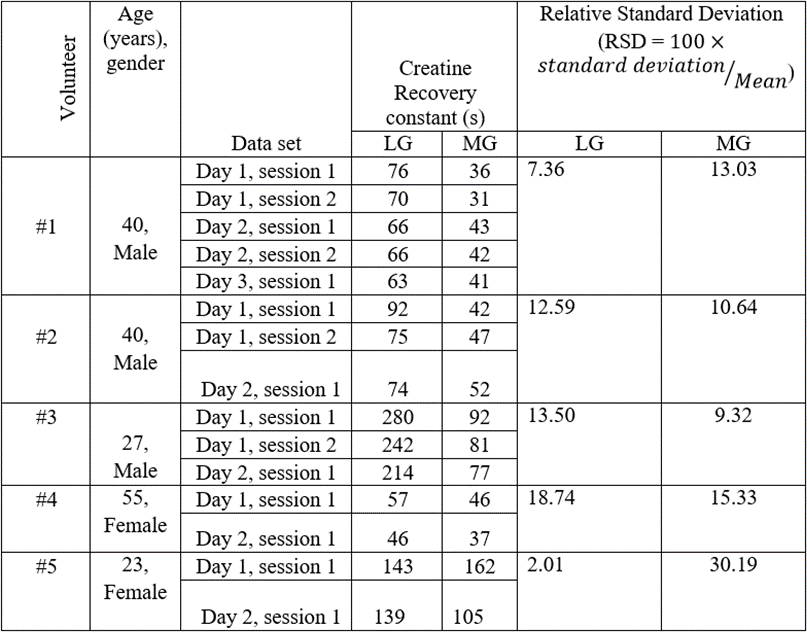
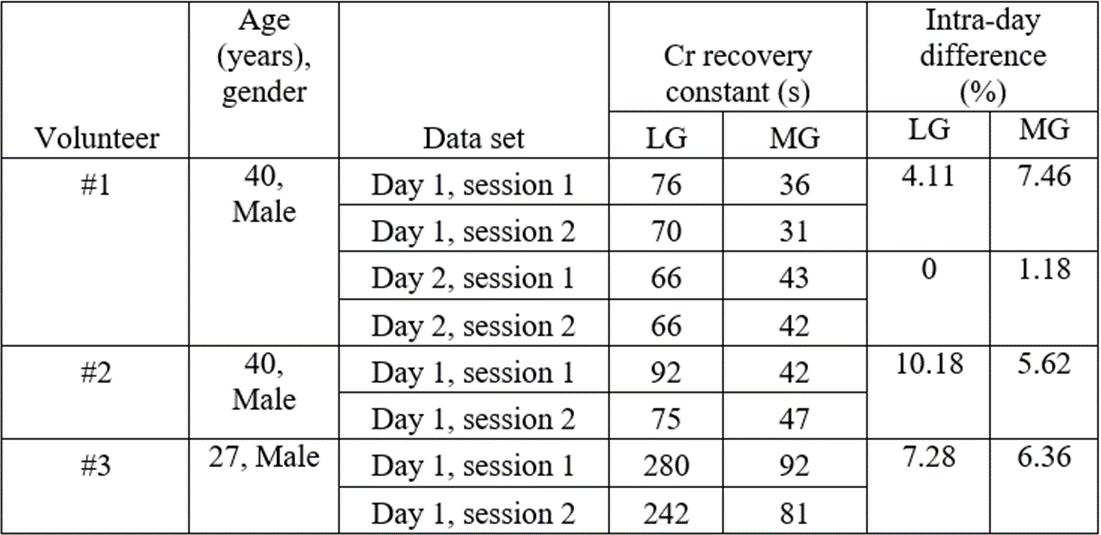
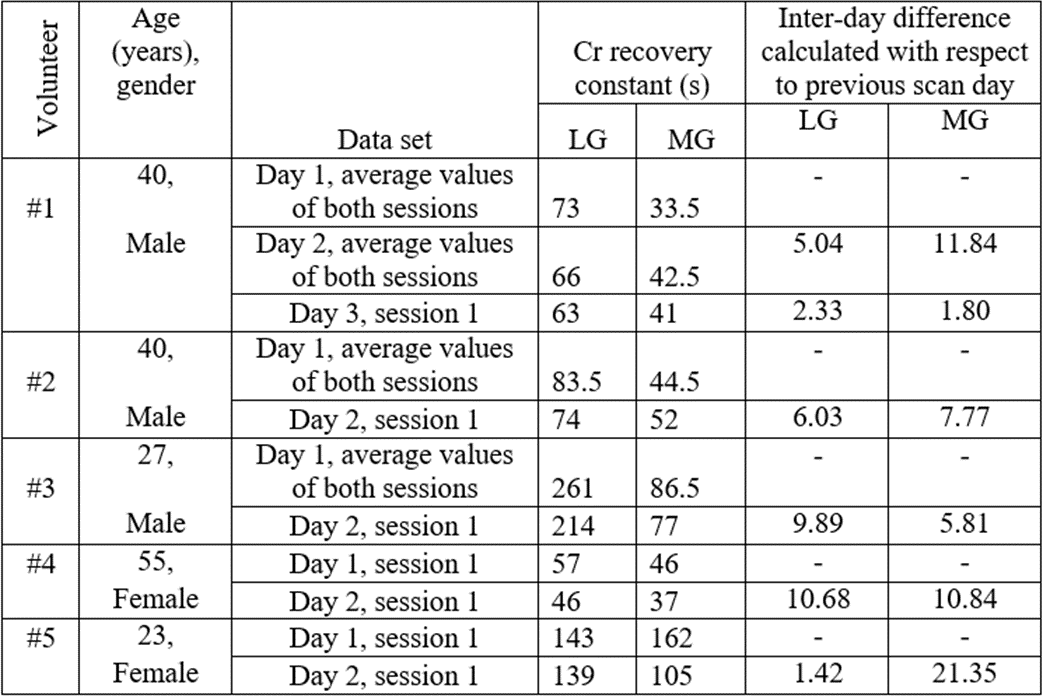
All volunteers utilized lateral gastrocnemius (LG) and medial gastrocnemius (MG) muscles during the exercise, with significant increase in CEST% >4-5%.The time series of CrCEST maps corresponding to the 4th slice of volunteer 1, after smoothing with 3x3x3 kernel, has been shown in Fig 1, Panel-1. Post exercise, LG and MG muscles showed elevated level of CrCEST contrast, which returned to normal after few frames. Though B1+-map did not change appreciably post exercise, B0-maps were appreciably different with the center frequency drift being the major contributor (Fig 1, Panel-2). Of course, WASSR map acquired post exercise was sufficient to correct for this center frequency drift. The time series of 3D CrCEST from other slice (#2-7) are shown in Fig 2.The inter-muscular variability in Cr recovery constants for LG, MG, measured using 3D CrCEST, across repeated scans from all healthy volunteers are shown in Tab. 1. For intra-day scan repeatability, the relative differences in CrCEST decay constants for LG and MG were (5.39±4.37)% and (5.16±2.76)% respectively (Tab. 2). For inter-day scan repeatability, the relative differences in CrCEST decay constants for LG and MG were (5.90±3.81)% and (9.90±6.67)% respectively (Tab. 3).Discussion
Achieving the repeatability (inter-day, intra-day) for PCr recovery is more challenging as biological/physiological variations and factors related to PFEs could also contribute in addition to methodological variations with origins in acquisition and processing. Niess et al. (8) also confirmed the influence of knee angle on the distribution of work load, leading to the change in the metabolic profile measured using 31PMRS and recommended the plantar flexion exercise with straight leg to be the optimal paradigm. Also, a drop in in vivo pH would lead to a significant drop in percentage CrCEST asymmetry, as well as an appreciable reduction (approximately 20-30% drop from pH = 7.0 to pH = 6.5) in the forward creatine kinase reaction (9). So, it is crucial to optimize the exercise work load so as to avoid any acidification due to lactate generation.Conclusion/s
This preliminary study demonstrates for the first time the feasibility of 3D CrCEST MRI at 1.4x1.4x5mm3 resolution, while still retaining ~30s temporal resolution.Acknowledgements
This project was supported by National Institute of Biomedical Imaging and Bioengineering of the National Institute of Health through grant number P41-EB015893 (NIH/NIBIB) and R56-AG062665 (NIH).References
1. DeBrosse C, Nanga RPR, Wilson N, D'Aquilla K, Elliott M, Hariharan H, Yan F, Wade K, Nguyen S, Worsley D, Parris-Skeete C, McCormick E, Xiao R, Cunningham ZZ, Fishbein L, Nathanson KL, Lynch DR, Stallings VA, Yudkoff M, Falk MJ, Reddy R, McCormack SE. Muscle oxidative phosphorylation quantitation using creatine chemical exchange saturation transfer (CrCEST) MRI in mitochondrial disorders. JCI Insight 2016;1(18):e88207.
2. Armstrong RB, Warren GL, Warren JA. Mechanisms of exercise-induced muscle fibre injury. Sports Med 1991;12(3):184-207.
3. Ooi DS, Isotalo PA, Veinot JP. Correlation of antemortem serum creatine kinase, creatine kinase-MB, troponin I, and troponin T with cardiac pathology. Clin Chem 2000;46(3):338-344. 4. Popovich BK, Boheler KR, Dillmann WH. Diabetes decreases creatine kinase enzyme activity and mRNA level in the rat heart. Am J Physiol 1989;257(4 Pt 1):E573-577.
5. Kogan F, Haris M, Debrosse C, Singh A, Nanga RP, Cai K, Hariharan H, Reddy R. In vivo chemical exchange saturation transfer imaging of creatine (CrCEST) in skeletal muscle at 3T. J Magn Reson Imaging 2014;40(3):596-602.
6. Kogan F, Haris M, Singh A, Cai K, Debrosse C, Nanga RP, Hariharan H, Reddy R. Method for high-resolution imaging of creatine in vivo using chemical exchange saturation transfer. Magn Reson Med 2014;71(1):164-172.
7. Kim M, Gillen J, Landman BA, Zhou J, van Zijl PC. Water saturation shift referencing (WASSR) for chemical exchange saturation transfer (CEST) experiments. Magn Reson Med 2009;61(6):1441-1450. 8. Niess F, Fiedler GB, Schmid AI, Laistler E, Frass-Kriegl R, Wolzt M, Moser E, Meyerspeer M. Dynamic multivoxel-localized P-31 MRS during plantar flexion exercise with variable knee angle. Nmr in Biomedicine 2018;31(6).
9. Goudemant JF, Vanderelst L, Dupont B, Vanhaverbeke Y, Muller RN. Ph and Temperature Effects on Kinetics of Creatine-Kinase in Aqueous-Solution and in Isovolumic Perfused Heart - a P-31 Nuclear Magnetization-Transfer Study. Nmr in Biomedicine 1994;7(3):101-110.
Figures