3115
Dynamic glucose-enhanced (DGE) MRI for brain tumors: a small-scale clinical observational study1Zhujiang Hospital, Southern Medical University, Guangzhou, China, 2Russell H. Morgan Department of Radiology and Radiological Science, Johns Hopkins University School of Medicine, Baltimore, MD, United States, 3F.M. Kirby Research Center for Functional Brain Imaging, Kennedy Krieger Research Institute, Baltimore, MD, United States, 4Department of Medical Radiation Physics, Lund University, Lund, Sweden
Synopsis
Dynamic glucose-enhanced (DGE) MRI has shown potential for imaging glucose delivery and blood brain barrier permeability. Previous reports focused on the technical development of DGE and only a few clinical brain tumor cases have been reported. Here we incorporated the current DGE protocol into our routine MRI examination at 3T and performed a small-scale clinical observational study on patients with different types of brain tumors. Despite the technical challenges of DGE at clinical scanners, we observed different (non)-enhancement patterns with various brain tumor types.
Introduction
Current clinical practice for the detection of malignant brain tumors by magnetic resonance imaging (MRI) is based on the use of gadolinium based contrast agents (GBCAs) to enhance regions with blood-brain barrier (BBB) disruption. While used on a daily basis, this modality still faces many challenges. For example, roughly 10% of glioblastoma multiform (GBMs) and 30% of anaplastic astrocytomas (AAs) demonstrate no enhancement 1,2. Gadolinium enhancement itself cannot distinguish between different causes of BBB disruption and will visualize both tumor regrowth (progression) and the effects of treatment (pseudo-progression). Recently, promising results using an MRI technique called chemical exchange saturation transfer (CEST) have been published for the use of D-Glucose 3,4 and glucose analogues 5-9 as biodegradable contrast agents for MRI. Following infusion of D-glucose, dynamic glucose enhanced (DGE) imaging has allowed the detection of MRI signal changes in animals 10 and in humans 11-16, showing potential for the use of this readily available sugar to study tissue perfusion parameters such as blood volume and blood brain barrier (BBB) permeability.Previous reports of DGE MRI at 3T have focused on the technical development aspect and most studies were performed on healthy controls and very limited number of brain tumor cases 16,17. In the current study, we have incorporated the DGE protocol into the routine MRI examination at 3T and performed a small clinical observational study on several patients with different types of brain tumors.
Methods
The study was approved by the local institutional review board and informed consent was obtained prior to the study from all participants. To date, 8 patients participated in the study and the radiological assessments of their condition are listed in Table 1. All subjects were scanned on a 3T Philips Ingenia MRI scanner. A body coil with parallel transmission was used for RF transmission and a 16-channel phased-array head coil was used for reception. Acquisition software was modified to operate the two RF amplifiers of the system in an alternating fashion during the RF saturation as described by Keupp et al. 18. The quasi-continuous wave saturation consisted of a train of sinc-gauss pulses, each 50 ms in duration. Dynamic CEST images were acquired continuously before, during and after glucose infusion using saturation B1 field of 1.6 mT for 1 s at a single frequency of 2 ppm. Images were acquired using a multi-shot 3D turbo spin echo (TSE) sequence with TR/TE/FA of 3.5s/6.1ms/90°; 15 slices of thickness 4.4 mm each with in-plane resolution of 3.3×3.3 mm2 were acquired within a FOV of 180×220 mm2. The TSE factor was 80 and the SENSE acceleration factor was 1.8. The scan time for acquiring each image volume was 17.5 s. The intravenous infusion of glucose was set up according to the previous report 11. 50 mL of 50% w/w glucose sterile solution was injected using a power injector over 125s following by 20 mL saline raise. Approximately 25 min post glucose injection, Gd contrast agent was injected to complete the clinical scan.The acquired DGE MRI data was motion corrected using rigid body registration and the mean area under dynamic curve (AUC) images were calculated by taking the mean of the normalized dynamic difference images over a few minutes (0-2 min and 3-15 min). The anatomical images, MPRAGE and T2 FLAIR, were co-registered to the CEST image for co-localization.
Result and discussion:
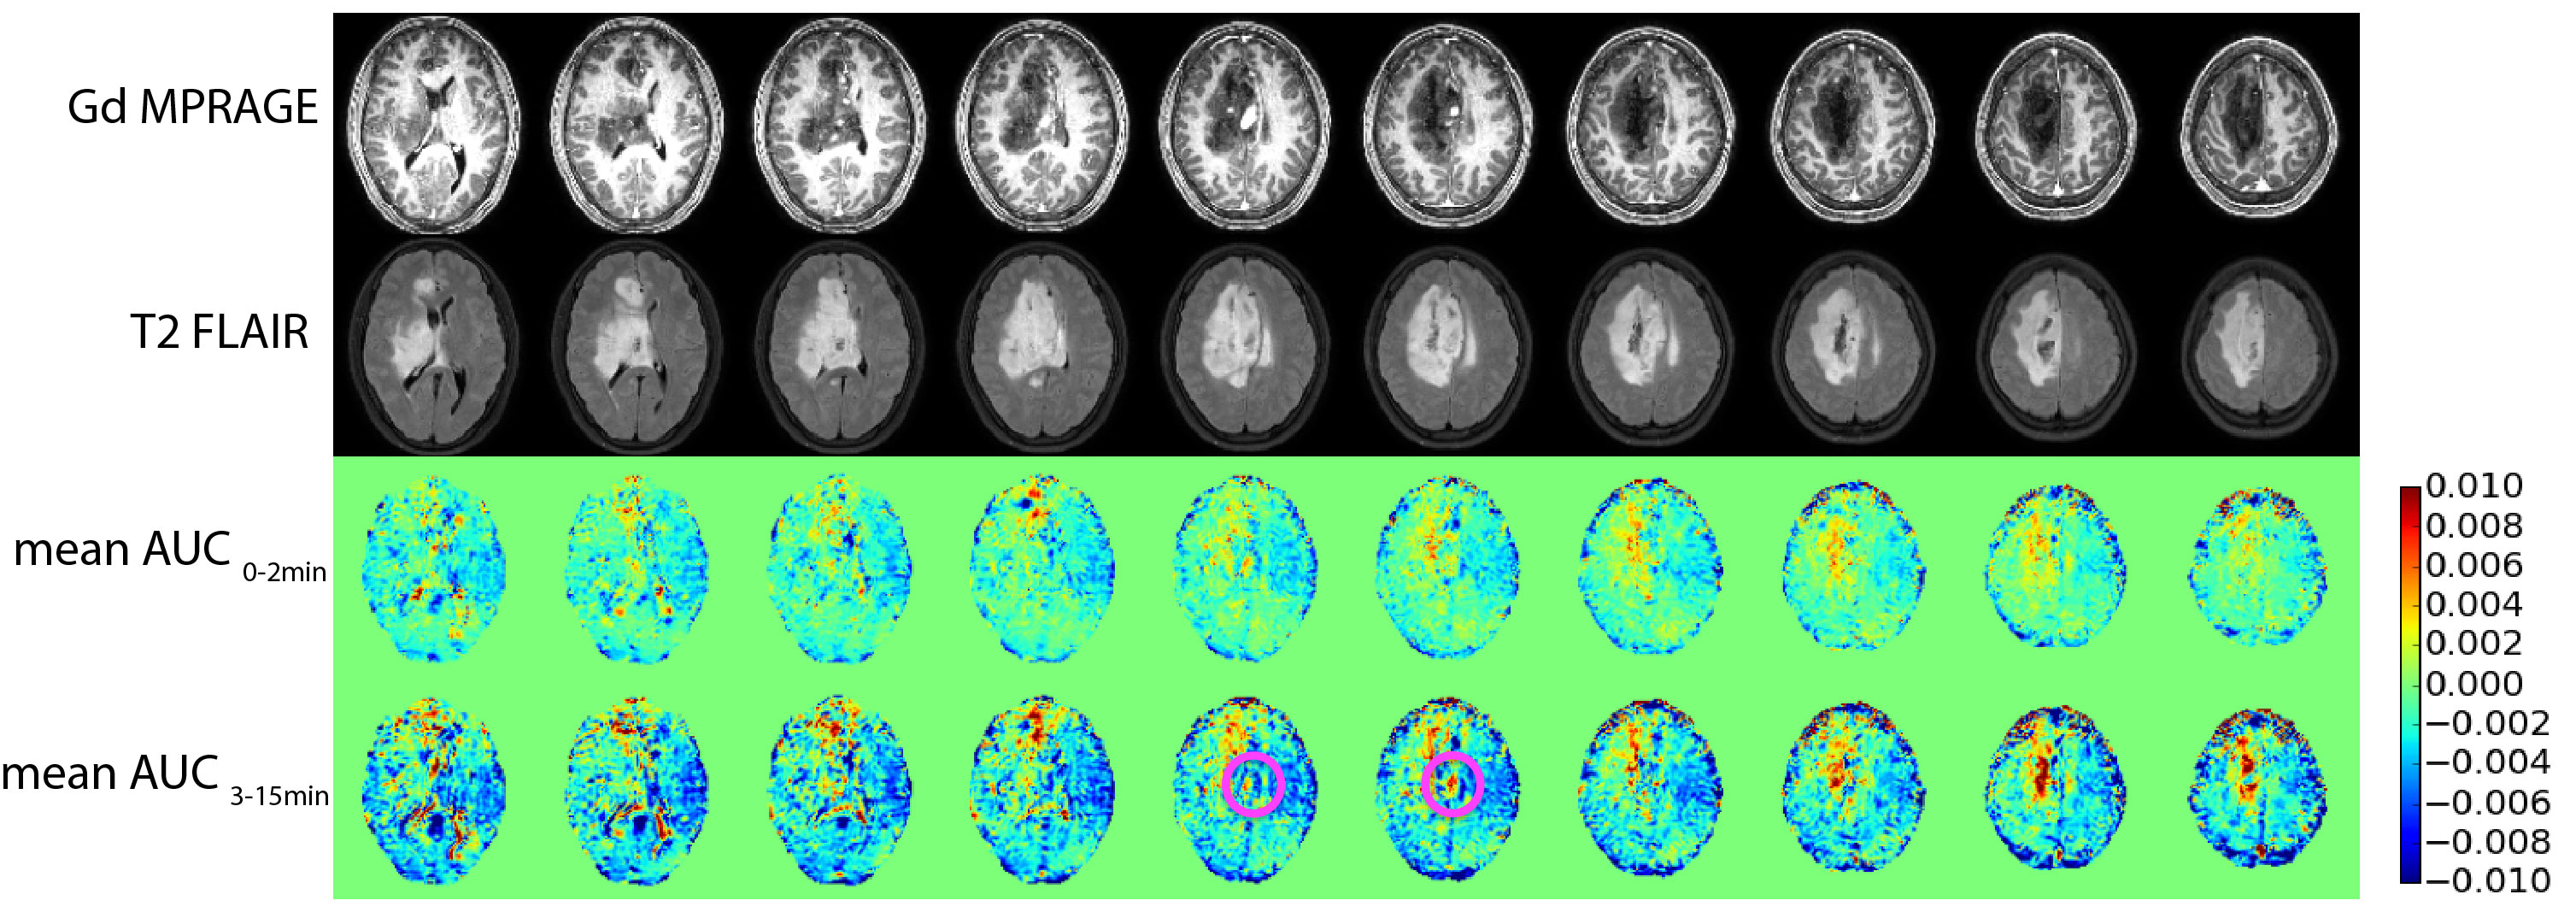
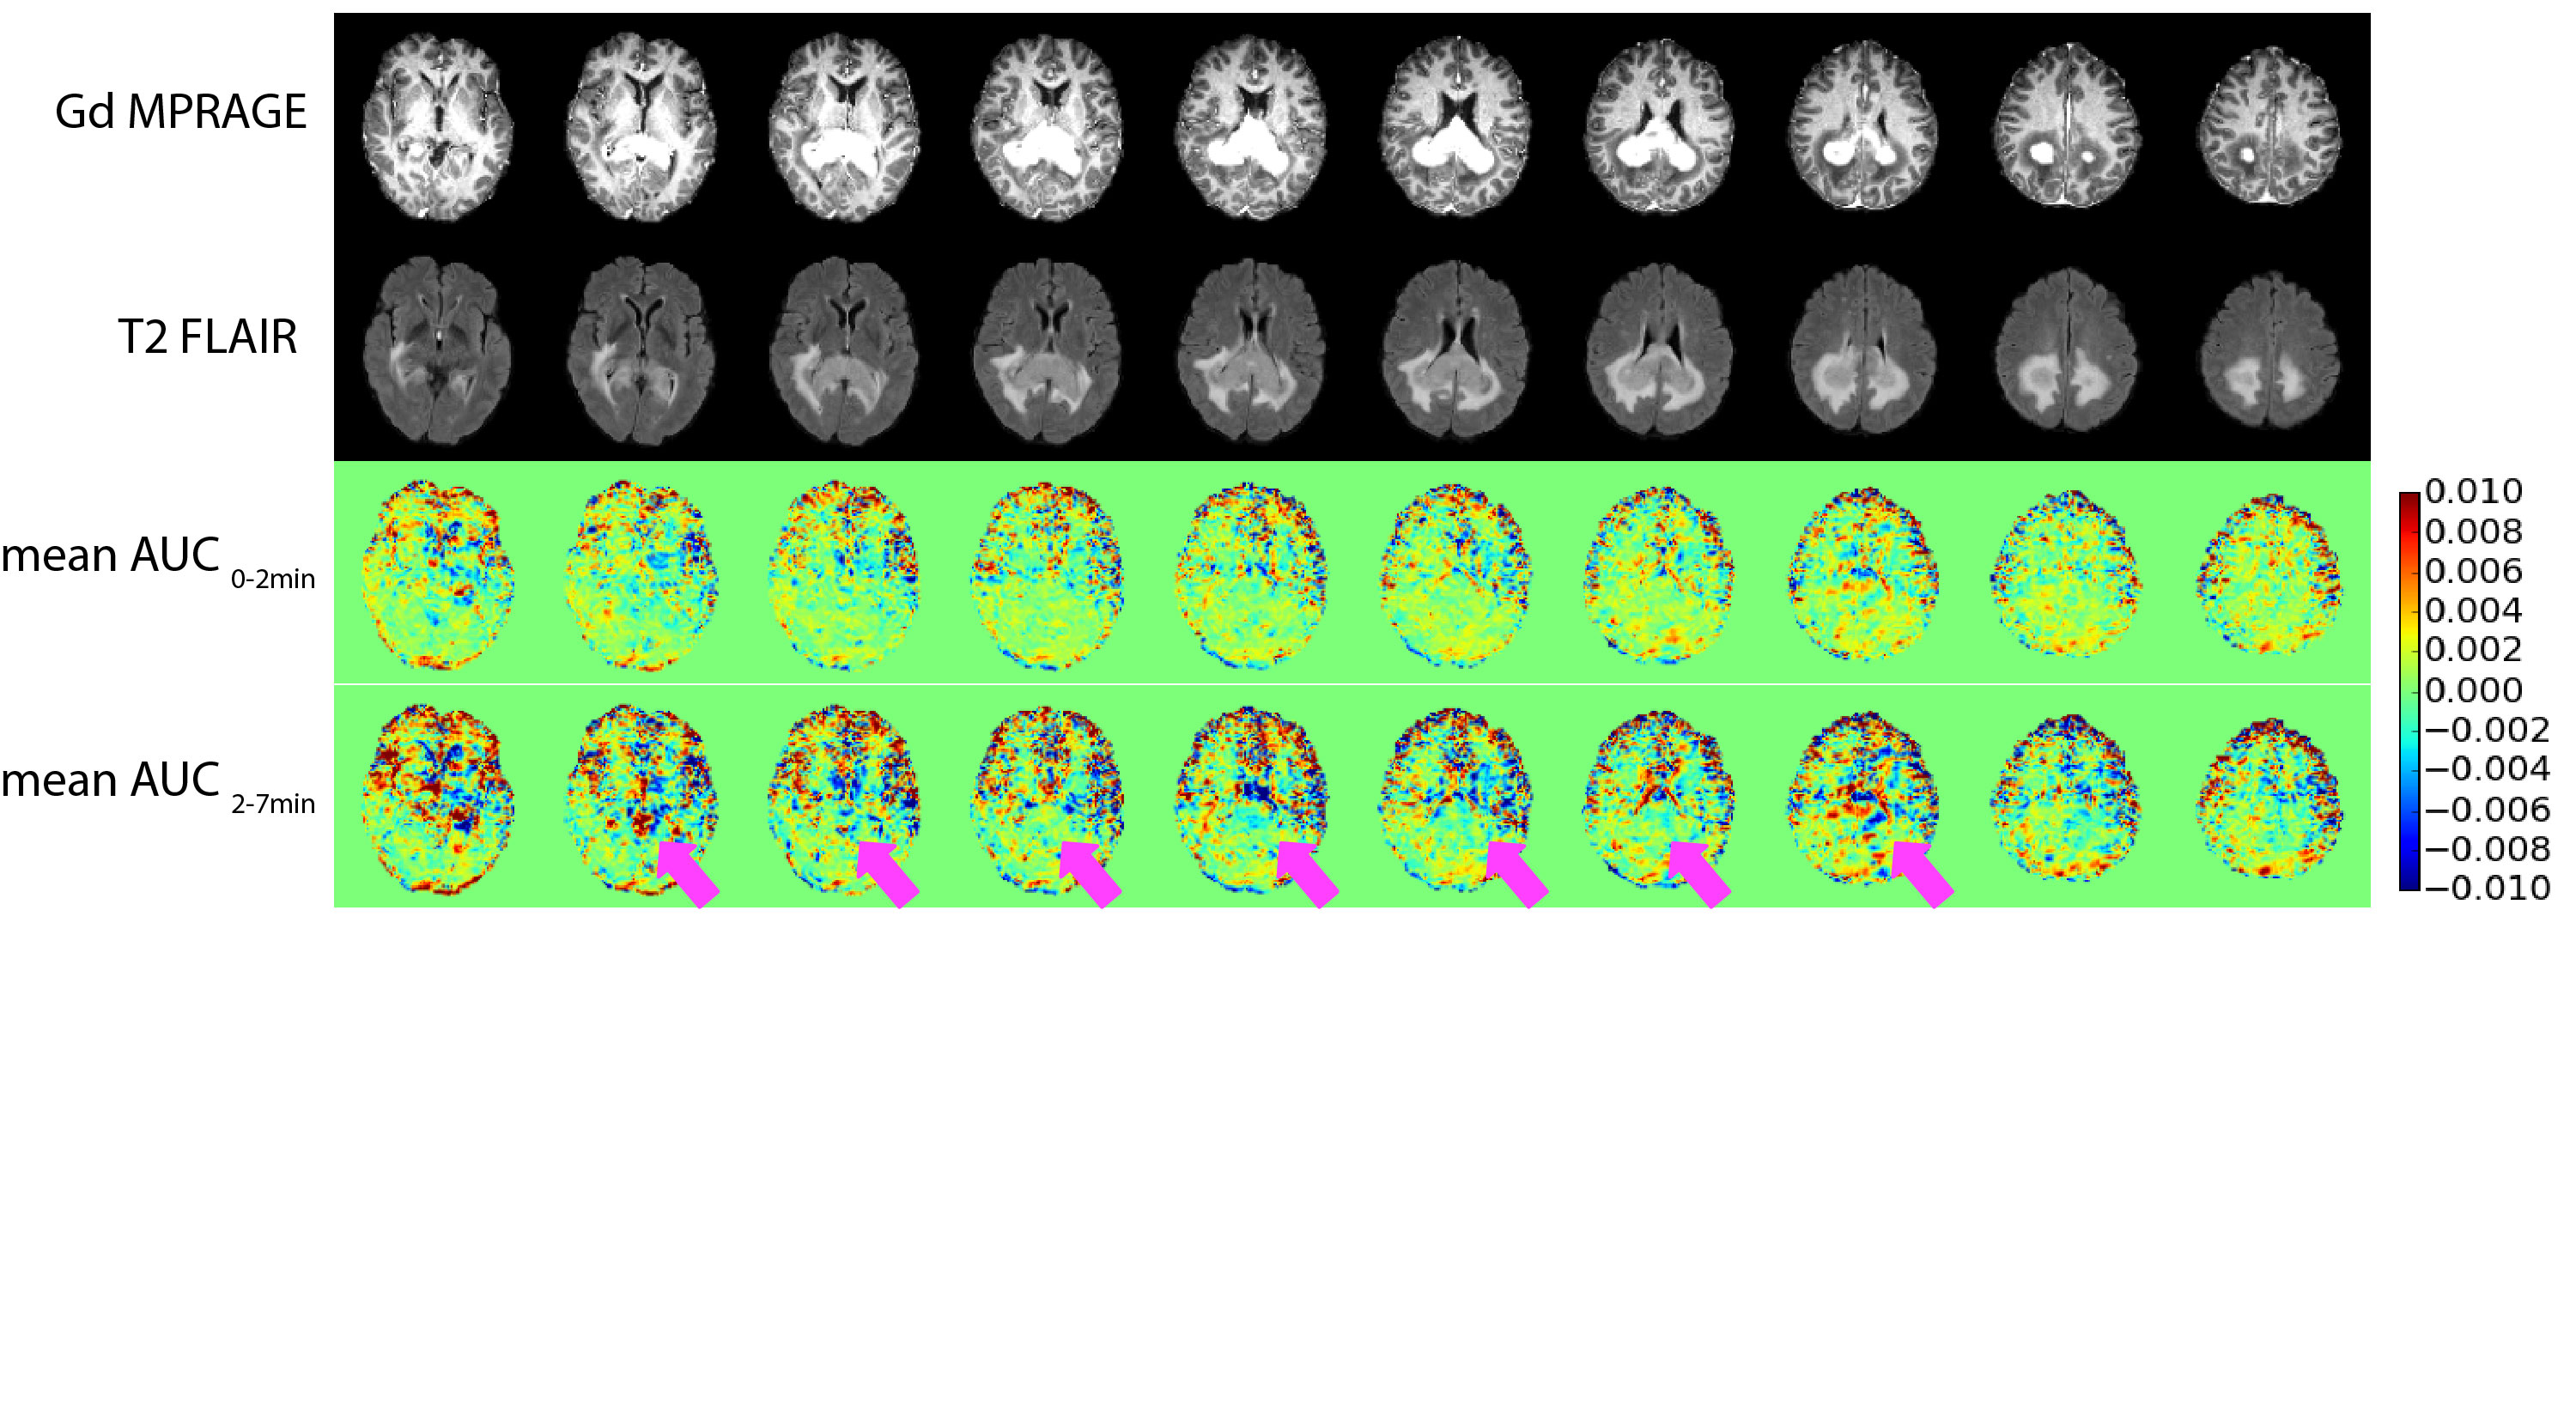
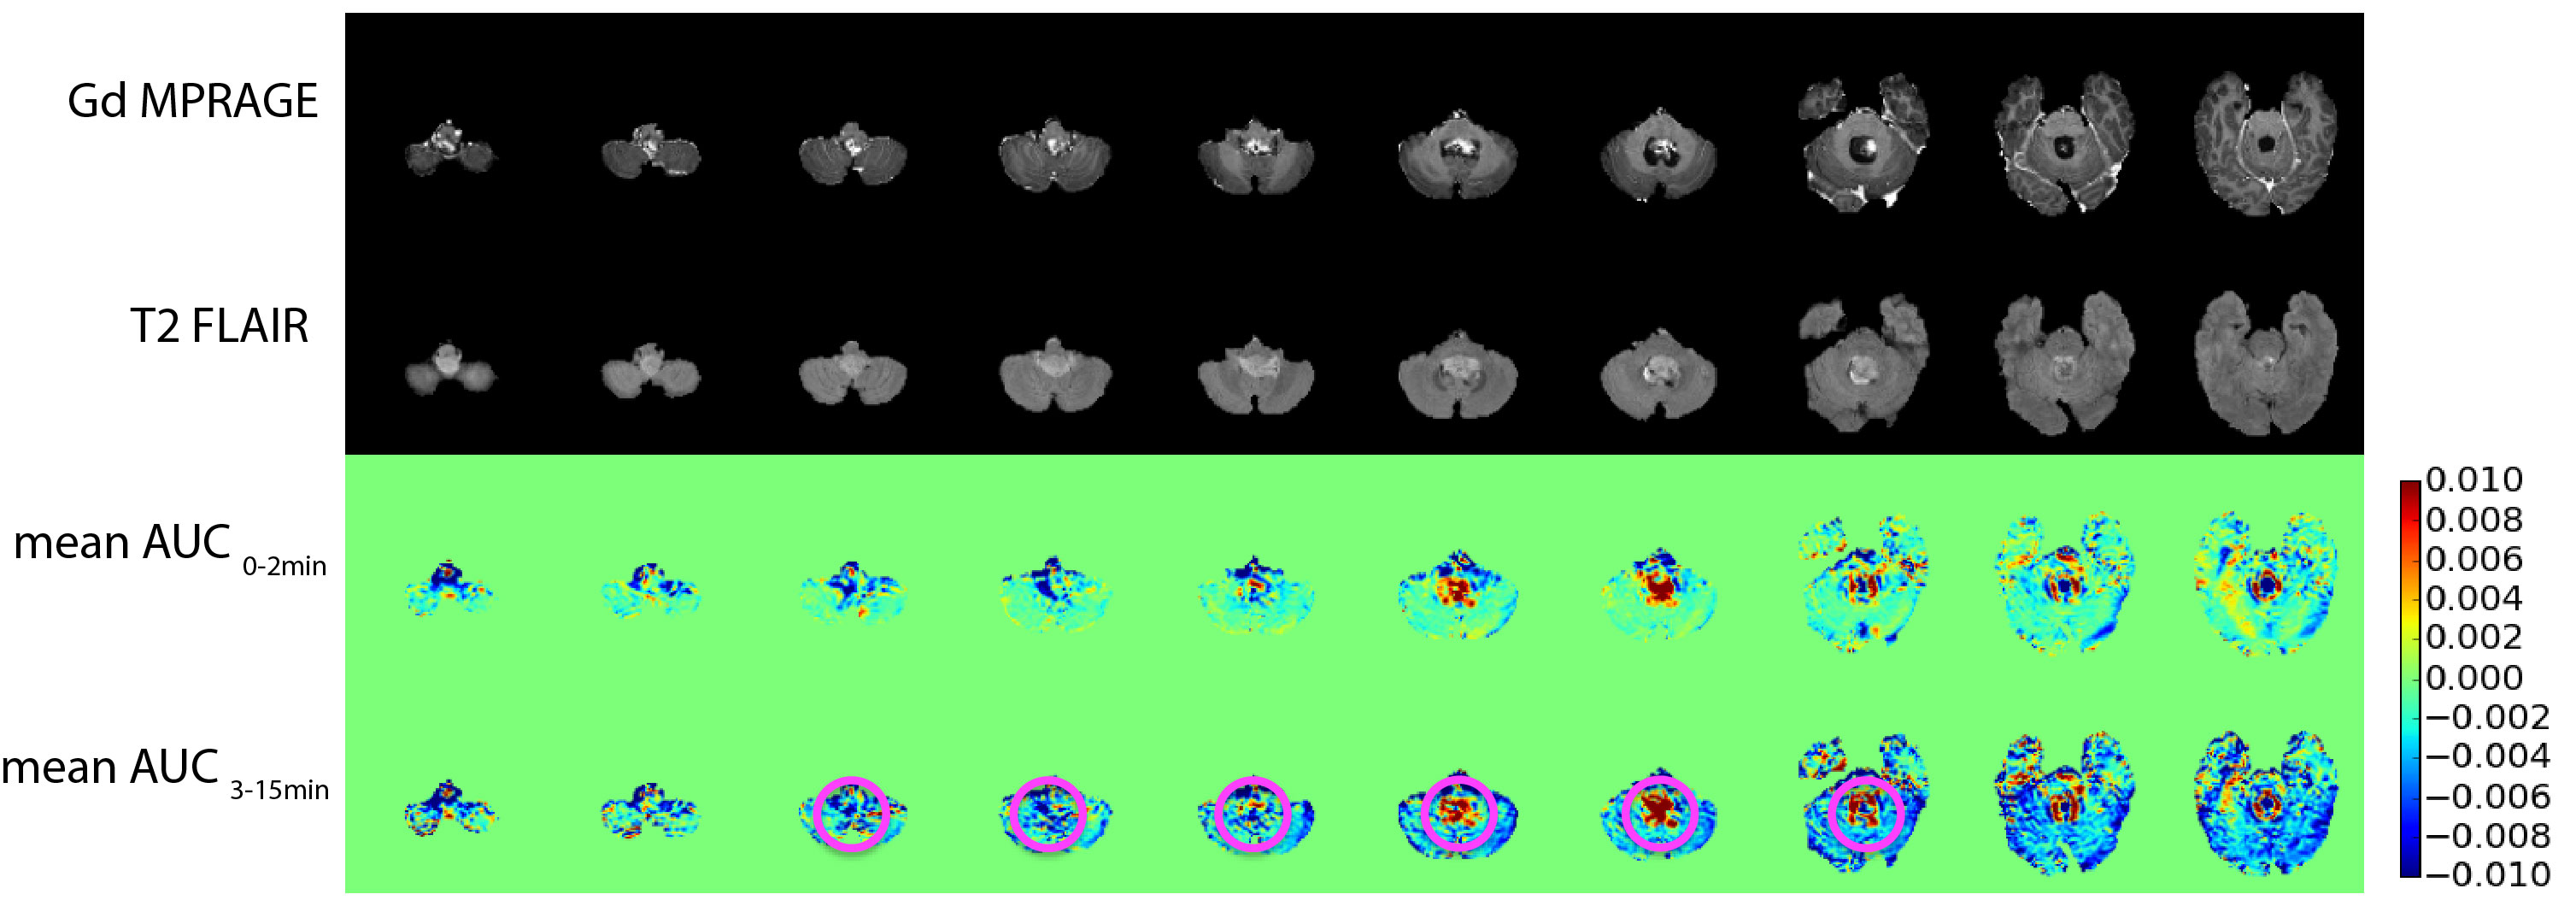
The pattern of DGE MRI for each patient is described in Table 1. The Gd enhanced MPRAGE, T2 FLAIR, and mean AUC images of a glioma case (Figure 1, patient 1); a lymphoma case (Figure 2, patient 3) and an ependymoma case (Figure 3, patient 7) are shown as examples. It is observed that the DGE signals generally increased in and at the edge of gliomas, but the enhancement may or may not exactly coincide with Gd enhancement. In one case of lower frontal lobe glioma (patient 8), the DGE signal decreased in the entire front region. This could be a result of unreliable difference signal from a low-signal region close to the sinus rather than a reflection of tumor perfusion/metabolic changes. The ependymoma case showed prominent DGE enhancement, but since the tumor was located in the fourth ventricle, there could be signal contributions from the CSF, as D-glucose readily enters CSF. It was interesting that in both lymphoma cases, the DGE signal remained unchanged despite the significant, homogenous Gd enhancement. The reason for the lack of signal change is currently unclear.Conclusion:
DGE MRI at 3T remains technically challenging. Due to the small effect size, confounding factors such as motion and field inhomogeneities could affect the DGE signal. Nevertheless, the current study shows that the DGE MRI can be incorporated into standard MRI examinations of brain tumors. Different (non)-enhancement patterns were observed in varies tumor types. However, the underlying pathophysiological reason is currently unknown. A larger sample size is needed to verify the observed signal changes in DGE MRI in different types of brain tumors.Acknowledgements
No acknowledgement found.References
1. McKnight TR, Lamborn KR, Love TD, Berger MS, Chang S, Dillon WP, Bollen A, Nelson SJ. Correlation of magnetic resonance spectroscopic and growth characteristics within Grades II and III gliomas. Journal of neurosurgery 2007;106(4):660-666.
2. Scott JN, Brasher PM, Sevick RJ, Rewcastle NB, Forsyth PA. How often are nonenhancing supratentorial gliomas malignant? A population study. Neurology 2002;59(6):947-949.
3. Chan KWY, McMahon MT, Kato Y, Liu G, Bulte JWM, Bhujwalla ZM, Artemov D, van Zijl PCM. Natural D-glucose as a biodegradable MRI contrast agent for detecting cancer. Magn Reson Med 2012;68(6):1764-1773.
4. Walker-Samuel S, Ramasawmy R, Torrealdea F, Rega M, Rajkumar V, Johnson SP, Richardson S, Goncalves M, Parkes HG, Arstad E, Thomas DL, Pedley RB, Lythgoe MF, Golay X. In vivo imaging of glucose uptake and metabolism in tumors. Nat Med 2013;19(8):1067-1072.
5. Nasrallah FA, Pages G, Kuchel PW, Golay X, Chuang KH. Imaging brain deoxyglucose uptake and metabolism by glucoCEST MRI. J Cereb Blood Flow Metab 2013;33(8):1270-1278.
6. Rivlin M, Horev J, Tsarfaty I, Navon G. Molecular imaging of tumors and metastases using chemical exchange saturation transfer (CEST) MRI. Sci Rep 2013;3.
7. Rivlin M, Navon G. Glucosamine and N-acetyl glucosamine as new CEST MRI agents for molecular imaging of tumors. Sci Rep 2016;6:32648.
8. Rivlin M, Tsarfaty I, Navon G. Functional molecular imaging of tumors by chemical exchange saturation transfer MRI of 3-O-Methyl-D-glucose. Magn Reson Med 2014;72(5):1375-1380.
9. Sehgal AA, Li Y, Lal B, Yadav NN, Xu X, Xu J, Laterra J, van Zijl PCM. CEST MRI of 3-O-methyl-D-glucose uptake and accumulation in brain tumors. Magn Reson Med 2019;81(3):1993-2000.
10. Xu X, Chan KWY, Knutsson L, Artemov D, Xu J, Liu G, Kato Y, Lal B, Laterra J, McMahon MT, van Zijl PCM. Dynamic glucose enhanced (DGE) MRI for combined imaging of blood–brain barrier break down and increased blood volume in brain cancer. Magn Reson Med 2015;74(6):1556-1563.
11. Xu X, Yadav NN, Knutsson L, Hua J, Kalyani R, Hall E, Laterra J, Blakeley J, Strowd R, Pomper M, Barker P, Chan K, Liu G, McMahon MT, Stevens RD, van Zijl PC. Dynamic Glucose-Enhanced (DGE) MRI: Translation to Human Scanning and First Results in Glioma Patients. Tomography 2015;1(2):105-114.
12. Paech D, Schuenke P, Koehler C, Windschuh J, Mundiyanapurath S, Bickelhaupt S, Bonekamp D, Baumer P, Bachert P, Ladd ME, Bendszus M, Wick W, Unterberg A, Schlemmer HP, Zaiss M, Radbruch A. T1rho-weighted Dynamic Glucose-enhanced MR Imaging in the Human Brain. Radiology 2017:162351.
13. Schuenke P, Koehler C, Korzowski A, Windschuh J, Bachert P, Ladd ME, Mundiyanapurath S, Paech D, Bickelhaupt S, Bonekamp D, Schlemmer H-P, Radbruch A, Zaiss M. Adiabatically prepared spin-lock approach for T1ρ-based dynamic glucose enhanced MRI at ultrahigh fields. Magn Reson Med 2017;78(1):215-225.
14. Schuenke P, Paech D, Koehler C, Windschuh J, Bachert P, Ladd ME, Schlemmer HP, Radbruch A, Zaiss M. Fast and Quantitative T1rho-weighted Dynamic Glucose Enhanced MRI. Sci Rep 2017;7:42093.
15. Knutsson L, Seidemo A, Rydhog Scherman A, Markenroth Bloch K, Kalyani RR, Andersen M, Sundgren PC, Wirestam R, Helms G, van Zijl PCM, Xu X. Arterial Input Functions and Tissue Response Curves in Dynamic Glucose-Enhanced (DGE) Imaging: Comparison Between glucoCEST and Blood Glucose Sampling in Humans. Tomography 2018;4(4):164-171.
16. Herz K, Lindig T, Deshmane A, Schittenhelm J, Skardelly M, Bender B, Ernemann U, Scheffler K, Zaiss M. T1ρ-based dynamic glucose-enhanced (DGEρ) MRI at 3 T: method development and early clinical experience in the human brain. Magn Reson Med 2019;0(0).
17. Xu X, Sehgal AA, Yadav NN, Knutsson L, Laterra J, Pomper M, Rosenthal H, van Zijl PCM. Dynamic Glucose Enhanced Imaging at 3T: First Human Data. Proceedings of the International Society of Magnetic Resonance in Medicine 2017.
18. Keupp J, Baltes C, Harvey P, Van den Brink J. Parallel RF transmission based MRI technique for highly sensitive detection of amide proton transfer in the human brain at 3T. Proc Int Soc Magn Reson Med 2011;19(710).
Figures