3114
Glucose Metabolism by Dynamical Glucose Enhanced imaging
Yu-Wen Chen1 and Dennis Wenhan Hwang2
1, IBMS N123, Academia Sinica, Taipei, Taiwan, 2IBMS, Academia Sinica, Taipei, Taiwan
1, IBMS N123, Academia Sinica, Taipei, Taiwan, 2IBMS, Academia Sinica, Taipei, Taiwan
Synopsis
Dynamic glucose-enhanced (DGE) images, detected by CEST, was used to provide direct information on glucose metabolism. It also provides the spatial distribution of the metabolic processes. The time-dependent glucose concentration variation in the striatum of HD shows that the glucose uptake in the HD mice striatum decreases with age. The groups of older than 9-11 weeks HD mice were easy to find the symptoms of HD, and their glucose uptaking also show a significant decrement. By contrast, WT mice show a mild decrease in the glucose uptake for the mice with similar age.
Introduction
Neurodegenerative diseases, such as HD, are irreversible and associated with neuronal impairment that seriously impedes people's daily life. To date, the detailed molecular mechanism remains largely unclear. Occlusion formation and metabolic defects have been considered as biomarkers of neurodegenerative disease.(1-5) Earlier studies have shown that brain glucose utilization and energy metabolism impairment are associated with early abnormalities of neurodegeneration. To clarify the effects of dysregulated metabolites on neurodegenerative disease and the dynamic regulation of glucose in the brain, we aim to develop a tool that can monitor these changes during disease progression in vivo. Chemical exchange saturation transfer (CEST) imaging has been actively developed for more than 15 years,(6-8) and it has been translated to clinical applications recently.(9-11) The most important feature of CEST imaging is its ability to observe the functional groups on metabolites, which reflect the concentration changes at the microscopic scales in the images contrast at macroscopic scales. However, most applications of CEST imaging involve only the CEST-induced changes in the image to locate lesions. There are only a few studies focusing on the connection between metabolites and disease mechanisms. The goal of this study is to utilize CEST imaging to investigate the metabolic dynamics and accumulation status of glucose in the brain of mice with Huntington’s disease (HD). Based on the results of CEST imaging, pathological and biochemical approaches will be used to explore the underlying mechanisms during disease progression in HD mice. The CEST imaging approach is expected to provide a more effective, inexpensive and non-invasive diagnostic method for studying neurodegenerative diseases.Method
R6/2 HD mice were used for the study. All images were acquired with a Bruker Biospin® 7 T MRI Scanner outfitter with a 20-mm-bore. A CEST-RARE sequence was used to acquire CEST image at +1.2 ppm from water resonance frequency with the following parameters: repetition time (TR) = 2000 ms, effective echo time (TE) = 56 ms, RARE factor = 23, field-of-view (FOV) =f 3.5 × 3.5 cm, acquisition matrix size = 256 x 32, and image resolution = 0.014x 0.027 cm/pixel. The length of the CW pulse is 3000 ms, and the B1 field is 1.6 μT.Results and discussion
Dynamic glucose-enhanced (DGE) images, detected by CEST, report on the exchange of the glucose OH group proton with water protons and provide direct information on glucose metabolism. It also provides the spatial distribution of the metabolic processes. Glucose (50[C1] % solution) was injected 10 min after the start of MRI scan, and the time-dependent signal variation in the image was observed, as shown in Fig. 1. The DGE mice brain images reveal that HD mice uptake less glucose than WT mice. Figure 2 shows the glucose concentration variation in the striatum as a function of time of HD and WT mice of different ages. It shows that the glucose uptake in the HD mice striatum decreases with age. The groups of older than 9-11 weeks HD mice were easy to find the symptoms of HD, and their glucose uptaking also show a significant decrement. By contrast, WT mice show a mild decrease in the glucose uptake for the mice with similar age.Conclusions
Glucose metabolism in neurodegenerative diseases, such as HD, is a critical issue in the disease progress. The dynamic variation of glucose uptake by DGE imaging can reveal the real situation of the glucose metabolism in the brain. The application of HD mice model shows a significant decrement in the HD mice.Acknowledgements
We thank the excellent technical assistant of the Animal Imaging Facility at Academia Sinica (Taiwan) for their assistance with the MRI measurements. We are also appreciative of the HD mice model provided by Dr. Yijuang Chern and her constructive discussion of the HD study.References
1. Choi YL, Park SH, Chung CK, Suh YL, Chi JG. Cortical laminar disorganization is correlated with severity of the cortical dysplasia and surgical outcome - experience with 150 cases. Epilepsy Research 2004;62(2-3):171-178. 2. Borthakur A, Gur T, Wheaton AJ, Corbo M, Trojanowski JQ, Lee VMY, Reddy R. In vivo measurement of plaque burden in a mouse model of Alzheimer's disease. Journal of Magnetic Resonance Imaging 2006;24(5):1011-1017. 3. Borthakur A, Sochor M, Davatzikos C, Trojanowski JQ, Clark CM. T1(rho) MRI of Alzheimer's disease. NeuroImage 2008;41(4):1199-1205. 4. Jack CR, Garwood M, Wengenack TM, Borowski B, Curran GL, Lin J, Adriany G, Grohn IHJ, Grimm R, Poduslo JF. In vivo visualization of Alzheimer's amyloid plaques by magnetic resonance imaging in transgenic mice without a contrast agent. Magn Reson Med 2004;52(6):1263-1271. 5. Jack CR, Marjanska M, Wengenack TM, Reyes DA, Curran GL, Lin J, Preboske GM, Poduslo JF, Garwood M. Magnetic resonance imaging of Alzheimer's pathology in the brains of living transgenic mice: A new tool in Alzheimer's disease research. Neuroscientist 2007;13(1):38-48. 6. van Zijl PCM, Lam WW, Xu J, Knutsson L, Stanisz GJ. Magnetization Transfer Contrast and Chemical Exchange Saturation Transfer MRI. Features and analysis of the field-dependent saturation spectrum. NeuroImage 2017. 7. Zaiss M, Bachert P. Exchange-dependent relaxation in the rotating frame for slow and intermediate exchange – modeling off-resonant spin-lock and chemical exchange saturation transfer. NMR in Biomedicine 2013;26(5):507-518. 8. Zaiss M, Bachert P. Chemical exchange saturation transfer (CEST) and MR Z-spectroscopy in vivo: a review of theoretical approaches and methods. Physics in Medicine & Biology 2013;58(22):R221. 9. Wu B, Warnock G, Zaiss M, Lin C, Chen M, Zhou Z, Mu L, Nanz D, Tuura R, Delso G. An overview of CEST MRI for non-MR physicists. EJNMMI Physics 2016;3(1):19. 10. Khlebnikov V, Siero JCW, Wijnen J, Visser F, Luijten PR, Klomp DWJ, Hoogduin H. Is there any difference in Amide and NOE CEST effects between white and gray matter at 7T? Journal of Magnetic Resonance 2016;272:82-86. 11. Gore JC, Zu Z, Wang P, Li H, Xu J, Dortch R, Gochberg DF. “Molecular” MR imaging at high fields. Magn Reson Imaging 2017;38:95-100.Figures
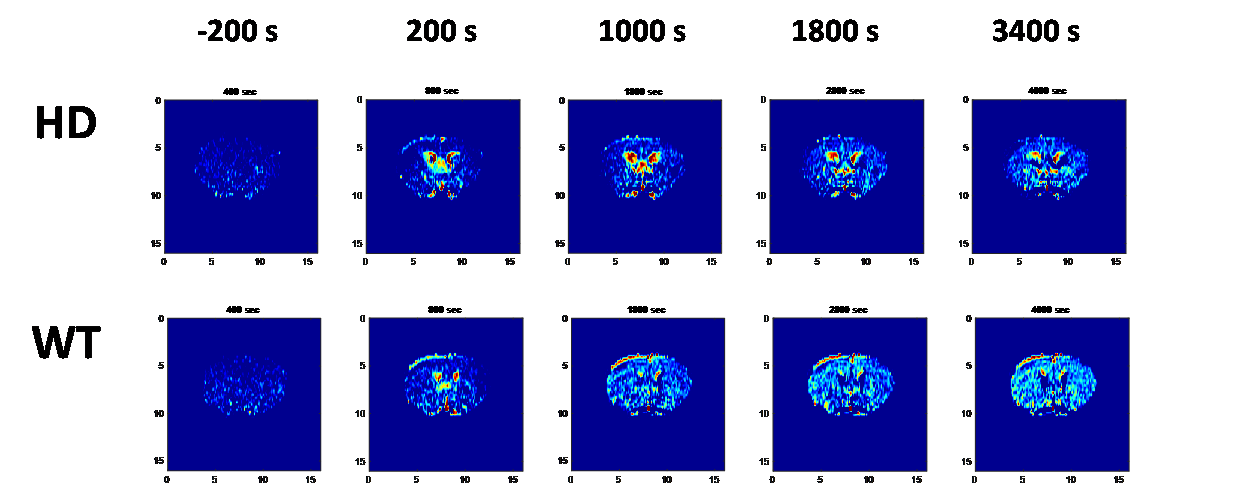
Figure 1. Time-dependent glucose-enhanced
images in HD (upper) and WT (bottom) brain.
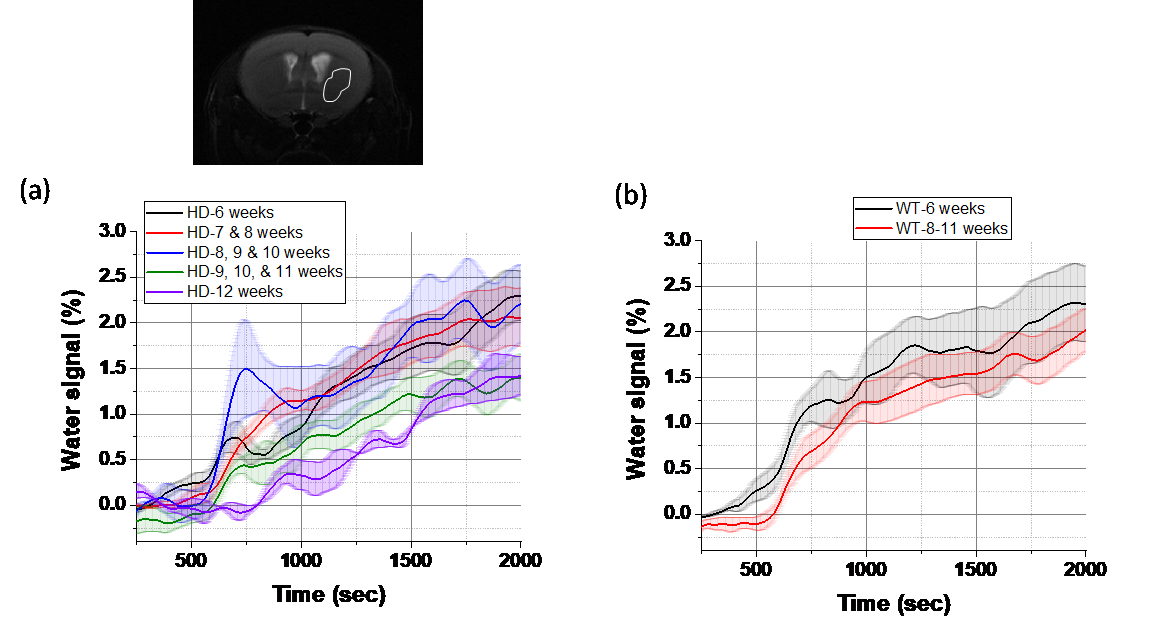
Figure 2.Time-dependent glucose concentration in the striatum
of the mice brain images of (a) HD mice model and WT. The time-dependent curve
in HD mice model can be divided into several stage depend on the age. and
correlate with the disease progress, while WT shows a very similar trend with different
age.