3108
Amide Proton Transfer imaging for differentiation of Tuberculomas from High-Grade Gliomas1Department of Neuroimaging and Interventional Radiology, National Institute of Mental Health and Neurosciences, Bengaluru, India, 2Department of Neurology, National Institute of Mental Health and Neurosciences, Bengaluru, India, 3Department of Neurosurgery, National Institute of Mental Health and Neurosciences, Bengaluru, India, 4Philips Healthcare, Bengaluru, India, 5Philips Health Systems, Philips India Ltd, Bengaluru, India
Synopsis
Amide proton transfer imaging was investigated for its potential to discriminate tuberculomas from high-grade gliomas. The diagnosis was confirmed by histopathology, CSF examination or response to anti-tubercular therapy. The MTRasym value of the Tuberculomas (mean 2.32± 0.50 s.d.) was significantly lower than high-grade gliomas (mean 4.32±0.84s.d.). Lower MTRasym values in tuberculomas are suggestive of relatively reduced mobile amide protons compared to the tumoral microenvironment. Perilesional elevated APT values in tuberculomas are a unique observation and may reflect a milieu of inflammation.
INTRODUCTION
Tuberculomas, endemic to the Indian subcontinent, have multifarious neuroimaging phenotypes and occasionally masquerade as high-grade glial neoplasms 1,2. Amide proton transfer (APT) imaging, building on the chemical exchange saturation transfer (CEST)principles, generates tissue contrast as a function of the tissue’s native peptides and amide protons that are mobile in intracellular proteins3. Magnetization Transfer Imaging (also a derivative of CEST phenomenon) derived evidence suggests lower protein content in tubercular lesion environment 4. We intend to further the understanding of amide microenvironment in tuberculomas using APT imaging and compare it with its neoplastic counterpart (high-grade gliomas).METHODS
The study population comprised 25 consenting patients whose clinical examination and preliminary Computed Tomography imaging had evidence of space-occupying lesions. All MR imaging was performed on a 3T Philips scanner with multiransmit capabilities. APT imaging was preceded by standard diffusion-weighted scans as part of the clinical protocol for imaging mass lesions. The APT sequence was a 3D Turbo-Spin-Echo Dixon sequence with in-built B0 correction. A 2s, 2 μT saturation pulse that alternated over the transmit channels was applied at ±3.5ppm around the water resonance. The APT-weighted image (APTw) was computed as the Magnetization Transfer Ratio asymmetry (MTRasym) at 3.5ppm. It was expressed as a percentage and mapped to a colorscale5,6. Scan parameters were: voxel size = 1.8 x 1.8 x 6 mm3, TR/TE = 6120 / 7.8 ms, TSE factor = 174, SENSE acceleration = 1.6, FH coverage = 60mm.Image analysis and interpretation were done by two neuroradiologists (combined 15 years of experience). ROI areas (=9mm2) were positioned on the enhancing component of the lesion. For non-enhancing lesions, the ROI was positioned on the segment of the lesion with the least apparent diffusion coefficient. Maximal MTRasym values within this ROI were used for the analysis. Intratumoral susceptibility areas, areas of necrosis/cystic changes were avoided.
The diagnosis was established by histopathological examination of the surgical or stereotactic biopsy specimen. Central Nervous System tuberculosis was deemed the aetiology for lesions that responded to antitubercular therapy (size and oedema reduction) or when the Cerebro-Spinal Fluid examination was confirmatory. Non-parametric Mann-Whitney test was used to analyse group-level differences.
RESULTS
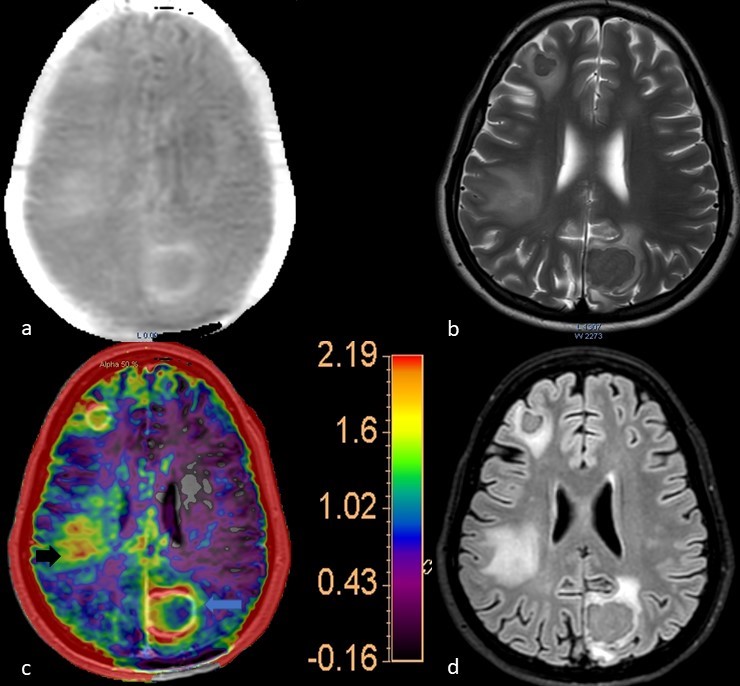
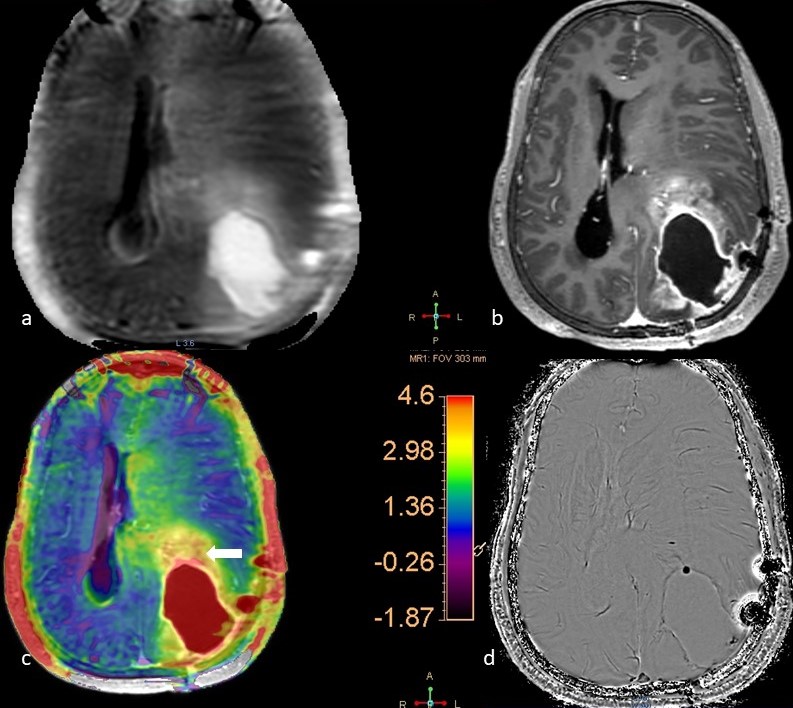
The analysis included 14 Tuberculomas and 17 High-grade Gliomas (WHO grade III/IV). No significant differences were noted in the age and the gender distribution between these two subjects’ groups. The MTRasym values of the Tuberculomas ranged from 1.34% to 3.11% (mean 2.32±0.50 s.d.; Fig. 1-blue arrow). High-grade gliomas had MTRasym values from 2.40% to 5.70% (mean 4.32±0.84s.d.; Fig. 2- white arrow). Note that the colour scale in Figures 1 and 2 have been adopted to the corresponding highest MTRasym values. The group-level difference was statistically significant (p<0.001). In cases of tuberculomas, the APTw images were remarkable for high MTRasym values (compared to contralateral uninvolved white matter) in the perilesional oedematous appearing parenchyma (Fig. 1, right inferior parietal region-black arrow).DISCUSSION
Amide protons in mobile proteins and peptides are the key determinant of APT image contrast3. The rationale for using APT in glioma characterization7,8 is that synthesis of mobile (cytosolic) proteins covaries with the tumoral proliferative activity9. High-grade tumours, with a commensurate increase in cytosolic protein concentrations, thus demonstrate high APT signal. Tuberculomas in sharp contradistinction, have been described to have lesion microenvironments with a relatively reduced concentration of peptides. The peptide and mobile amide proton concentration in the tuberculomas is indeed lower than other infectious focal lesions (like Neurocysticercosis)4. We posit that the observed intergroup difference in APTw values is indeed reflective of this inherent difference in peptide composition between tuberculomas and high-grade gliomas. Higher APT values (compared to uninvolved white matter) have been reported in the peritumoral FLAIR signal changes reiterating the notion of tumor+edema10. The observation of high MTRasym ratios in the “vasogenic” perilesional oedema (wherein no cellular infiltration is seen) in tuberculomas is noteworthy. We are currently assessing whether this elevated MTRasym represents the inflammatory milieu in the perilesional parenchyma.CONCLUSION
Tuberculomas show significantly lower MTRasym ratios compared to high-grade gliomas, reflective of a relative paucity of mobile amide protons in the ambient microenvironment. This finding holds adjunctive and discriminatory value in the Indian subcontinent where a diagnostic dilemma between these two entities frequently arises. Perilesional elevated MTRasym values in the tuberculomas are a novel observation that may hint upon the inflammatory milieu.Acknowledgements
No acknowledgement found.References
1. Suslu HT, Bozbuga M, Bayindir C. Cerebral tuberculoma mimicking high grade glial tumor. Turk Neurosurg. 2011;21(3):427–9.
2. Peng J, Ouyang Y, Fang W-D, Luo T-Y, Li Y-M, Lv F-J, et al. Differentiation of intracranial tuberculomas and high grade gliomas using proton MR spectroscopy and diffusion MR imaging. Eur J Radiol. 2012 Dec;81(12):4057–63.
3. Zhou J, Heo H-Y, Knutsson L, van Zijl PCM, Jiang S. APT-weighted MRI: Techniques, current neuro applications, and challenging issues: APTw MRI for Neuro Applications. J Magn Reson Imaging. 2019 Aug;50(2):347–64.
4. Gupta RK, Kathuria MK, Pradhan S. Magnetization Transfer MR Imaging in CNS Tuberculosis. American Journal of Neuroradiology. 1999 May 1;20(5):867–75.
5. Togao O, Keupp J, Hiwatashi A, Yamashita K, Kikuchi K, Yoneyama M, et al. Amide proton transfer imaging of brain tumors using a self-corrected 3D fast spin-echo dixon method: Comparison With separate B0 correction. Magn Reson Med. 2017;77(6):2272–9.
6. Togao O, Hiwatashi A, Keupp J, Yamashita K, Kikuchi K, Yoshiura T, et al. Amide Proton Transfer Imaging of Diffuse Gliomas: Effect of Saturation Pulse Length in Parallel Transmission-Based Technique. PLoS ONE. 2016;11(5):e0155925.
7. Choi YS, Ahn SS, Lee S-K, Chang JH, Kang S-G, Kim SH, et al. Amide proton transfer imaging to discriminate between low- and high-grade gliomas: added value to apparent diffusion coefficient and relative cerebral blood volume. Eur Radiol. 2017 Aug;27(8):3181–9.
8. Su C, Liu C, Zhao L, Jiang J, Zhang J, Li S, et al. Amide Proton Transfer Imaging Allows Detection of Glioma Grades and Tumor Proliferation: Comparison with Ki-67 Expression and Proton MR Spectroscopy Imaging. American Journal of Neuroradiology. 2017 Sep 1;38(9):1702–9.
9. Yan K, Fu Z, Yang C, Zhang K, Jiang S, Lee D-H, et al. Assessing Amide Proton Transfer (APT) MRI Contrast Origins in 9 L Gliosarcoma in the Rat Brain Using Proteomic Analysis. Mol Imaging Biol. 2015 Aug;17(4):479–87.
10. Kamimura K, Nakajo M, Yoneyama T, Takumi K, Kumagae Y, Fukukura Y, et al. Amide proton transfer imaging of tumors: theory, clinical applications, pitfalls, and future directions. Jpn J Radiol. 2019 Feb;37(2):109–16.
Figures