3107
Significant changes of APT signal in the Substantia Nigra and striatum of subacute PD mouse induced by MPTP1School of Biomedical Engineering, Southern Medical University, Guangzhou, China, 2Philips healthcare, Guangzhou, China
Synopsis
Chemical exchange saturation transfer (CEST) MRI has been widely investigated for the early diagnosis of neurological diseases, such as brain tumor and neurodegenerative disorders. The goal of this study was to develop an imaging biomarker for the future intervention and treatment of PD in clinic. For such purpose, a novel radial-sampling steady-state CEST sequence based ultrashort echo time (UTE) readout was used to acquire the Z-spectrum in the mouse brain of subacute PD model induced by MPTP.
Synopsis
Chemical exchange saturation transfer (CEST) MRI has been widely investigated for the early diagnosis of neurological diseases, such as brain tumor and neurodegenerative disorders. The goal of this study was to develop an imaging biomarker for the future intervention and treatment of PD in clinic. For such purpose, a novel radial-sampling steady-state CEST sequence based ultrashort echo time (UTE) readout was used to acquire the Z-spectrum in the mouse brain of subacute PD model induced by MPTP.Introduction
Parkinson’s disease (PD) is a neurological disorder caused by degeneration of dopaminergic neurons in substantia nigra and striatum, with cardinal symptom of dyskinesia and resting tremor[1]. PD diagnosis and severity evaluation are crucial for the disease treatment in clinic. Chemical exchange saturation transfer (CEST) MRI is a novel molecular imaging technique and sensitive to many endogenous labile protons, which has recently been investigated for the early diagnosis of PD. Initial study in PD patient have showed that CEST/APT signal could be an potential imaging biomarker[2]. In this study we used a novel UTE-CEST sequence to acquire the Z-spectrum to detect the mobile protein changes in subacute mouse model of PD treated by 1-Methyl-4-phenyl-1,2,3,6-tetrahydropyridine (MPTP)[3][4]. Using a relatively weak RF saturation amplitude, contributions due to strong magnetization transfer contrast (MTC) from solid-like macromolecules and direct water saturation (DS) were minimized. We suppose that such obtained imaging biomarker may be better for the early diagnosis of Parkinson’s disease and the accurate evaluation of disease severity.Methods
Animal experiment All animals were performed under a protocal approved by our institutional animal care and used committee. C57BL/6 WT mice (Center for experimental animals, Southern Medical University, Guang Zhou, China) were given 1-Methyl-4-phenyl-1,2,3,6-tetrahydropyridine (MPTP, Sigma M0896-30) by intraperitoneal injection for six day (n=6, 25 mg/kg, soluted in saline), and control group (n=6) were given the same volume of saline. Mouse were imaged two weeks after the model become stable and then executed for pathological examination.UTE-CEST All animals were scanned on a 7 T small-bore MRI scanner (Bruker Biospec, Billerica, MA) equipped with a mouse brain surface array RF coil (receiver) and a 72 mm volume coil. All animal were anesthetized using 3% isoflurane and 1-2% maintenance. The mouse head was positioned using a bite bar and two ear pins. A water-heated animal bed was used to keep the temperature of mouse. UTE-CEST imaging was conducted with Gaussian presaturated pulse, ultra short echo time readout and radially fills the k-space. The duration of Gaussian saturation pulse was 30 ms, and the saturation power = 0.9 μT, repetition time (TR) = 40 ms, effective echo time (TE) = 0.4 ms, slice thickness = 1.5 mm, nominal Cartesian acquisition matrix size = 90 × 90, FOV = 15 × 15 mm2. Z-spectrum acquired in the range of ±8 ppm, frequency step size is 0.1 ppm around the -3.5, 0 and 3.5 ppm, and 0.5 ppm step size for another region of z-spectrum.
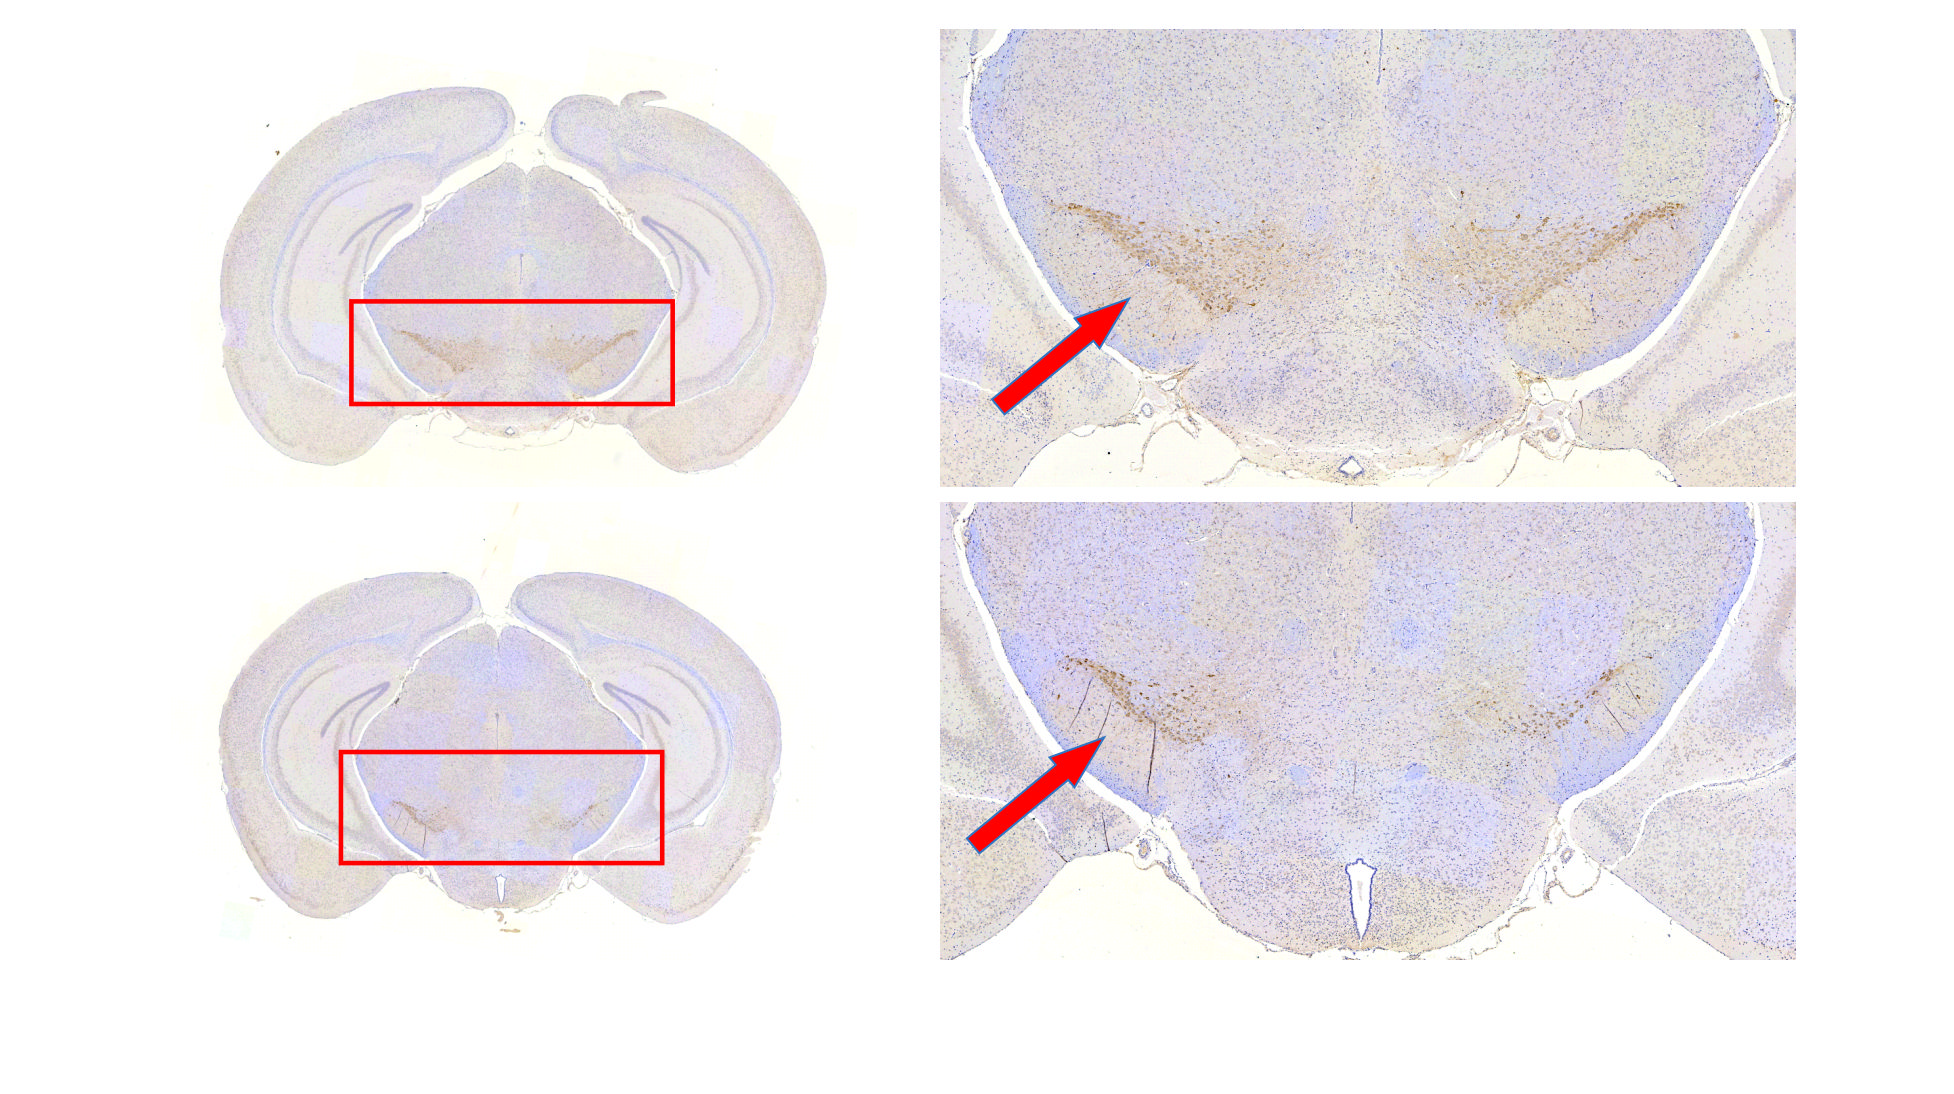
Histology/immunohistochemical The mouse brain were immediately fixed in 4% paraformaldehyde for 24h, embedded in paraffin, coronal sections of the substantia nigra and striatum at a thickness of 5 μm, then stained with hematoxylin–eosin (HE), and tyrosine hydroxylase(TH).
Data processing The CEST signal was subtracted by ΔST(±3.5ppm)=Z(8ppm)-Z(±3.5ppm).
Result
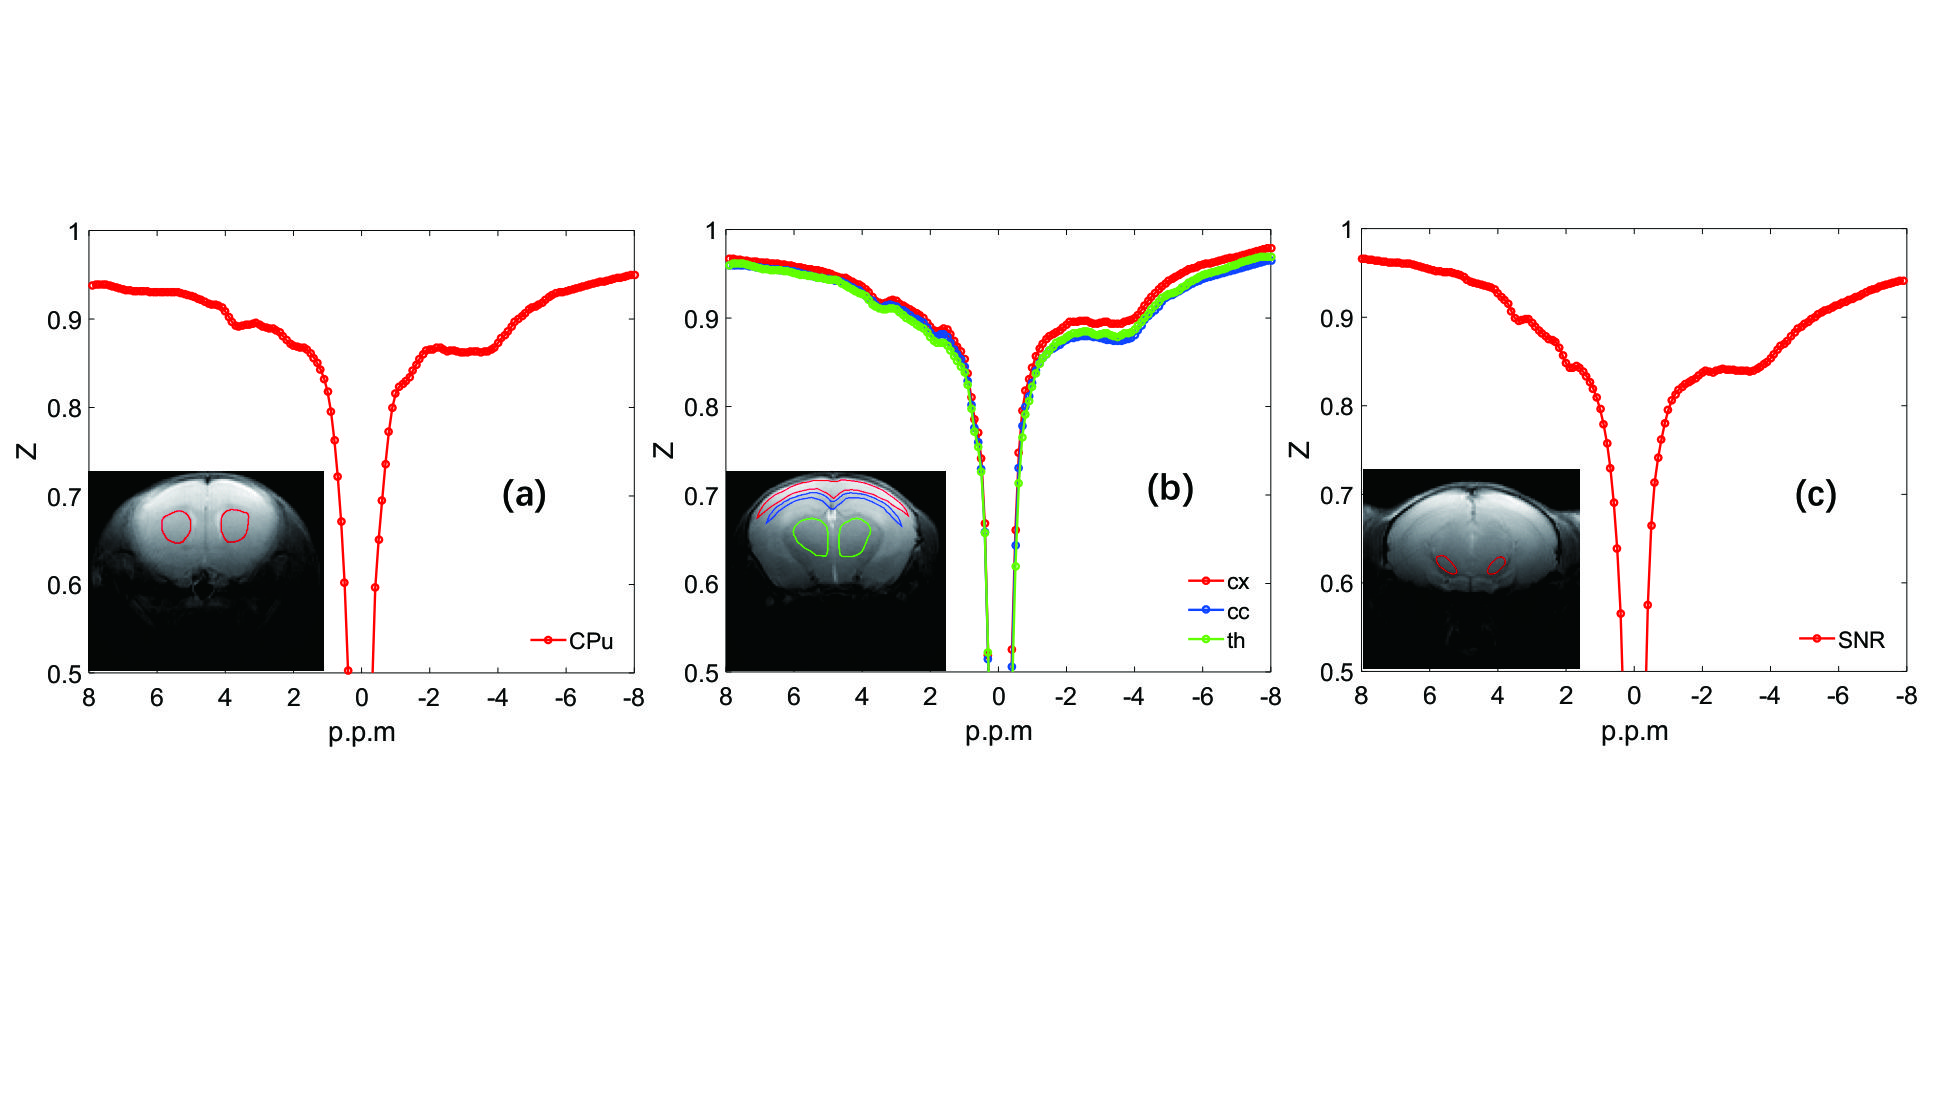
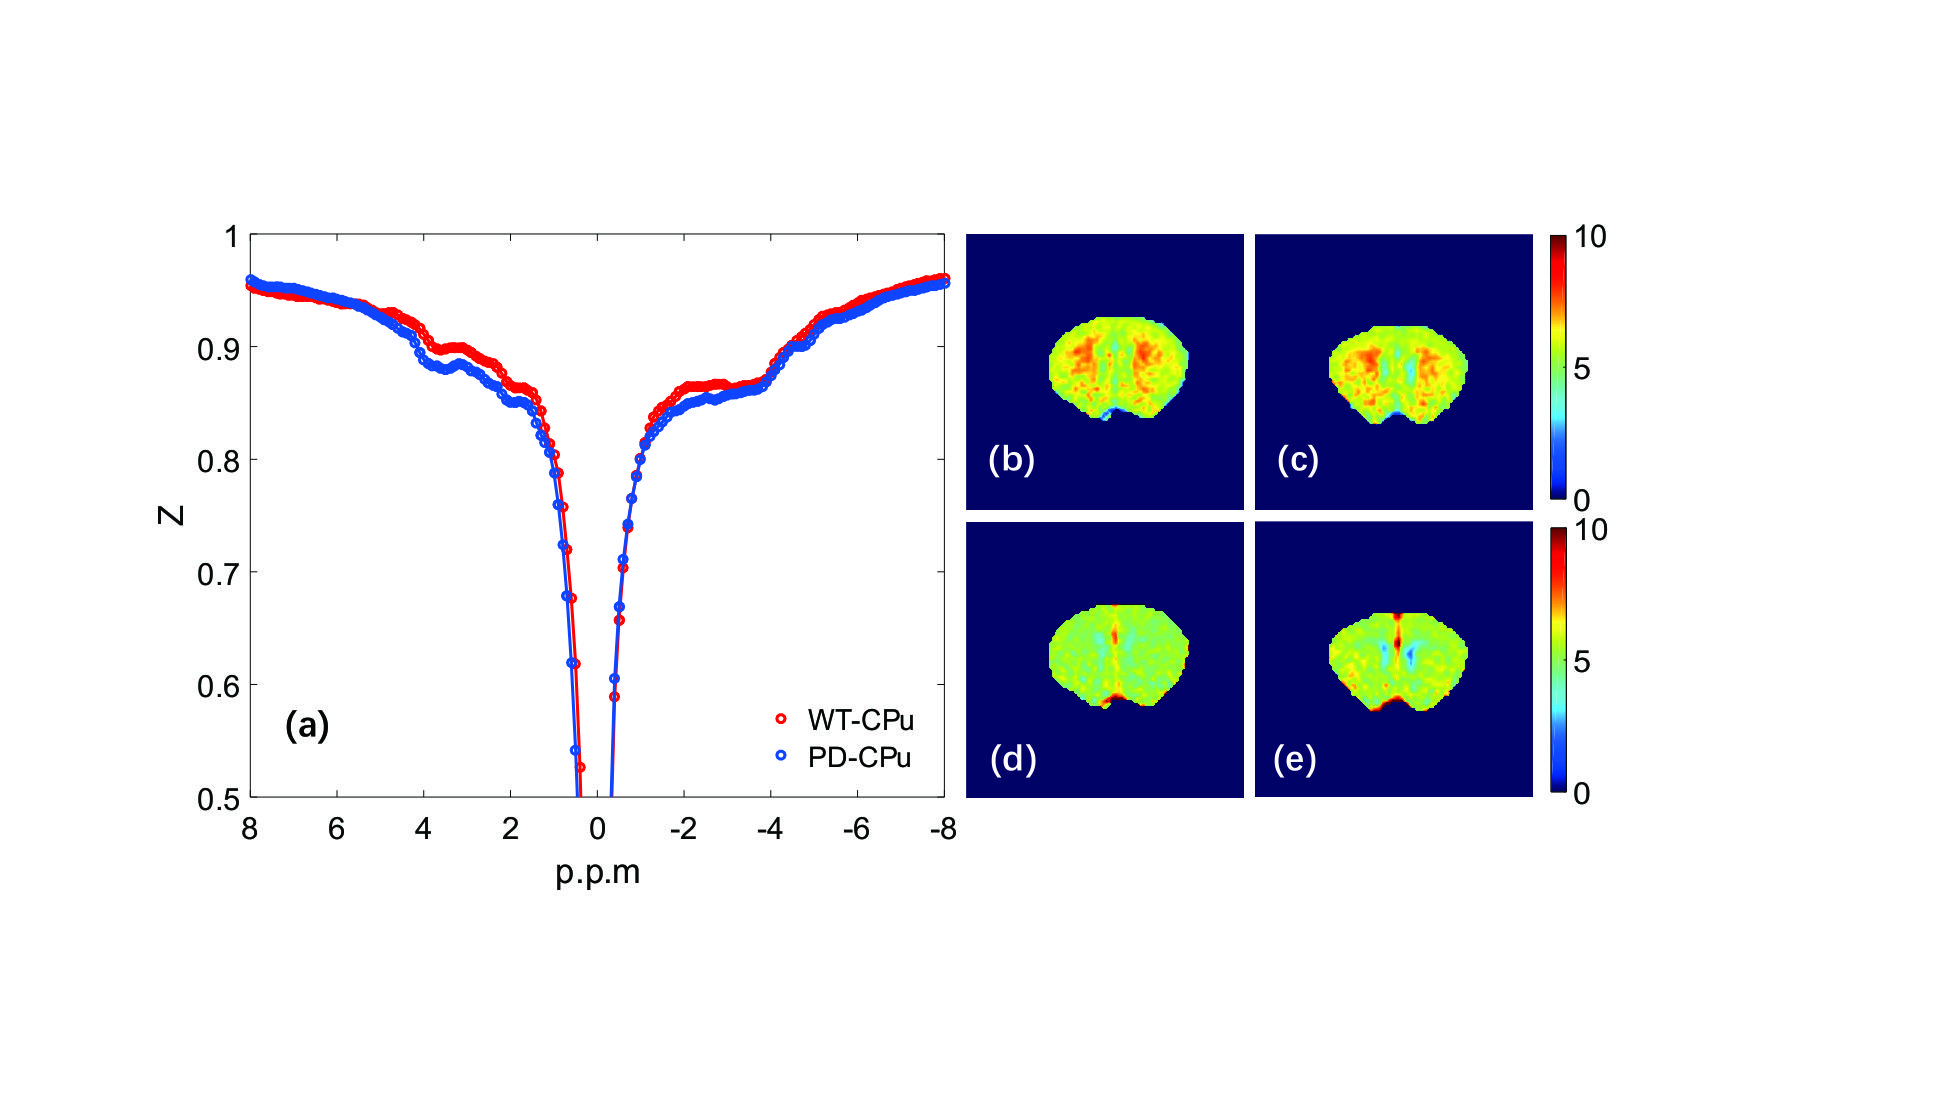
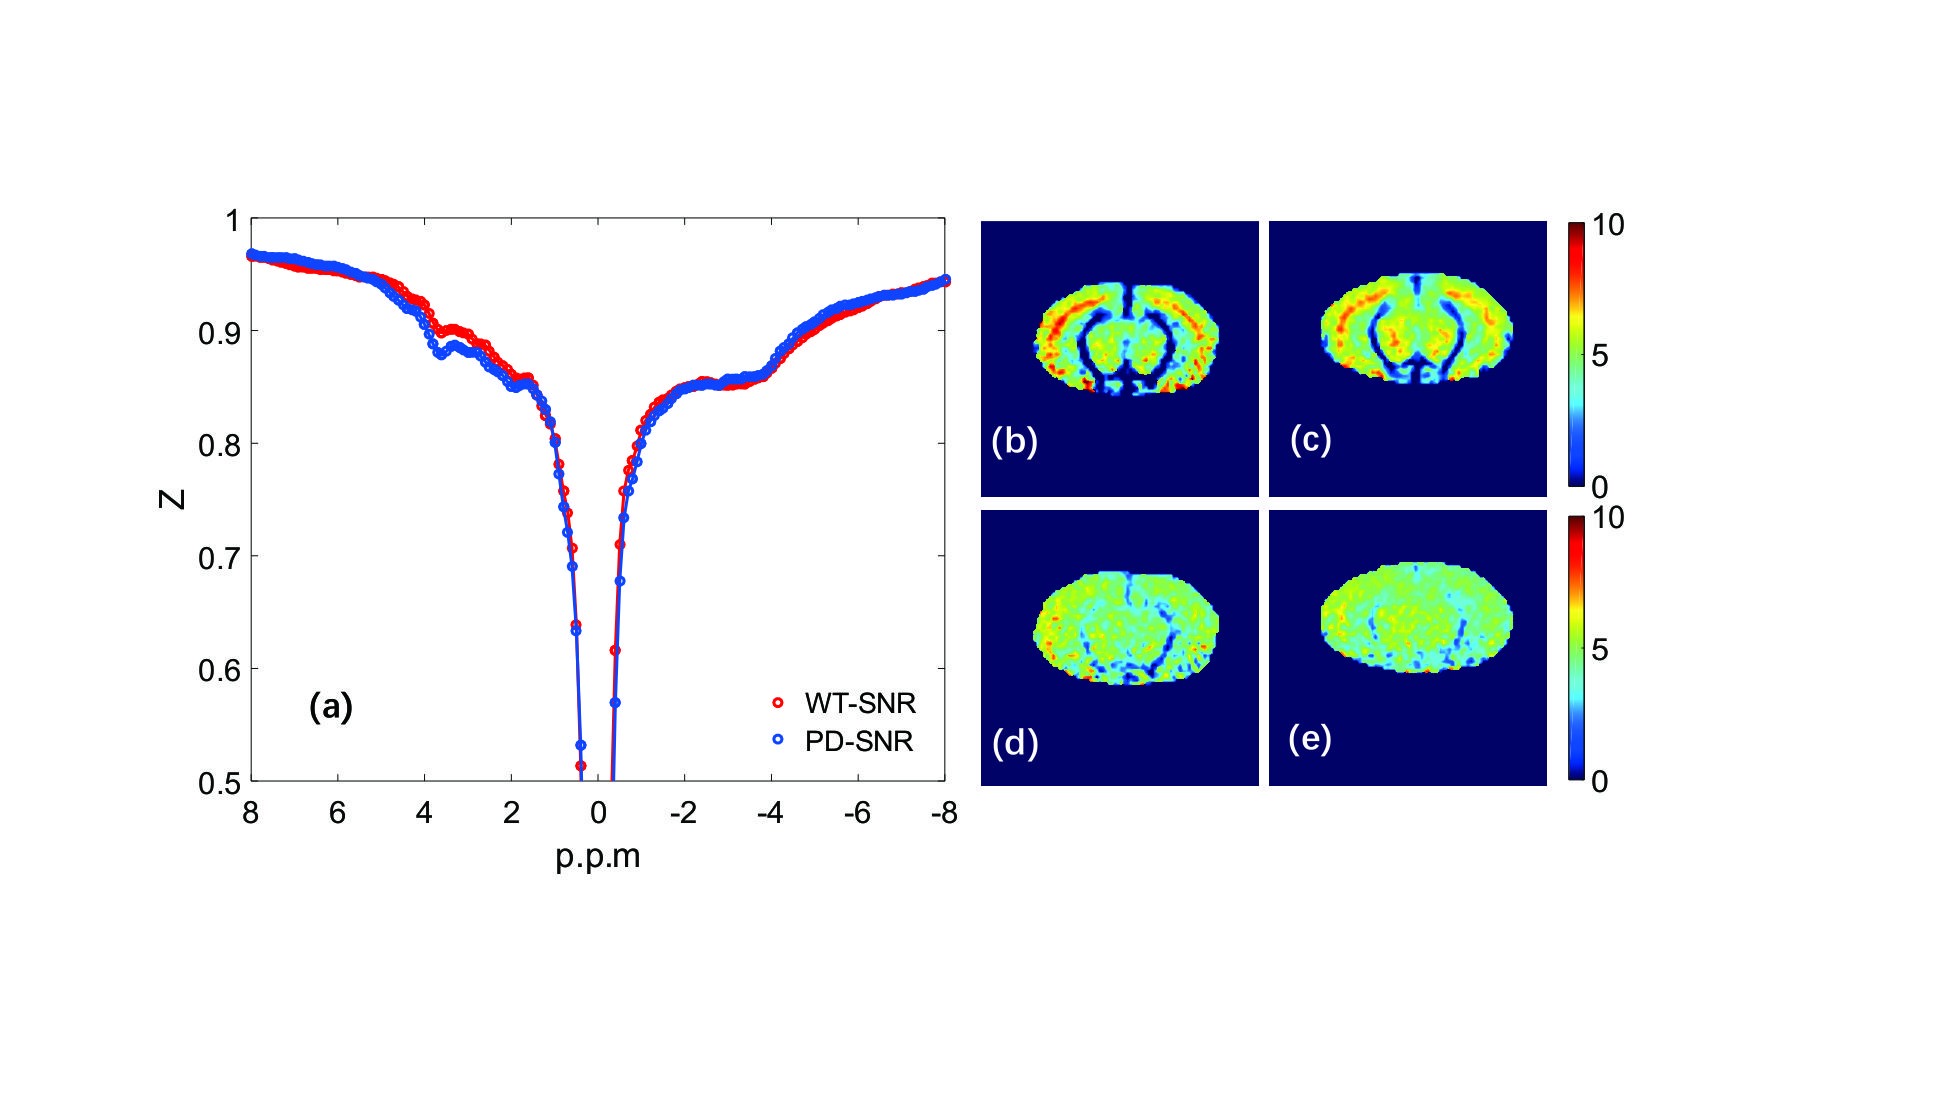
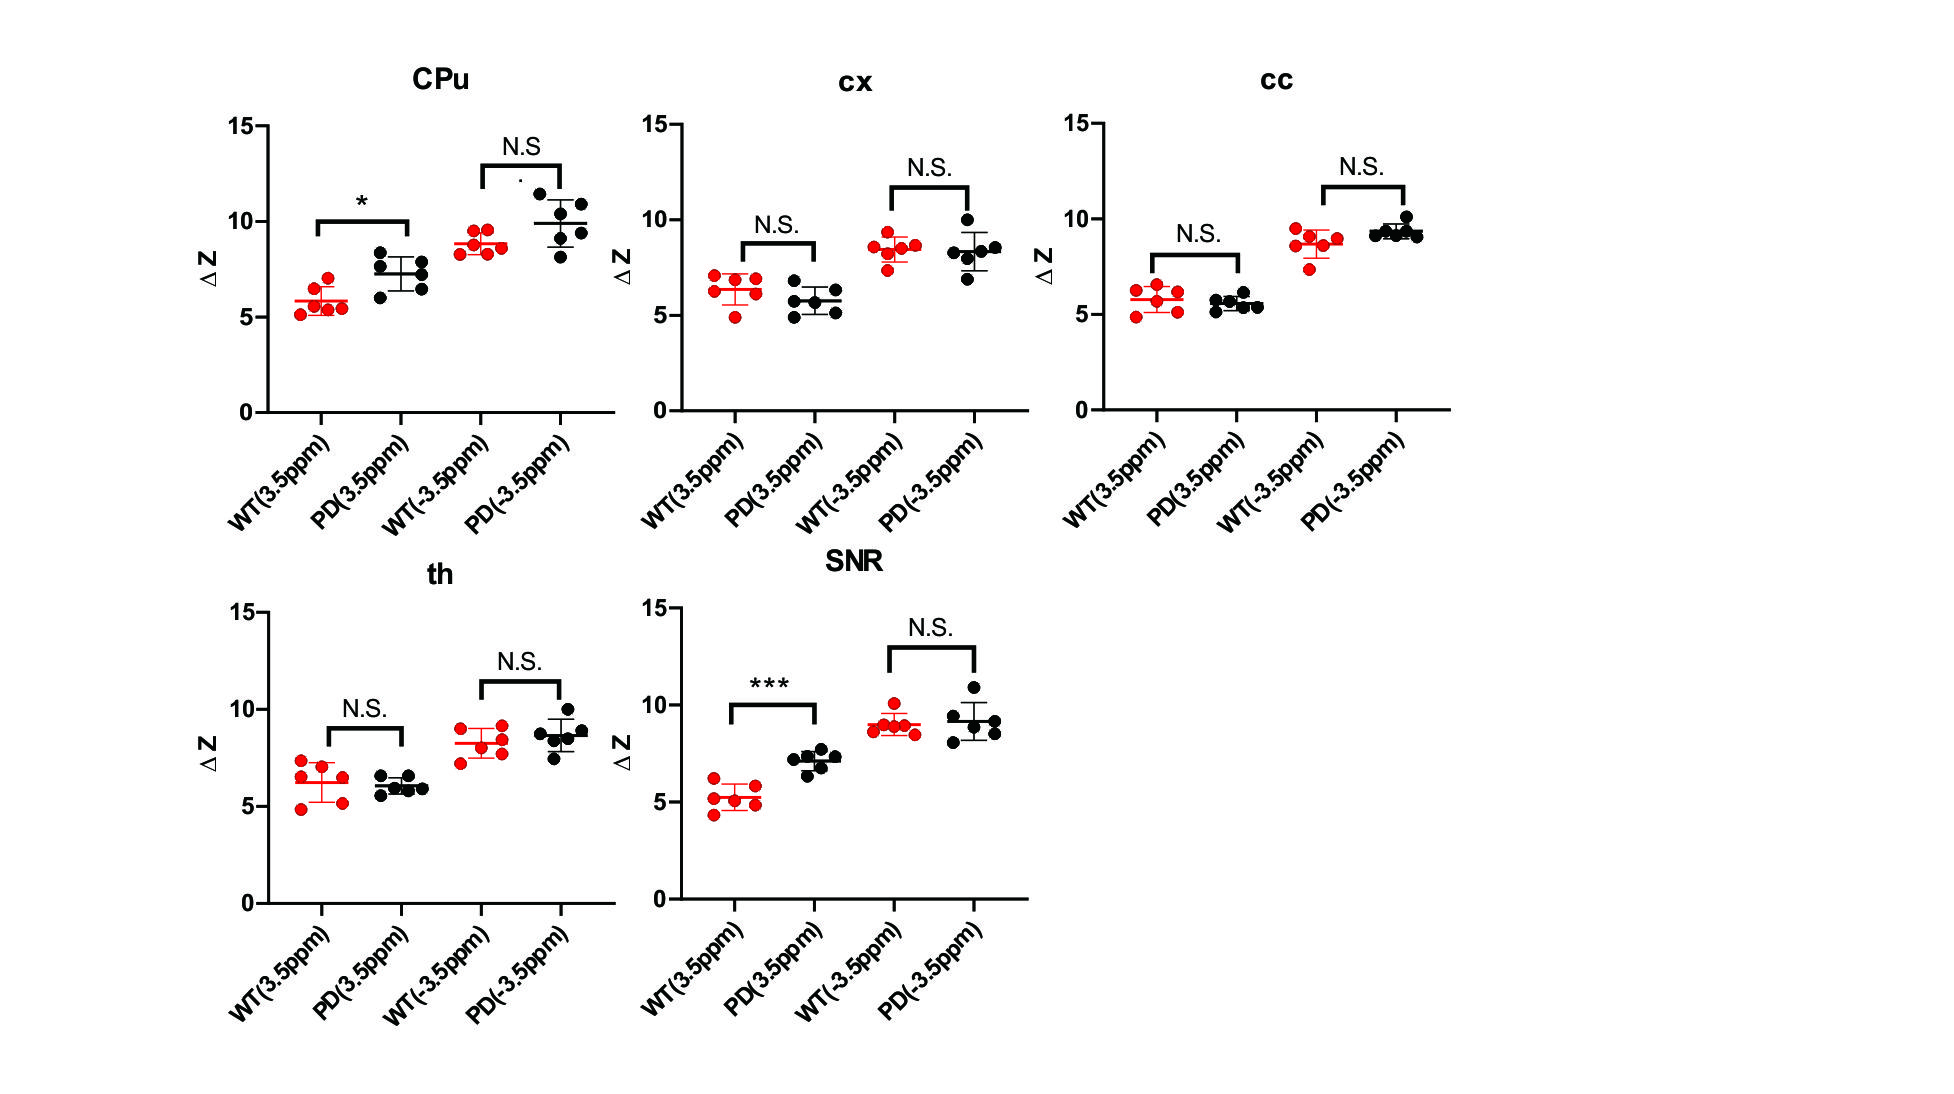
Histology/immunohistochemical Figure 1 show the tyrosine hydroxylase (TH) immunohistochemical staining for substantia nigra (SNR), the staining of tyrosine hydroxylase were significantly weakened, which proved the PD model induced by MPTP were established.UTE-CEST In figure 2, the z-spectrum of CPu, cx, cc, th and SNR in WT mouse were shown. Figure 3 (a) shows the representative average z-spectrum of CPu from WT and PD mice, clearly signal difference at 3.5 ppm between two sorts of mouse, figure 3 (b), (c), (d), (e) show the NOE and APTw image of CPu in WT mice and PD mouse, respectively. Similarly, figure 4 show the average z-spectrum, NOE and APTw image of SNR. From figure 5, we have concluded that the APT signal in PD mice was significantly different from in WT mice, both in the region of CPu and SNR, the APT improved 24% (p<0.05) and 35% (p<0.001), respectively. In cx, cc and th, the APT show no significant difference. NOE also be measured, but there were no significant difference in these five region of brain between PD and WT mouse.
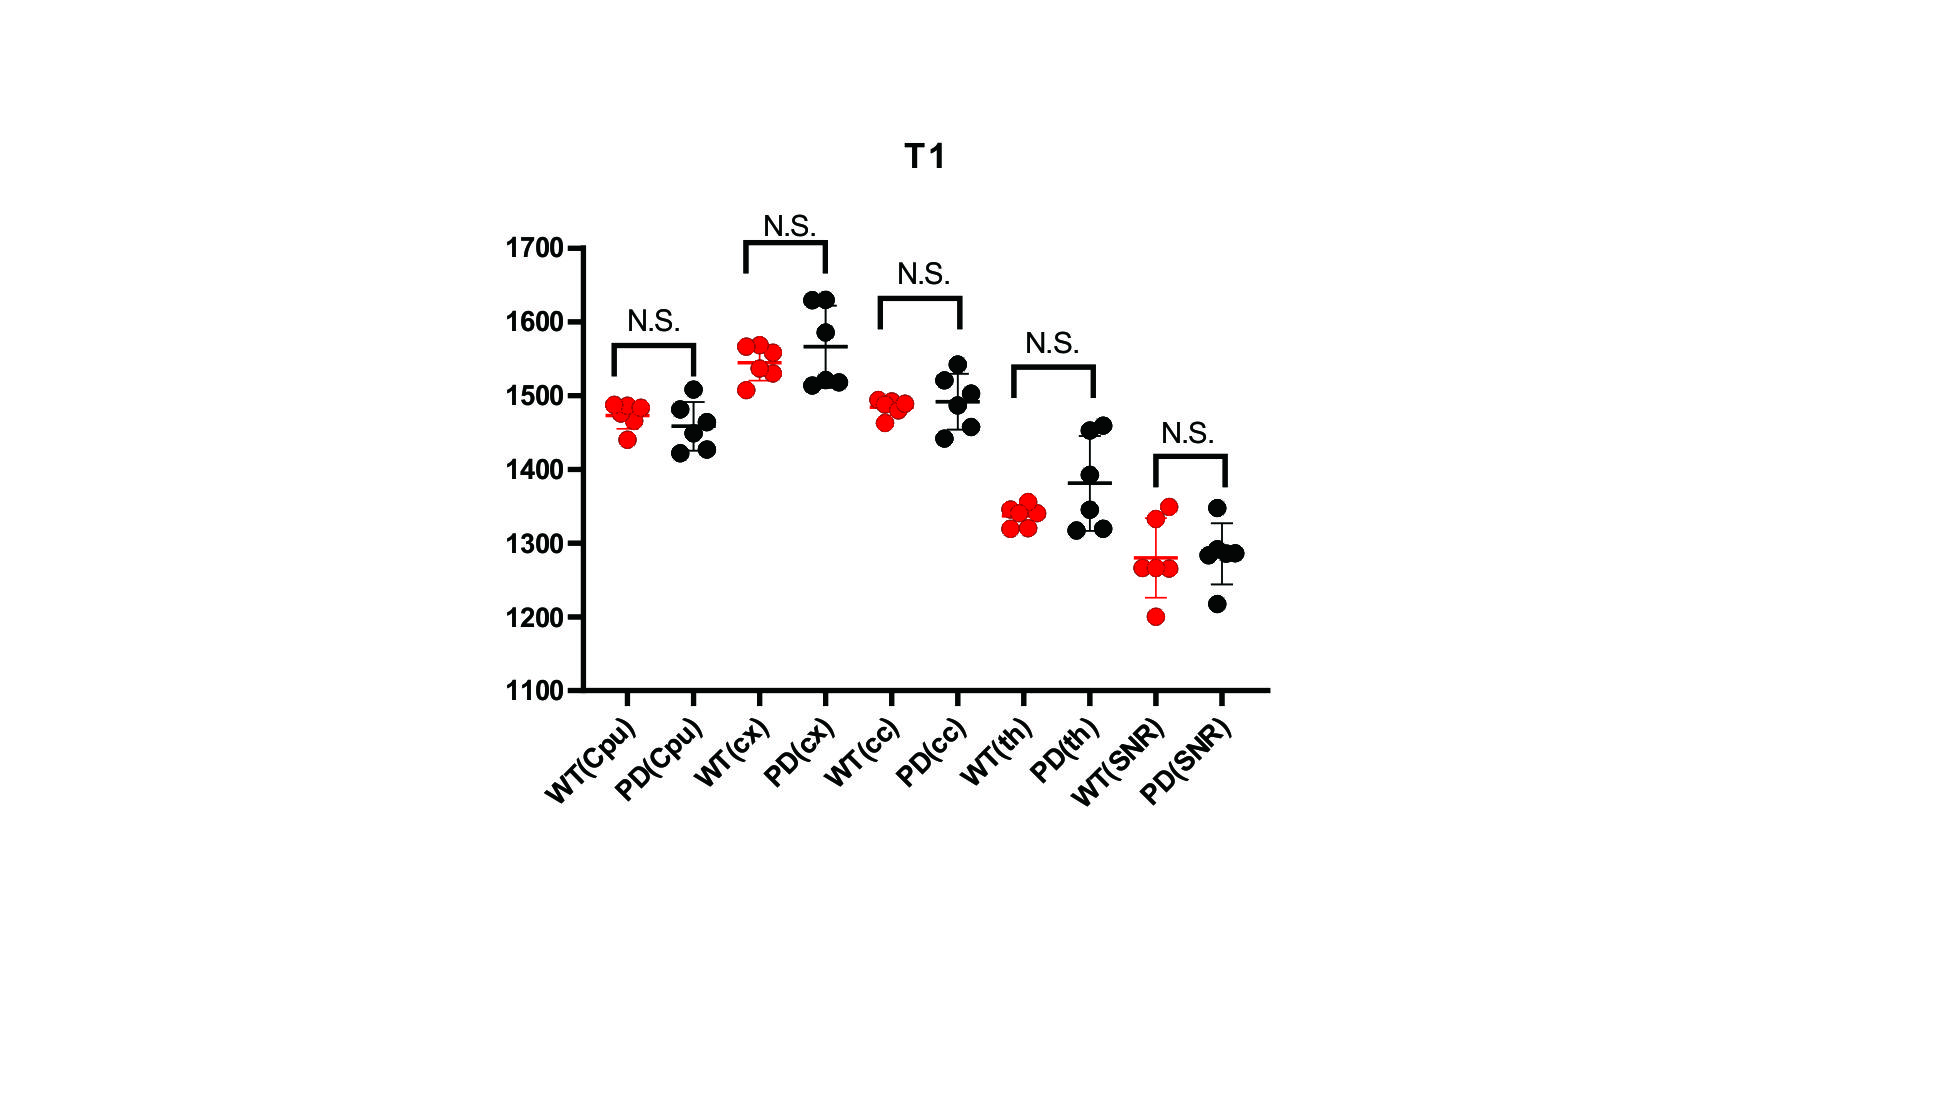
T1 relaxation To exclude the influenced by T1-weighted, T1 values was measured. The mean T1 values were 1.473±0.032 s and 1.459±0.052 s for Cpu in PD and WT mouse (P=0.349), as for SNR, the mean T1 values were 1.280±0.062 s and 1.285±0.069 s in the two group of mouse (P=0.849). There are also no significant difference of T1 values in the cx, cc and th.
Discussion and Conclusion
In this study, we quantify the APT signal in PD mouse induced by MPTP,the APT increase significantly, where the rNOE and T1 have not significant difference, UTE readout improve the detection precision. It indicate CEST MRI is potential method to detect the PD. However, MPTP induced PD model not on all full with in clinical, further researchs are still needed to validate the mechanism of Parkinson’s disease and the origination of the APT signal alteration in PD.Acknowledgements
This work was supported by the Guangdong Provincal Medical Foundation (A2018268).References
[1] Poewe W, Seppi K, Tanner C M, et al. Parkinson disease[J]. Nature reviews Disease primers, 2017, 3: 17013.
[2] Li C, Peng S, Wang R, et al. Chemical exchange saturation transfer MR imaging of Parkinson’s disease at 3 Tesla[J]. European radiology, 2014, 24(10): 2631-2639.
[3] Smeyne R J, Jackson-Lewis V. The MPTP model of Parkinson's disease[J]. Molecular brain research, 2005, 134(1): 57-66.
[4] Chen L, Wei Z, Chan K W Y, et al. Protein aggregation linked to Alzheimer's disease revealed by saturation transfer MRI[J]. NeuroImage, 2019, 188: 380-390.
Figures