3104
Post-acquisition correction of the T1 relaxation effect for fast multi-slice CEST MRI
Tao Jin1
1University of Pittsburgh, Pittsburgh, PA, United States
1University of Pittsburgh, Pittsburgh, PA, United States
Synopsis
Rapid multi-slice CEST MRI can be achieved by the immediate acquisition of multiple slices after a single irradiation pulse. However, the signals from the slices acquired after the 1st slice are contaminated by the T1-relaxation relaxation effect. In this work, we propose a simple post-acquisition correction method to compensate for the relaxation effect in the multi-slice CEST signals.
Introduction
Chemical exchange saturation transfer (CEST) MRI signal is usually measured with long irradiation followed by an imaging module. With the immediate acquisition of multiple slices after a single irradiation pulse, the signals from the slices acquired after the 1st slice are contaminated by the T1-relaxation relaxation effect. In this work, we propose a simple post-acquisition correction method to compensate for the relaxation effect in multi-slice CEST MRI signals.Materials and Methods
Theory:Assuming the delay between the end of irradiation and the acquisition of the i-th slice is tacq(i), the CEST signal of the i-th slice acquired at an RF offset of Ω can be expressed as
$$$S(\varOmega,i)=S_{0}+[S_{corr}(\varOmega,i)-S_{0}]\cdot e^{-t_{acq}(i)\diagup T_{1}}$$$ [1]
where S0 is the fully-relaxed signal, and Scorr is the signal when the T1 relaxation effect is corrected. At an offset of Ω = 0, we have full direct water saturation so that the signal without T1 relaxation effect should be zero. Thus
$$$S(\varOmega=0,i)=S_{0}+[S_{corr}(\varOmega=0,i)-S_{0}]\cdot e^{-t_{acq}(i)\diagup T_{1}}=S_{0}\cdot (1-e^{-t_{acq}(i)\diagup T_{1}})$$$ [2]
Combine Eqs. [1] and [2], we have
$$$S_{corr}(\varOmega,i)\diagup S_{0}=\frac{S(\varOmega,i)\diagup S_{0}-S(\varOmega=0,i)\diagup S_{0}}{1-S(\varOmega=0,i)\diagup S_{0}}$$$ [3]
From Eq. [3] we can derive the T1 relaxation-corrected asymmetric magnetization transfer ratio (MTRasym) as
$$$MTR_{asym}(\varOmega,i)=\frac{MTR_{asym}(\varOmega,i)}{1-S(\varOmega=0,i)\diagup S_{0}}$$$ [4]
Equations [3] and [4] show that for both the Z-spectrum and the MTRasym spectrum, the T1-relaxation effect of multi-slice imaging can be readily corrected using the signals acquired from each slice at Ω = 0.
Experiments
Phantom experiments were performed at 9.4 T at room temperature. 40 mM of creatine was dissolved in relaxation saline (PBS) and titrated to pH = 7.0, with an addition of 0.15 mM MnCl2 to reduce the water T1 and T2 relaxation times. Also, 20% of bovine serum albumin (BSA) was dissolved in PBS, titrated to pH = 7.0, and heated to 75oC for 15 minutes. CEST Z-spectra were acquired for three saturation power values of 40 Hz, 60 Hz, and 80 Hz, with RF offset ranging from 7 ppm to -7 ppm. A single-shot spin-echo EPI was used to acquire five slices immediately after a 7 s continuous wave saturation, and the acquisition delay tacq between each slice was adjusted to be 50 ms or 100 ms. The repetition time between the acquisition of one RF offset and the beginning of the saturation pulse of the next offset is 10 s.
Results and Discussions
The addition of MnCl2 shortens the T1 of the creatine phantom to 0.65 s so that the T1-relaxation effect can easily be detected in multi-slice imaging. Fig. 1 shows clear distinctions among the Z-spectra and the MTRasym spectra measured from five slices. The peak of MTRasym at 1.9 ppm for the last slice is reduced by 15% as compared to the 1st slice (#5 versus #1). Using the data of Ω = 0, the Z-spectra and the MTRasym spectra from the five slices can be corrected with Eq. [3] and [4], respectively. Fig. 2 shows that this simple correction method works very well, and the match of multi-slice spectra is excellent. In Fig. 3a, the Z-spectra from the heated BSA phantom were closer to the in vivo tissue and showed MT, CEST, and NOE effects. Again, the T1-relaxation effect can be corrected using Eq. [3] for the multi-slice spectra (Fig. 3b). Our approach relies on the accurate measurement of S(Ω = 0). When significant B0-inhomogeneity is present, this data-point can be obtained by a separate WASSR measurement 1, or by interpolation and fitting of Z-spectrum, including the use of high order polynomials 2. Alternatively, using a high power saturation pulse can saturate the water signal for a wider B0 range. Fig. 4a indicated that for a saturation pulse of 0.8 μT and 5 s, there was significant variation in S(Ω = 0) of the heated BSA sample if the B0 was shifted by a few tens of Hz. In contrast, the S(Ω = 0) is insensitive to the B0 shift when a pulse of 0.8 µT and 1 s was used.Recently, a combination of primary saturation and secondary saturation pulses has been proposed to compensate for the relaxation effect for multi-slice CEST imaging 3. Also, post-processing using a T1 map to compensate for the relaxation effect for the CEST contrast has been reported 4. Our method can correct the relaxation effect for the whole Z-spectrum without the acquisition of additional T1 map, or the modification of the pulse sequence.
Conclusions
We reported a simple post-acquisition method to compensate for the T1-relaxation effect in the multi-slice CEST imaging. Importantly, our method can also be easily extended to other modalities where multi-slice images are acquired after a magnetization preparation module, such as MTC, spin-lock, T1-weighted imaging, and diffusion-weighting images.Acknowledgements
Funding support from NIH: R01-NS100703.References
1. Kim M et al., Magn Reson Med 61: 1441–1450 (2009).
2. Zhu H et ail, Magn Reson Med 64: 638–644 (2010).
3. Sun PZ et al., Magn Reson Med 65:588–594 (2011).
4. Sun PZ et al., Magn Reson Med 59:1175–1182 (2008).
Figures
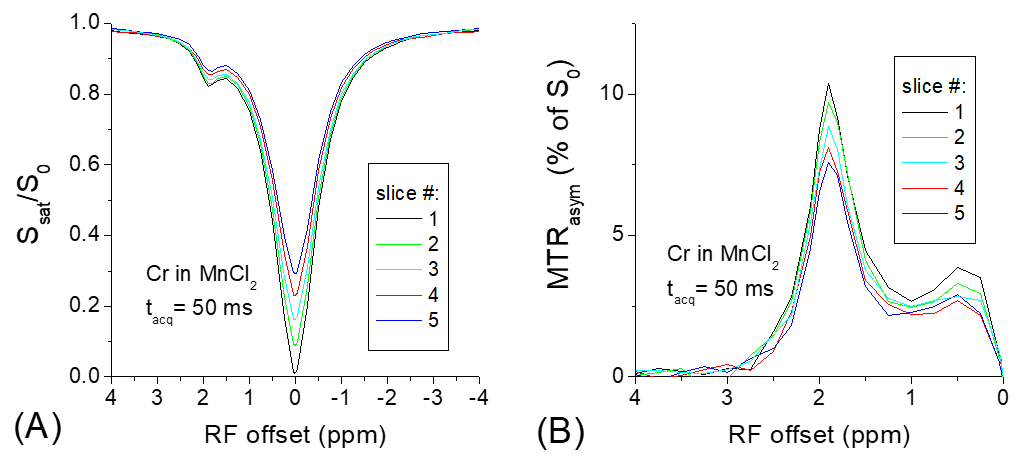
Fig.
1. The
Z-spectra (A) and MTRasym spectra (B) were measured in the Cr sample for 5 slices.
The T1-relaxation effect is clear in the slices acquired after the 1st
slice, leading to a reduced CEST signal.
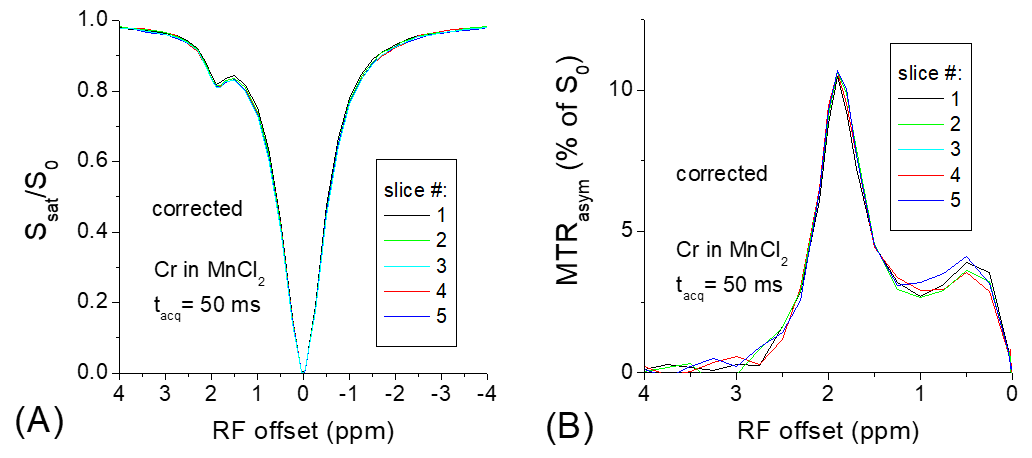
Fig.
2. The
T1-relaxation effects shown in Fig. 1 can be corrected with Eqs. [3]
and [4] for the Z-spectra (A) and MTRasym spectra (B), respectively.
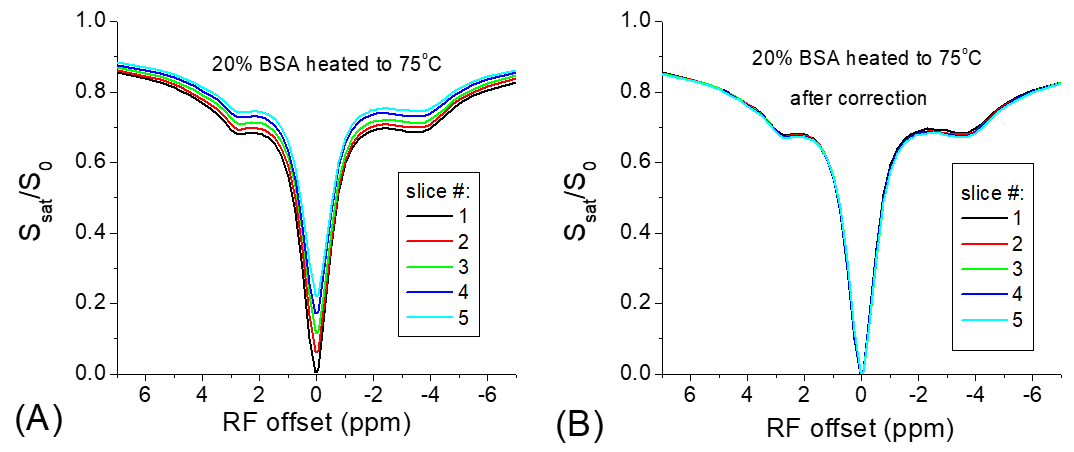
Fig.
3. The
T1-relaxation effect can also be detected (A) and corrected (B) for
the BSA sample which shows MT, CEST and NOE effects.
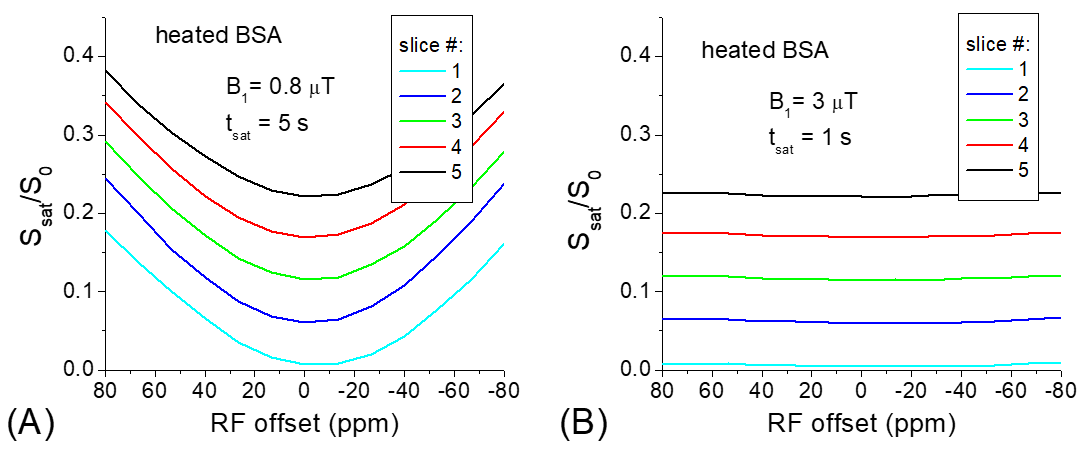
Fig.
4. In the heated BSA
sample, the saturation of the water signal is achieved for a narrow frequency
range with a small saturation power of 0.8 μT (A), and for a
much broader frequency range with a higher saturation power of 3 μT (B).