3103
To Evaluate Effect of Interpolation Methods for B0 inhomogeneity correction on computation of CEST MRI Contrast in Human Brain at 3T and 7T1Centre for Biomedical Engineering, Indian Institute of Technology Delhi, New Delhi, India, 2Biomedical Engineering, AIIMS, New Delhi, India, 3Radiology, University of Pennsylvania, Philadelphia, PA, United States, 4Radiology, Fortis Memorial Research Institute, Gurugram, India
Synopsis
CEST MRI provides high resolution mapping of molecules such as Glutamate, Creatine, labile proteins/peptide, etc. CEST MRI contrast computation using asymmetry analysis require interpolation of data at different frequency offsets for B0 inhomogeneity corrections. In this study, different interpolation methods such as polynomial, cubic, spline and smoothingspline were compared for B0 inhomogeneity correction of various CEST contrasts(GluCEST-w, APT-w, CrCEST-w) at different field strength (3T, 7T). The 2nd and 3rd degree polynomial interpolations provided better B0 inhomogeneity correction for in vivo data from human brain. Polynomial interpolations for APT-w also improved differentiation of high-grade-glioma and low-grade-glioma tumors at 3T.
Introduction
Chemical-Exchange-Saturation-Transfer(CEST)1 MRI is a non-invasive molecular imaging technique that has shown potential applications in pre-clinical2 and clinical studies3. Applications of Amide-proton-transfer-weighted(APT-w)4-6 CEST, Glutamate-weighted CEST (GluCEST-w)7-8, Creatine-weighted CEST (CrCEST-w)9,10, etc. have been reported in different studies4-10. In ideal scenario, only two CEST-weighted (w) images at positive and negative offset frequency are required to compute CEST contrast. But in practical scenario, due to B0 inhomogeneity CEST-w image contains signal intensities from shifted offset frequencies rather than at desired frequency offset. Generally, CEST-w data is acquired at multiple offset-frequencies around frequency of interest for the purpose of B0 inhomogeneity corrections. For B0 inhomogeneity correction, pixel-wise CEST-w intensities obtained within this certain range are interpolated and value at offset-frequency of interest is replaced by the fitted/interpolated data value at adjusted offset-frequency corresponding to frequency shift in the B0 map. Some of the reported studies11,12 on CEST have used cubic interpolation for B0 inhomogeneity correction. Davis, et al13 reported spline interpolation, while Bagga P, et al14 reported polynomial function or linear fitting. Different studies11-14 used various interpolation functions to correct for B0 inhomogeneity. The objective of the current study is to evaluate the effect of interpolation methods to obtain accurate CEST asymmetry contrast using CEST-w data from simulations and in vivo human brain at 3T and 7T.Methods
Simulations: The modified Bloch-McConnell equation based simulations were used to generate CEST data at 7T with saturation parameters root-mean-square B1(B1rms)=2.9µT, duration=800ms at frequency offsets -5ppm to +5ppm with step-size of 0.2ppm. B0 inhomogeneity of 0.1ppm was added to simulated dataset and GluCEST contrast was computed using asymmetry analysis as reported earlier8. Similarly, simulations were carried out to generate APT-w at B1rms=2µT, duration=800ms as well as CrCEST-w data at B1rms=1.4µT, duration=2000ms. Choice of these saturation parameters is based upon reported studies for corresponding CEST contrast. CEST contrast was computed using asymmetry analysis with normalization using control image M0 as well as Mneg.Human brain GluCEST MRI at 7T: Six asymptomatic human volunteers(M:F=5:1;35±14.5years) were scanned at whole body 7T MRI scanner(Siemens). The study protocol included WASSR15, CEST and B1 map data acquired using pulse sequence reported previously7. CEST data were acquired at B1rms=2.9µT and duration=800ms at offset-frequencies ranging from ±1.8ppm to ±4.2ppm in steps of 0.1ppm. CEST data were also acquired at multiple B1rms of 0.7µT, 1.4µT and 2.2µT for B1 inhomogeneity correction.
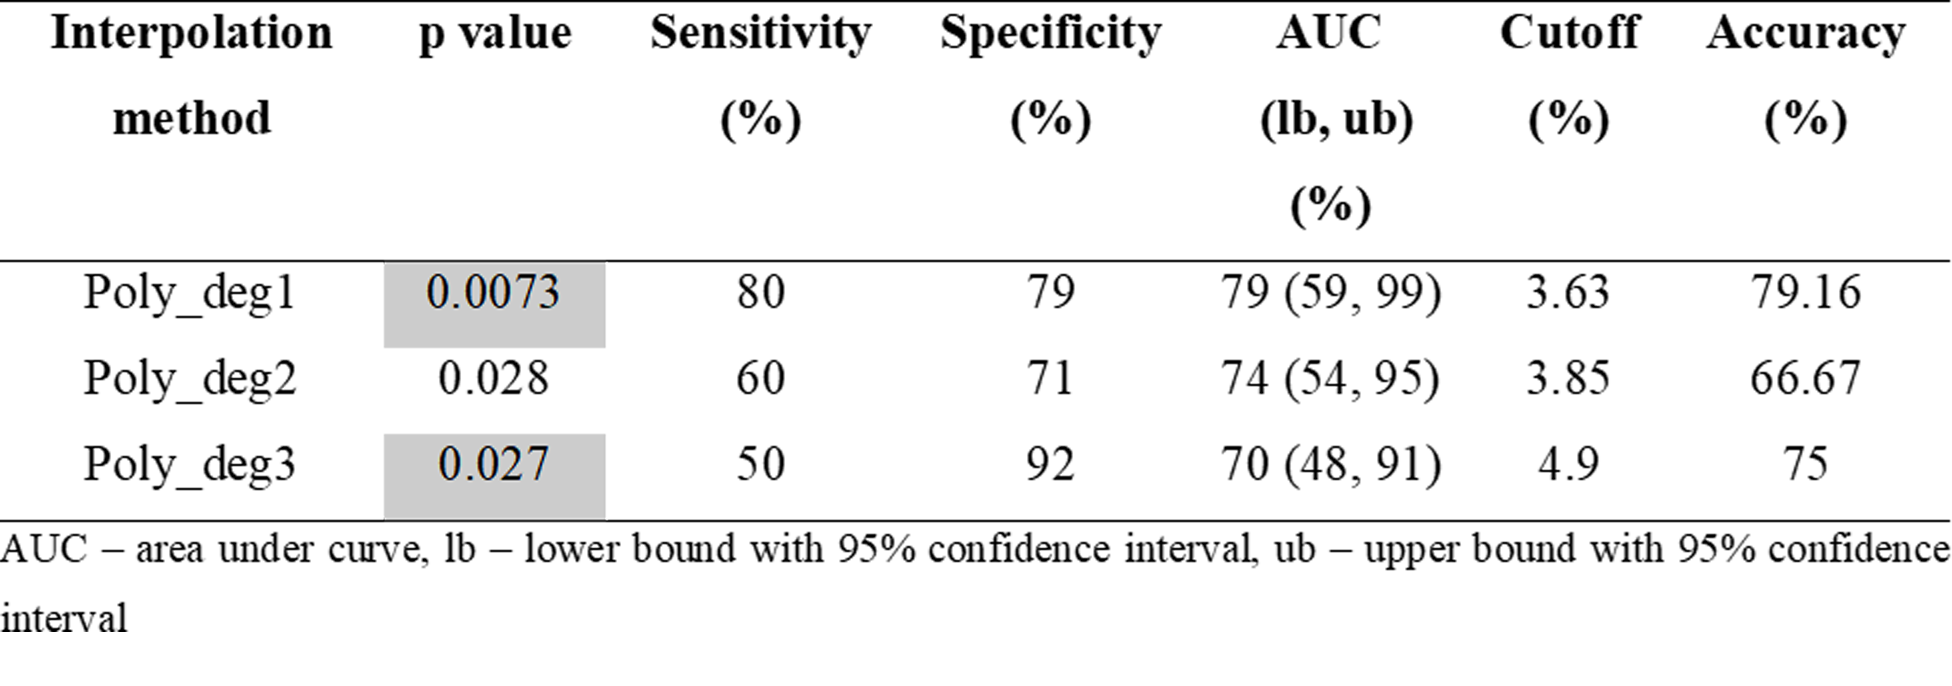
Human brain APT-w MRI at 3T: A total of 24 treatment naive patients (14 low-grade-glioma (LGG); 10 high-grade-glioma (HGG)) were scanned at whole body 3T MRI scanner (Philips). A single slice APT-w images were acquired (positioned through center of lesion) with 64 frequency points (±0 ppm to ±14 ppm with step-size of 0.5 ppm, and control image at 100 ppm) using pulse sequence reported previously6. APT-w contrast corresponding to region-of-interest (ROI)-1 (entire tumor) and ROI-2 (contrast-enhancing tumor) were compared between LGG and HGG using Independent Student’s T-test with two tails. The difference was considered statistically significant if p<0.05.
CEST MRI data for each case was interpolated using various methods such as linear, polynomial (degree=1,2,3), spline, cubic spline and smoothing spline for B0 inhomogeneity correction. Results were compared using goodness-of-fit (R2).
Results
Figure-1 shows comparison of different interpolation methods for GluCEST-w signal intensity(SI) over the frequency range of +1.8ppm to +4.2ppm corresponding to ROI in WM. Accuracy of the linear interpolation(R2=0.98) was less compared to 2nd degree(R2=0.99) and 3rd degree(R2=0.99) polynomial interpolation. The cubic and spline interpolant fits to all the points with R2 =1, while smoothingspline(R2 =0.99) was similar to polynomial interpolant(degree=2, 3). Similar results were observed for APT-w and CrCEST-w SI. Figure 2 presents GluCESTM0-w and GluCESTNeg-w maps for different interpolations. Polynomial provides less noisy maps preserving the distribution of glutamate in WM and GM. Cubic and spline resulted in noisy and poor quality of maps. Smoothingspline provided less noisy maps compared to cubic and spline interpolation. The cubic and spline interpolation resulted in large variations in the values, as can be seen close to mid brain line on APT-w maps in Fig.3 b5 and b6. For the current study data, Polynomial function provided better quality of map compared with other types of interpolations. There was a significant difference(p<0.05) between APT-w contrast of LGG and HGG(Fig.4) corresponding to ROI-2 considering polynomial interpolations (p<0.01 (Fig.4b1); p=0.02 (Fig.4b2); p=0.02 (Fig.4b3)) for correcting B0 inhomogeneity. Table-1 show ROC analysis results and p values of APT-w for differentiation between LGG and HGG.Discussion
Polynomial interpolation fits better to CEST MRI data over a limited range at 7T and 3T. With the further increase in degree of polynomial, interpolation gets better, but it becomes more prone to noise fluctuations. The cubic and spline interpolations are highly sensitive to noise. Polynomial(degree=2, 3) provided more accurate CEST contrast that is less sensitive to noise.Conclusion
The current study showed that for in vivo CEST data(GluCEST-w, APT-w, CrCEST-w), polynomial(2nd & 3rd degree) interpolations provided better B0 inhomogeneity corrected CEST maps at 7T and polynomial interpolation, particularly linear showed improved differentiation of HGG and LGG tumors using APT-w MRI at 3T.Acknowledgements
This study was supported by Indian Institute of Technology Delhi, Fortis Memorial Research Institute Gurugram and University of Pennsylvania. This study was partially supported by funding support from MATRICS, SERB-DST Grant number: MTR_2017_001021. The authors thank Dr. Jinyuan Zhou and Dr. Peter C.M. van Zijl for APT-w pulse sequence. The Authors thanks Dr. Hari Hariharan for CEST pulse sequence for 7T data acquisition.References
1. Ward KM, Aletras AH, Balaban RS. A New Class of Contrast Agents for MRI Based on Proton Chemical Exchange Dependent Saturation Transfer (CEST). J Magn Reson. 2000;143(1):79-87.
2. Sun PZ, Wang E, Cheung JS, et al Simulation and optimization of pulsed radio frequency irradiation scheme for chemical exchange saturation transfer (CEST) MRI—demonstration of pH‐weighted pulsed‐amide proton CEST MRI in an animal model of acute cerebral ischemia. J Magn Reson. 2018; doi:10.1002/mrm.22894
3. Jones KM, Pollard AC, Pagel MD. Clinical Applications of Chemical Exchange Saturation Transfer (CEST) MRI. J Magn Reson. 2018; 47(1): 11-27.
4. Zhou J, Payen JF, Wilson DA, et al. Using the amide proton signals of intracellular proteins and peptides to detect pH effects in MRI. Nat Med. 2003;9:1085-1090.
5. Jones CK, Schlosser MJ, et al. Amide proton transfer imaging of human brain tumors at 3T. Magn Reson Med. 2006;56(3):585-592.
6. Debnath A, Gupta RK, Singh A. Evaluating the Role of Amide-Proton-Transfer Weighted contrast, Optimized for Normalization and Regions of Interest Selection, in Differentiation of Neoplastic and Infective Mass Lesions on 3T MRI. Molecular Imaging and Biology. 2019 May. DOI: 10.1007/s11307-019-01382-x
7. Cai K, Haris M, Singh A, et al. Magnetic resonance imaging of glutamate. Nat Med. 2012;18(2):302-306.
8. Debnath A, Gupta RK, Singh A. To evaluate the role of APT-w contrast, optimized for normalization and ROIs selection, in differentiating Infective and Neo-plastic Mass Lesions. International Society for Magnetic Resonance in Medicine (ISMRM): 27th Annual Meeting & Exhibition-May 2019, Canada, (Proc.Intl.Soc.Mag.Reson. 27 (2019), program number 4347)).
9. Haris M, Singh A, Cai K, et al. A technique for in vivo mapping of myocardial creatine kinase metabolism. Nat Med. 2014;20(2):209-214. doi:10.1038/nm.3436
10. Singh A, Debnath A, Cai K, et al. Evaluating Feasibility of Creatine-weighted CEST MRI in Human Brain at 7T using Z-spectral fitting approach. NMR in Biomedicine. 2019 August. DOI: 10.1002/nbm.4176
11. Neal A, Moffat BA, Stein JM, et al. Glutamate weighted imaging contrast in gliomas with 7 Tesla magnetic resonance imaging. NeuroImage Clin. 2019;22:101694.
12. Pépin J, Francelle L, Carrillo-de Sauvage MA, et al. In vivo imaging of brain glutamate defects in a knock-in mouse model of Huntington’s disease. Neuroimage. 2016;139:53-64.
13. Davis KA, Nanga RPR, Das S, et al. Glutamate imaging (GluCEST) lateralizes epileptic foci in nonlesional temporal lobe epilepsy. Sci Transl Med. 2015;7(309):309ra161.
14. Bagga P, Pickup S, Crescenzi R, et al. In vivo GluCEST MRI: Reproducibility, background contribution and source of glutamate changes in the MPTP model of Parkinson’s disease. Sci Rep. 2018;8(1):1-9. 15. Kim M, Gillen J, Landman BA, Zhou J, et al. Water saturation shift referencing (WASSR) for chemical exchange saturation transfer (CEST) experiments. Magn Reson Med. 2009;61(6):1441-1450.
Figures