3102
In vivo proton exchange rate MRI of stroke patients
Zhenxiong Wang1,2, Mehran Shaghaghi2, Yiran Zhou1, Wenzhen Zhu1, and Kejia Cai2
1Radiology, Tongji Hospital, Tongji Medical College, Huazhong University of Science and Technology, Wuhan, China, 2Departments of Radiology, Department of Bioengineering, and the Center for MR Research, University of Illinois at Chicago, Chicago, IL, USA, Chicago, IL, United States
1Radiology, Tongji Hospital, Tongji Medical College, Huazhong University of Science and Technology, Wuhan, China, 2Departments of Radiology, Department of Bioengineering, and the Center for MR Research, University of Illinois at Chicago, Chicago, IL, USA, Chicago, IL, United States
Synopsis
In this study, we demonstrated that in vivo proton exchange rate MRI based on improved omega plot can serve as a novel and independent MRI contrast for assessing ischemic brain tissues of stroke patients.
Introduction
In vivo proton exchange rate (kex) imaging of human brain based on water direct saturation (DS) removed omega plot has been implemented for healthy subjects. 1, 2 In this study, at the first time, we attempt to perform kex MRI of ischemic stroke patients and to evaluate the potential value of kex imaging for detecting physiopathologic changes of brain tissues due to ischemia.Methods
A total seventeen patients with ischemic stroke (12 men, 5 women, mean age 54 years, age range 32–81 years, duration of stroke onset from 2 to 18 days) were recruited for this study. All MRI examinations were performed on a 3T MRI system (GE Medical Systems, Discovery MR750, Waukesha, WI, USA) with a 32-channel head coil. Several routine MRI protocols included transverse T1 fluid-attenuated inversion recovery (T1-FLAIR), T2 fast spin echo (T2-FSE), T2-FLAIR, and diffusion weighted imaging (DWI) based on spin-echo echo-planar imaging sequence, which were used for localizing the locations of the infarct lesions. Z-spectral data were acquired with a single-shot fast low-angle shot (FLASH) sequence on a transverse section with the largest infarct region referencing to DWI. The parameters were as follows: TR/TE = 3000/22.6 ms, matrix size = 128×128, FOV = 240 mm× 240 mm, slice thickness = 5 mm, NEX = 2, CEST saturation power (B1) = 1.5, 2.5 and 3.5 μT, saturation duration = 1500 , saturation offsets including 0 to ±5 ppm at an increment of 0.25 ppm, ±6, +15.6, and +39.1 ppm as the reference image, a total of 33 saturation offsets, and acquisition time of 3 min 18 s. After B0 correction based on 1.5 μT Z-spectrum, the Z-spectra were fitted as a linear combination of multiple Lorentzian functions and water DS effect was estimated and removed for constructing pixel-wise omega plots, producing proton exchange rate maps of brain. kex between infarct and contralateral normal brain tissues were compared using a two tailed paired Student’s t-test. In addition, kex imaging were also compared to other conventional MRI methods including DWI, chemical exchange saturation transfer (CEST) and magnetization transfer (MT) computed at +3.5 ppm from the water resonance. All raw data processing and analysis were performed using home-built programs developed in MATLAB.Results
Compared with contralateral normal tissues, kex in lesion regions were found to increase significantly (893±52 vs. 739±34 s−1, P < 0.001). A representative kex image for a stroke brain was shown in Figure 1 in which the infarct exhibited apparently higher kex compared to the contralateral tissues. Furthermore, kex maps were also found to be different from conventional contrasts from DWI, CEST and MT MRI. kex MRI typically showed larger lesion areas than DWI in most patients, which was demonstrated in Figure 2. While kex MRI provided us a physical parameter map, CEST contrast map for the definition of stroke lesions was highly dependent on the saturation power B1. On the other hand, MT map could hardly detect stroke lesions at any B1 (Figure 3).Discussion
In the study, kex MRI detected ischemic lesions with elevated signal over the contralateral brain tissues. As we know, kex may be contributed mainly by pH, temperature, or reactive oxygen species (ROS). 3 Given that tissue acidosis induced pH reduction in stroke can only lead to reduced kex and brain temperature is generally well controlled and stable, we hypothesize that the increased kex is predominately due to the elevated ROS production. The increase of metabolites with fast exchanging protons may also increase the observed tissue kex. However, this is not the case in stroke. Furthermore, our results indicated that kex presents different characterization and definition of stroke than conventional DWI, CEST, and MT MRI contrasts.Conclusion
As a novel, independent, and noninvasive molecular MRI technique, kex MRI at 3T may serve as a potential surrogate biomarker to reflect the metabolic changes, better understand the evolution, and facilitate the treatment of ischemic stroke.Acknowledgements
This work was supported by grants from the National Natural Science Foundation of China (No. 81570462, No. 81730049 and No. 81801666), the NIH grants R21EB023516, R01AG061114, and R21AG053876.References
1. Shaghaghi M, Chen W, Scotti A, et al. In vivo quantification of proton exchange rate in healthy human brains with omega plot. Quant Imaging Med Surg. 2019. doi: 10.21037/qims.2019.08.06
2. Dixon WT, Ren J, Lubag AJ, et al. A concentration-independent method to measure exchange rates in PARACEST agents. Magn Reson Med. 2010;63(3):625-632.
3. Tain RW, Scotti AM, Cai K. Improving the detection specificity of endogenous MRI for reactive oxygen species (ROS). J Magn Reson Imaging. 2019;50(2):583-591.
Figures

Figure 1. kex map from a representative patient with large
infarct. A) DWI exhibited a large infarct in the left occipital lobe. B) kex map also clearly showed the lesion with elevated
value. The bar plots showed that kex of lesions was significantly increased
compared with that of the contralateral tissues.
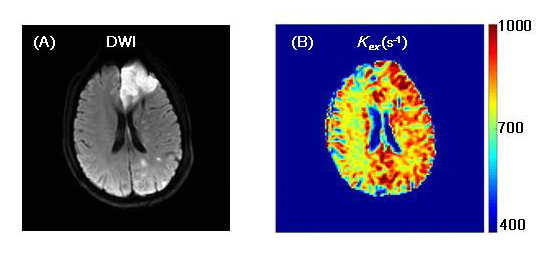
Figure 2. A representative case showing kex map defined
larger lesion area than DWI. A) DWI exhibited a massive infarct in the left
frontal lobe and scattered small infarct in the left occipital lobe. B) kex map
reported increased values in the whole left hemisphere.
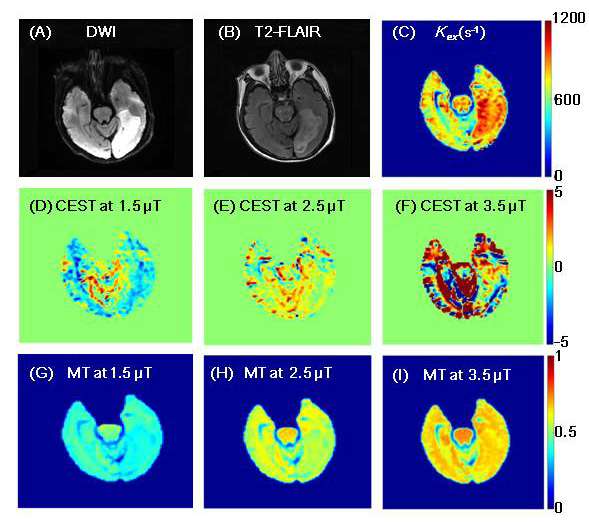
Figure 3. The comparison among kex, CEST and MT maps with different B1
from a representative patient. A-C) DWI, T2-FLAIR and kex maps
clearly showed the location and extent of the infarct. D-F) CEST contrast was
highly variable with B1. G-I) MT could hardly detect stroke lesions
from surrounding healthy tissues at any B1.