3101
Deep learning-based B0 inhomogeneities mapping using sparse CEST spectral data1Department of Electrical and Computer Engineering, Temple University, PHILADELPHIA, PA, United States, 2Russell H. Morgan Department of Radiology and Radiological Science, Johns Hopkins University School of Medicine, Baltimore, MD, United States, 3Department of Diagnostic Radiology and Nuclear Medicine, University of Maryland School of Medicine, Baltimore, MD, United States
Synopsis
Chemical Exchange Saturation Transfer (CEST) is an MR based imaging method that can image compounds containing protons exhibiting a suitable exchange rate with bulk water. One of the crucial technical hurdles in CEST MRI is, as CEST signal highly depends on the saturation frequency, how to accurately correct the B0 inhomogeneity in each voxel. We proposed two deep learning (DL) based methods for estimating B0 inhomogeneities to accelerate CEST imaging using spare samples. While only a small sample size was used, our study shows the potential of DL-based B0 mapping, which can greatly reduce the total CEST acquisition time.
Introduction
Chemical Exchange Saturation Transfer (CEST) MRI has emerged as a novel technology for precise diagnosis of various diseases by either endogenous molecules such as mobile proteins1 and glutamate2, or exogenous administered contrast agents such as glucose and its derivatives3-5. One of the crucial technical hurdles in CEST MRI is, as CEST signal highly depends on the saturation frequency, how to accurately correct the B0 inhomogeneity in each voxel. While B0 inhomogeneity maps can be measured using phase mapping6 or Water Saturation Shift Referencing (WASSR)7, these methods require extra acquisition time and co-registration steps to match the acquired B0 maps with CEST images. In the present study, we hypothesized that sparely sampled Z-spectral images indeed can be used to estimate B0 inhomogeneity maps by the means of deep learning (DL), which will eliminate the needs for additional data acquisition and processing and hence is more efficient.Methods
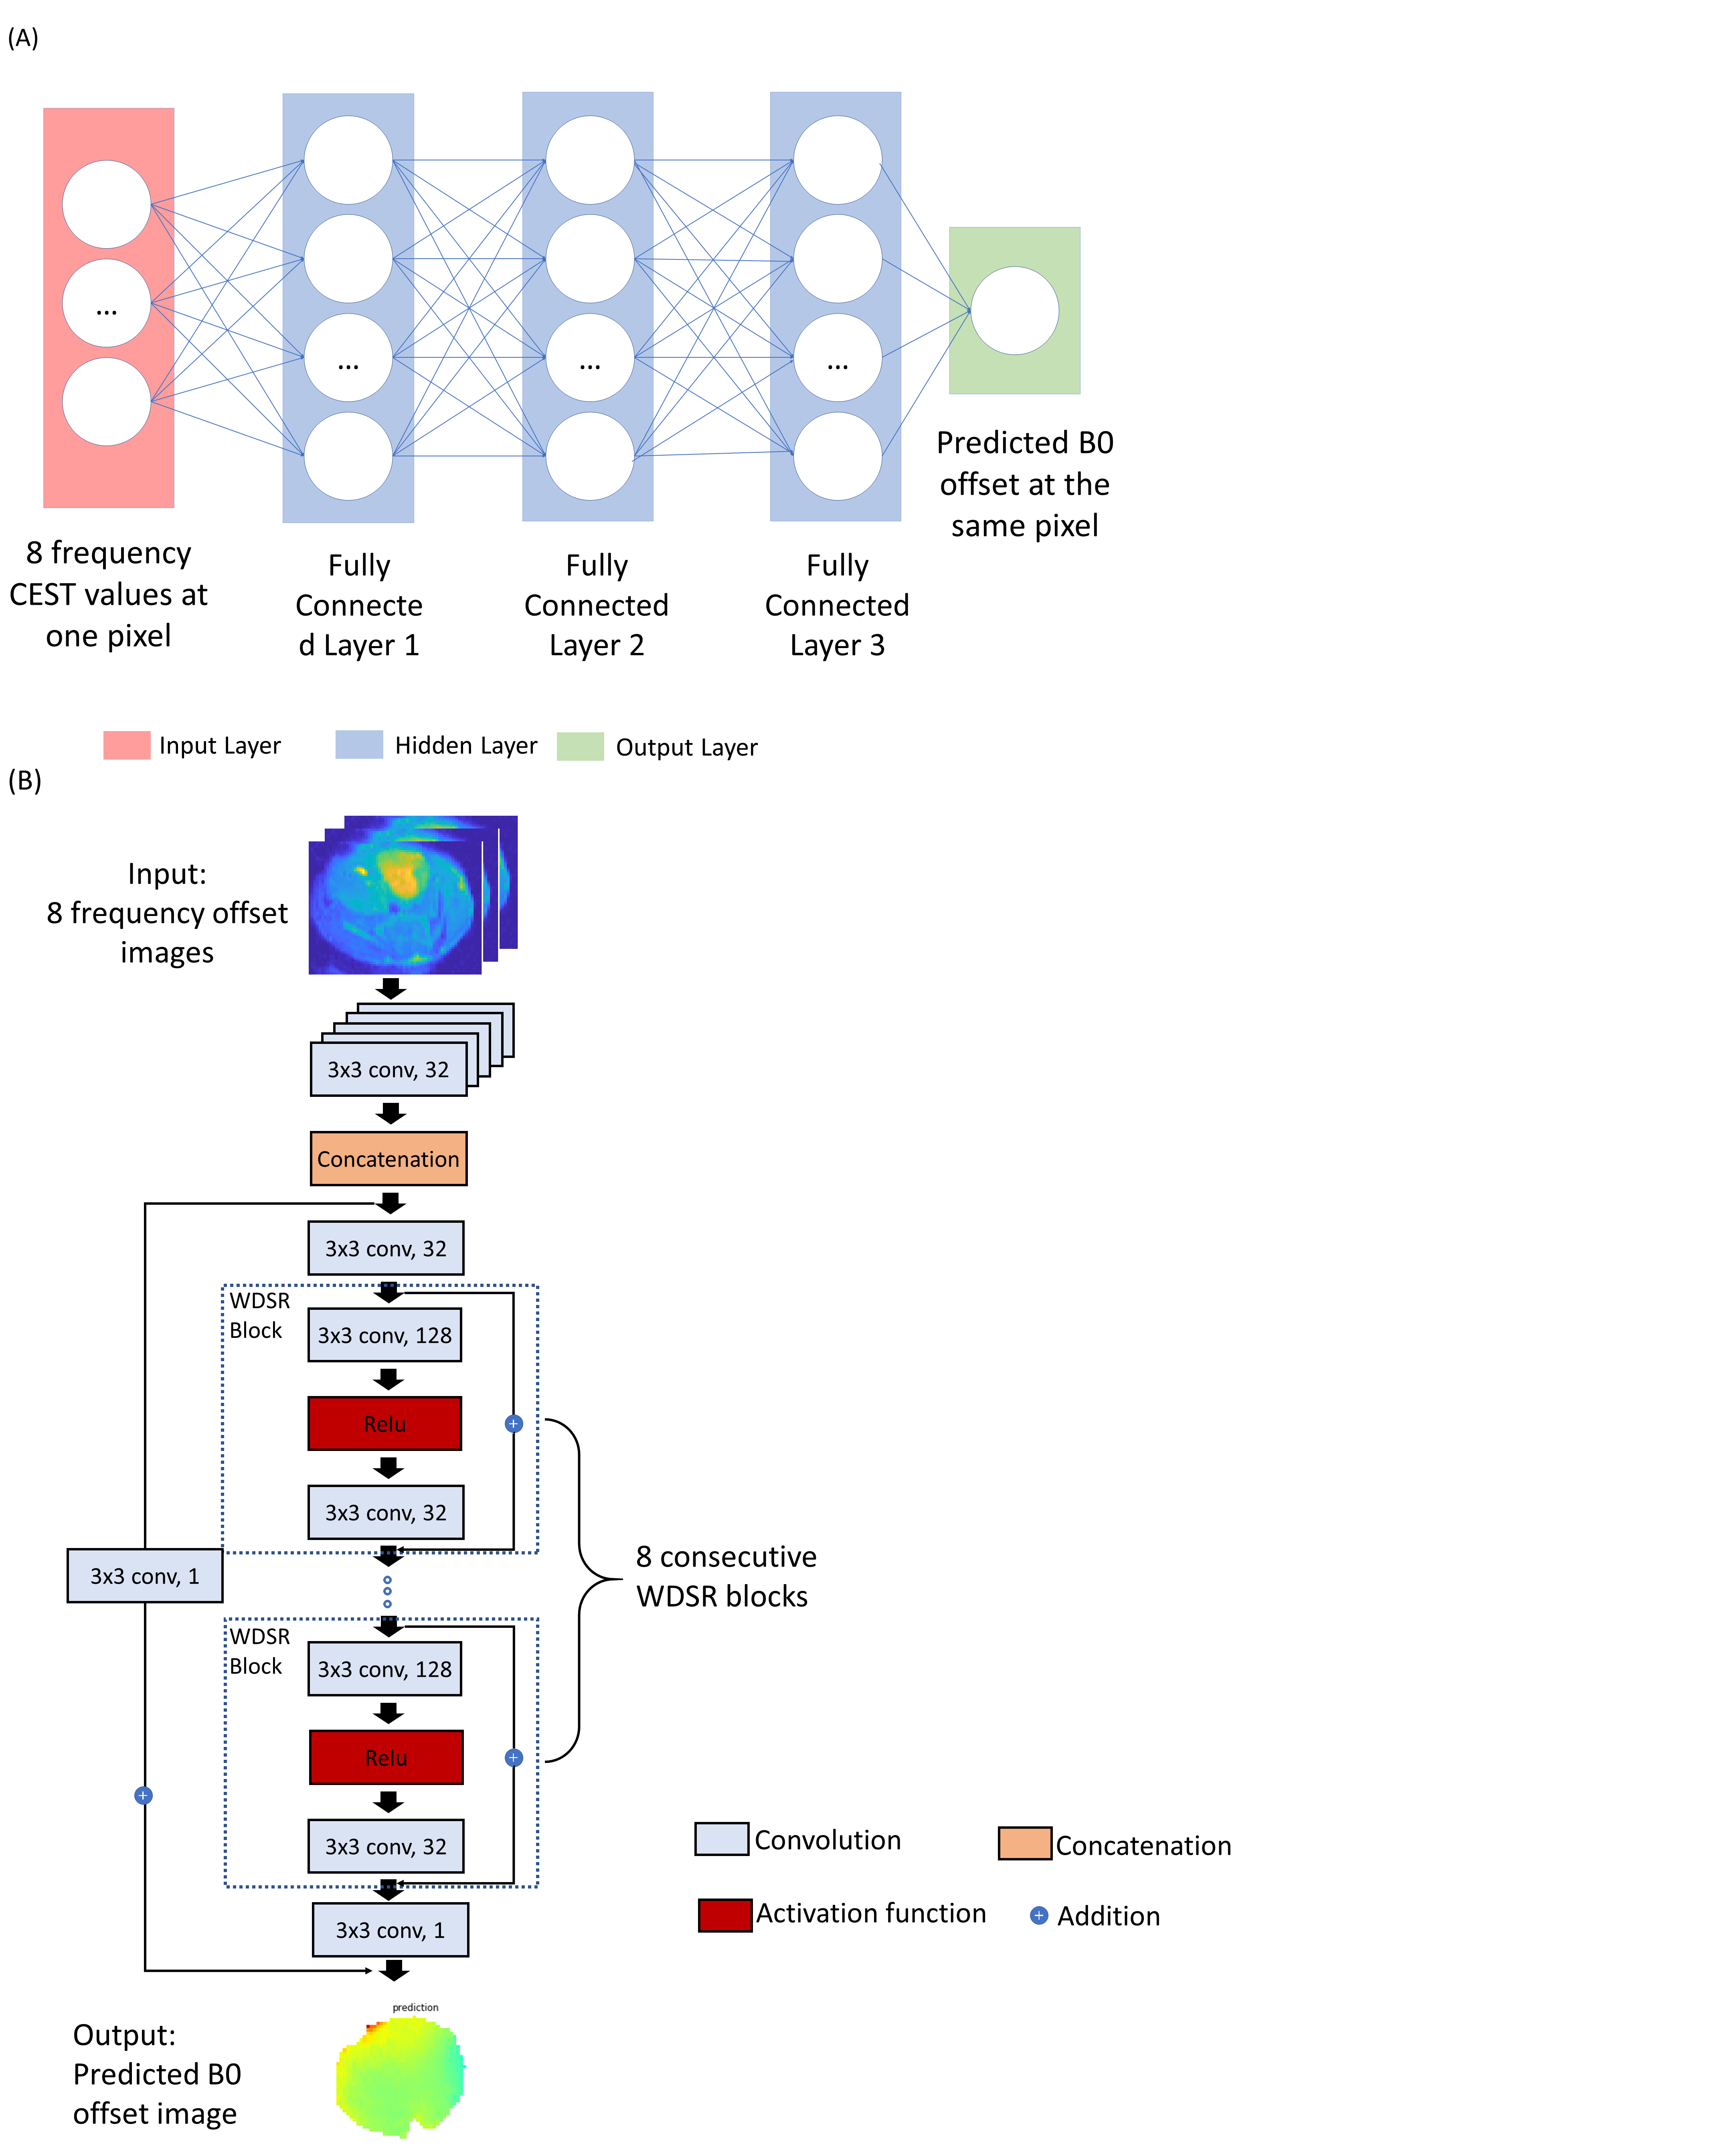
In vivo MR studies were carried out on a Biospec11.7 T horizontal MRI scanner equipped with a 23 mm mouse brain volume coil. MR images were acquired dynamically after i.v. injection of dextran1 (2 g/kg) in C57BL6 mice (female, 5-6 weeks, n=5) bearing GL261 orthotopic brain tumors at 21 days after stereotactically injecting 2x10⁴ GL261 cells at a depth of 3 mm below the dura. Two sets of steady-state Z-spectral CEST MR images (±3 ppm, step=0.2 ppm, total 31 offsets) were acquired before and after the injection of dextran1 using a modified fat-suppressed RARE sequence (CW saturation pulse, B1=1.8 µT and 3 seconds, TR/TE=5000/5 ms, RARE factor=23, total acquisition time=7 min 45 sec). Pre and post-injection B0 inhomogeneities were also measured using the WASSR method7 using the same RARE sequence (CW pulse , B1=0.5 µT and 500 ms, ±1 ppm, step=0.1 ppm, TR/TE=1500/5 ms, RARE factor=23, total acquisition time=1 min 35 sec). Total of 8 sets of CEST images from 4 mice were used as training data and 4 sets of CEST images from 2 mice were used as testing data. All images were first masked to remove background voxels prior to DL.As shown in Fig.1, Both voxel- and patch-based deep neural networks were investigated using data sets that were nonlinearly transformed from CEST-weighted images at 8 selected offsets (±100, ±200, ±300, -400, and -500Hz). The voxel-based model is based on fully connected deep neuro networks contains 3 hidden layers with 100 filters. For each voxel, the CEST image intensity of at the 8 offset frequencies was used as the input of neural network, and B0 offset is the output. The image patch-based model is composed of a deep residual network armed with wide activation layers. The backbone of the network is the vanilla residual network8 except the residual blocks were replaced by Wide-activation Deep Super-Resolution (WDSR) blocks9. Both methods were retrospectively evaluated using the B0 maps acquired by WASSR. The mean squared error was used as the lost function for both networks and adaptive moment estimation (ADAM) was used as the optimizer10.
Results and Discussion
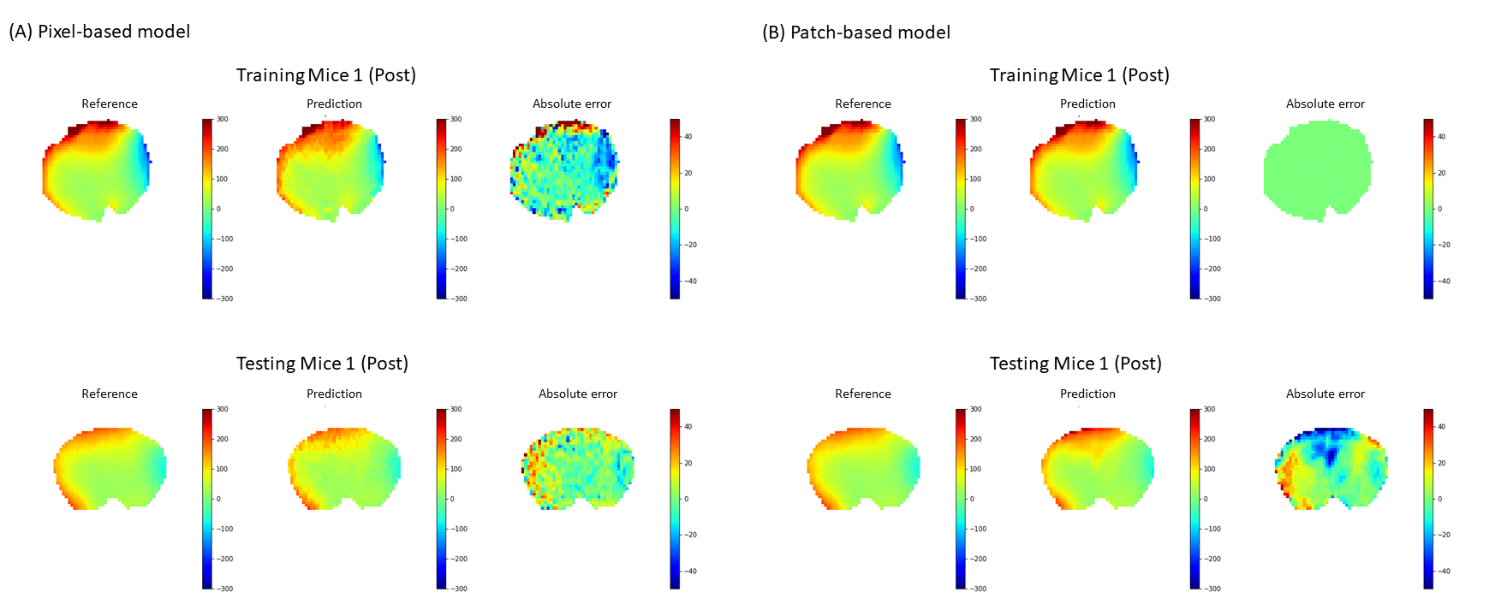
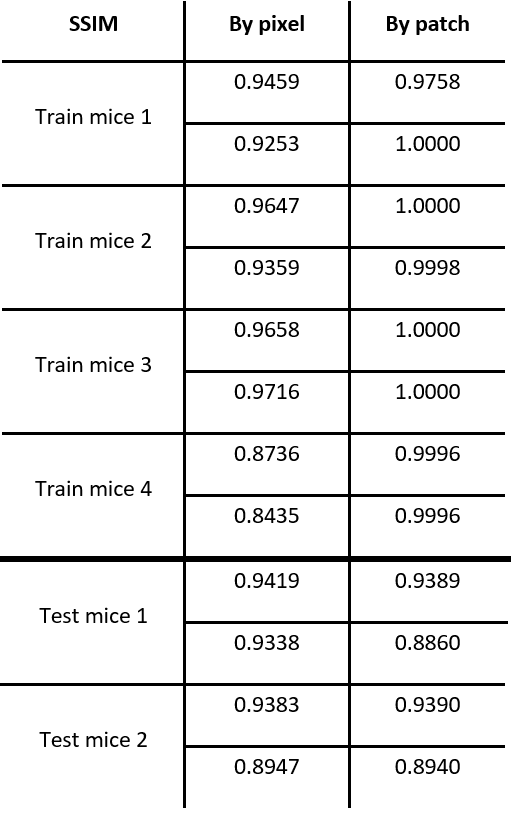
Fig.2(A)(B) shows representative training and testing results of the voxel- and patch-based model respectively. “Reference” was the results obtained by WASSR. “Prediction” shows the B0 offset maps estimated by the voxel- and patch-based models. “Absolute error” is the difference between the reference and the DL methods. Both methods produced B0 offset maps quite similar to the reference. Compared to the voxel-based method, the patch-based model resulted in more spatially constrained errors. Quantitatively, the voxel-based method showed slightly better performance than the patch-based one regarding the B0 map prediction errors and the structural similarity as shown in Table 1 and 2. This difference may be attributed to the small sample size. Even based on the same training data, the training sample size for the voxel-based method is much bigger than that for the patch-wise DL model simply because each voxel becomes a training sample. Moreover, the patch-based method has more parameters to be trained, which theoretically require more training samples. Since the patch-based method explicitly uses spatial correlation among the neighboring voxels, it can increase SNR of the output B0 map if more training samples will be available to refine the model. Nevertheless, the results from the two different DL models proved the effectiveness of DL for B0 map estimation.Because our DL B0 mapping methods used spare samples, it can greatly accelerate CEST imaging. In this demonstration, the full Z-spectral acquisition took almost 8 min and the WASSR acquisition took ~ 1.5 min. Considering only 8 offsets are needed for DL, the total acquisition time is only ~ 2 min. Of course, one also needs to acquire CEST images at the offsets of interest (e.g.,1 ppm for dextran or glucose), making the total acquisition time 2-3 min. Hence, with our current settings, one can easily save up to 80% of the total acquisition time.
Conclusion
We demonstrated the use of two DL based methods for estimating B0 inhomogeneities to accelerate CEST imaging using spare samples. While only a small sample size was used, our study shows the potential of DL-based B0 mapping, which can greatly reduce the total CEST acquisition time.Acknowledgements
This project was supported by the National Institute of Biomedical Imaging and Bioengineering of the National Institute of Health under award number p41EB015893 and the National Institute of Drug Abuse of the National Institutes of Health under award number R01DA037289, and by NIH/HIA R01AG060054-01 and by NIH R01CA211087.References
1. Zhou J, Payen JF, Wilson DA, Traystman RJ, van Zijl PC. Using the amide proton signals of intracellular proteins and peptides to detect pH effects in MRI. Nature medicine. 2003 Aug;9(8):1085.
2. Han Z, Liu G. Sugar‐based biopolymers as novel imaging agents for molecular magnetic resonance imaging. Wiley Interdisciplinary Reviews: Nanomedicine and Nanobiotechnology. 2019 Jul;11(4):e1551.
3. Xu X, Chan KW, Knutsson L, Artemov D, Xu J, Liu G, Kato Y, Lal B, Laterra J, McMahon MT, Van Zijl PC. Dynamic glucose enhanced (DGE) MRI for combined imaging of blood–brain barrier break down and increased blood volume in brain cancer. Magnetic resonance in medicine. 2015 Dec;74(6):1556-63.
4. Chan KW, McMahon MT, Kato Y, Liu G, Bulte JW, Bhujwalla ZM, Artemov D, van Zijl PC. Natural D‐glucose as a biodegradable MRI contrast agent for detecting cancer. Magnetic resonance in medicine. 2012 Dec;68(6):1764-73.
5. Walker-Samuel S, Ramasawmy R, Torrealdea F, Rega M, Rajkumar V, Johnson SP, Richardson S, Gonçalves M, Parkes HG, Årstad E, Thomas DL. In vivo imaging of glucose uptake and metabolism in tumors. Nature medicine. 2013 Aug;19(8):1067.
6. Sun PZ, Farrar CT, Sorensen AG. Correction for artifacts induced by B0 and B1 field inhomogeneities in pH‐sensitive chemical exchange saturation transfer (CEST) imaging. Magnetic Resonance in Medicine: An Official Journal of the International Society for Magnetic Resonance in Medicine. 2007 Dec;58(6):1207-15.
7. Kim M, Gillen J, Landman BA, Zhou J, Van Zijl PC. Water saturation shift referencing (WASSR) for chemical exchange saturation transfer (CEST) experiments. Magnetic Resonance in Medicine: An Official Journal of the International Society for Magnetic Resonance in Medicine. 2009 Jun;61(6):1441-50.
8. He K, Zhang X, Ren S, Sun J. Deep residual learning for image recognition. InProceedings of the IEEE conference on computer vision and pattern recognition 2016 (pp. 770-778).
9. Yu J, Fan Y, Yang J, Xu N, Wang Z, Wang X, Huang T. Wide activation for efficient and accurate image super-resolution. arXiv preprint arXiv:1808.08718. 2018 Aug 27.
10. Kingma, Diederik P., and Jimmy Ba. "Adam: A method for stochastic optimization." arXiv preprint arXiv:1412.6980 (2014).
Figures