3100
Deep Learning Reconstruction improves CEST MRI
Shu Zhang1, Xinzeng Wang2, F. William Schuler1, R. Marc Lebel3, Mitsuharu Miyoshi4, Ersin Bayram2, Elena Vinogradov5, Jason M. Johnson6, Jingfei Ma7, and Mark D. Pagel1
1Cancer Systems Imaging, The University of Texas MD Anderson Cancer Center, Houston, TX, United States, 2Global MR Applications & Workflow, GE Healthcare, Houston, TX, United States, 3Global MR Applications & Workflow, GE Healthcare, Calgary, AB, Canada, 4Global MR Applications & Workflow, GE Healthcare Japan, Tokyo, Japan, 5Radiology, UT Southwestern Medical Center, Dallas, TX, United States, 6Neuroradiology, The University of Texas MD Anderson Cancer Center, Houston, TX, United States, 7Imaging Physics, The University of Texas MD Anderson Cancer Center, Houston, TX, United States
1Cancer Systems Imaging, The University of Texas MD Anderson Cancer Center, Houston, TX, United States, 2Global MR Applications & Workflow, GE Healthcare, Houston, TX, United States, 3Global MR Applications & Workflow, GE Healthcare, Calgary, AB, Canada, 4Global MR Applications & Workflow, GE Healthcare Japan, Tokyo, Japan, 5Radiology, UT Southwestern Medical Center, Dallas, TX, United States, 6Neuroradiology, The University of Texas MD Anderson Cancer Center, Houston, TX, United States, 7Imaging Physics, The University of Texas MD Anderson Cancer Center, Houston, TX, United States
Synopsis
Image reconstruction using deep learning (DL Recon) is capable of enhancing image signal-to-noise ratio (SNR) without losing image resolution or altering the image contrast. Our study demonstrates that CEST imaging and quantification, which are often limited by SNR and long scan time, can be improved with DL Recon. Our results clearly indicated that DL Recon can be used for CEST imaging with higher spatial resolution without or with only a mild increase in scan time or for CEST imaging in reduced scan time by using parallel imaging without the typical SNR penalty.
Introduction
CEST imaging is currently limited by low SNR and long scan time.1 Image reconstruction using deep learning (DL Recon) is capable of enhancing image signal-to-noise ratio (SNR) without losing image resolution or altering the image contrast. However, the influences of the deep learning based denoising methods were not well evaluated in quantitative imaging, especially CEST MRI. The objective of this study was to investigate if the enhanced SNR from DL Recon can help CEST imaging with higher spatial resolution without increasing scan time and if DL Recon enables CEST imaging with parallel imaging without its typical loss of SNR.Methods
A spherical phantom (QalibreMD, Inc.) was used to hold five vials of gelatin (Verisol B, Gelita, Inc.) with different pH values of 6.0, 6.5, 7.0, 7.5 and 8.0, along with vials of distilled water and vegetable oil. The phantom was scanned on a 3T GE whole body scanner (Discovery MR750) using an 8-channel head coil at room temperature. The CEST images were acquired using a single-shot fast spin echo (SSFSE) sequence with fat saturation.2 A saturation power of 2.0 μT and a saturation time of 2000 ms were used. 29 saturation frequencies from -7 ppm to 7 ppm in equal steps were acquired to obtain Z-spectra. A reference image was acquired without CEST saturation. WASSR was used for field inhomogeneity correction.3 Six sets of CEST images were acquired using a matrix size of 64, 128, 256, 384, 512 without parallel imaging (ASSET) and 512 with ASSET = 2. The TR was set to minimum to shorter scan time. It had a range from 2338.8 to 8607.7 ms. TE was set to minimum too, with a range from 27.0 to 35.8 ms. The FOV = 220 mm × 220 mm and slice thickness = 2 mm for all phantom scans. Three glioma patients were also enrolled and imaged using the same sequence as for the phantoms except with a matrix size of 256 and a slice thickness of 5 mm. All patient scans were approved by the institutional IRB and with written informed consents. MTRasym at 3.5 ppm was measured for CEST analysis.In addition to the standard recon, a vendor supplied DL Recon was used to reconstruct images using the same CEST raw data. The network was based on a deep convolutional residual encoder network pre-trained to reduce image noise without a loss in spatial resolution.
Results
Figure 1 compared low resolution CEST images with and without DL Recon. DL Recon was noted to be crispier and reduced the Gibbs ringing artifact (Fig. 1a vs. 1d). Because of the high SNR at the low resolution, CEST signals and local variations appeared to be similar with and without DL Recon (Fig. 1). With lower SNR at high resolution, DL Recon denoised the images (Fig. 2a vs. 2d) and generated a MTRasym map that had lower noise (Fig. 2b,c vs. e,f). Due to its high SNR, the DL Recon Z-spectra and MTRasym at a pixel-level were smoother and had a quality comparable to the ROI averaged Z-spectra and MTRasym using standard recon (Fig. 2g, h). The MTRasym maps relative to the matrix size were compared using standard recon and DL recon (Fig. 3a vs. 3b). As expected, the MTRasym maps from standard recon became nosier as matrix size increased and with ASSET (Fig. 3a). DL Recon compensated the SNR loss, and the corresponding high resolution MTRasym maps from DL Recon images were smoother (Fig. 3b). While the standard deviation increased with spatial resolution for standard recon, it remained relatively unchanged for all resolutions for DL recon (Fig. 4). The MTRasym was noted to increase with matrix size (Fig. 4), possibly due to an increased TR that allowed more magnetization recovery from saturation. Due to the same effect, the MTRasym decreased when ASSET was used because TR was halved with ASSET (Fig. 4 512 vs. 512 with ASSET). For the in vivo images, the MTRasym map was noted to be substantially less noisy with DL Recon (Fig. 5).Discussion and conclusion
Our study demonstrated that DL Recon was applicable to CEST imaging which is currently limited by SNR and long scan time. With the SNR gain, DL Recon enabled higher resolution CEST imaging without the increase in scan time, which can potentially improve voxel-wise analyses or assessments of small ROIs. DL Recon also enabled CEST imaging with parallel imaging without its typical SNR loss, which can largely shorten the scan time. In this study, the images were acquired using FSE sequences, which had higher SNR compared with gradient echo sequences. Thus, the noise could be more of a problem in gradient echo based sequences, in which case DL Recon can be very beneficial. These benefits are expected to improve the CEST quantitation and its performance in clinical applications.Acknowledgements
This work was supported in part by the Odyssey Program and Cockrell Foundation Award for Scientific Achievement at The University of Texas MD Anderson Cancer Center (S.Z.).References
- Zhou J, Blakeley JO, Hua J, et al. Practical data acquisition method for human brain tumor amide proton transfer (APT) imaging. Magn Reson Med. 2008; 60(4): 842-849.
- Miyoshi M, Matsuda T, Kabasawa H. CEST imaging with phase cycled rectangular RF preparation pulse: analytical solution, simulation and phantom study. Proceedings of ISMRM 2014, 3299.
- Kim M, Gillen J, Landman BA, et al. Water saturation shift referencing (WASSR) for chemical exchange saturation transfer (CEST) experiments. Magn Reson Med. 2009; 61(6): 1441-1450.
Figures
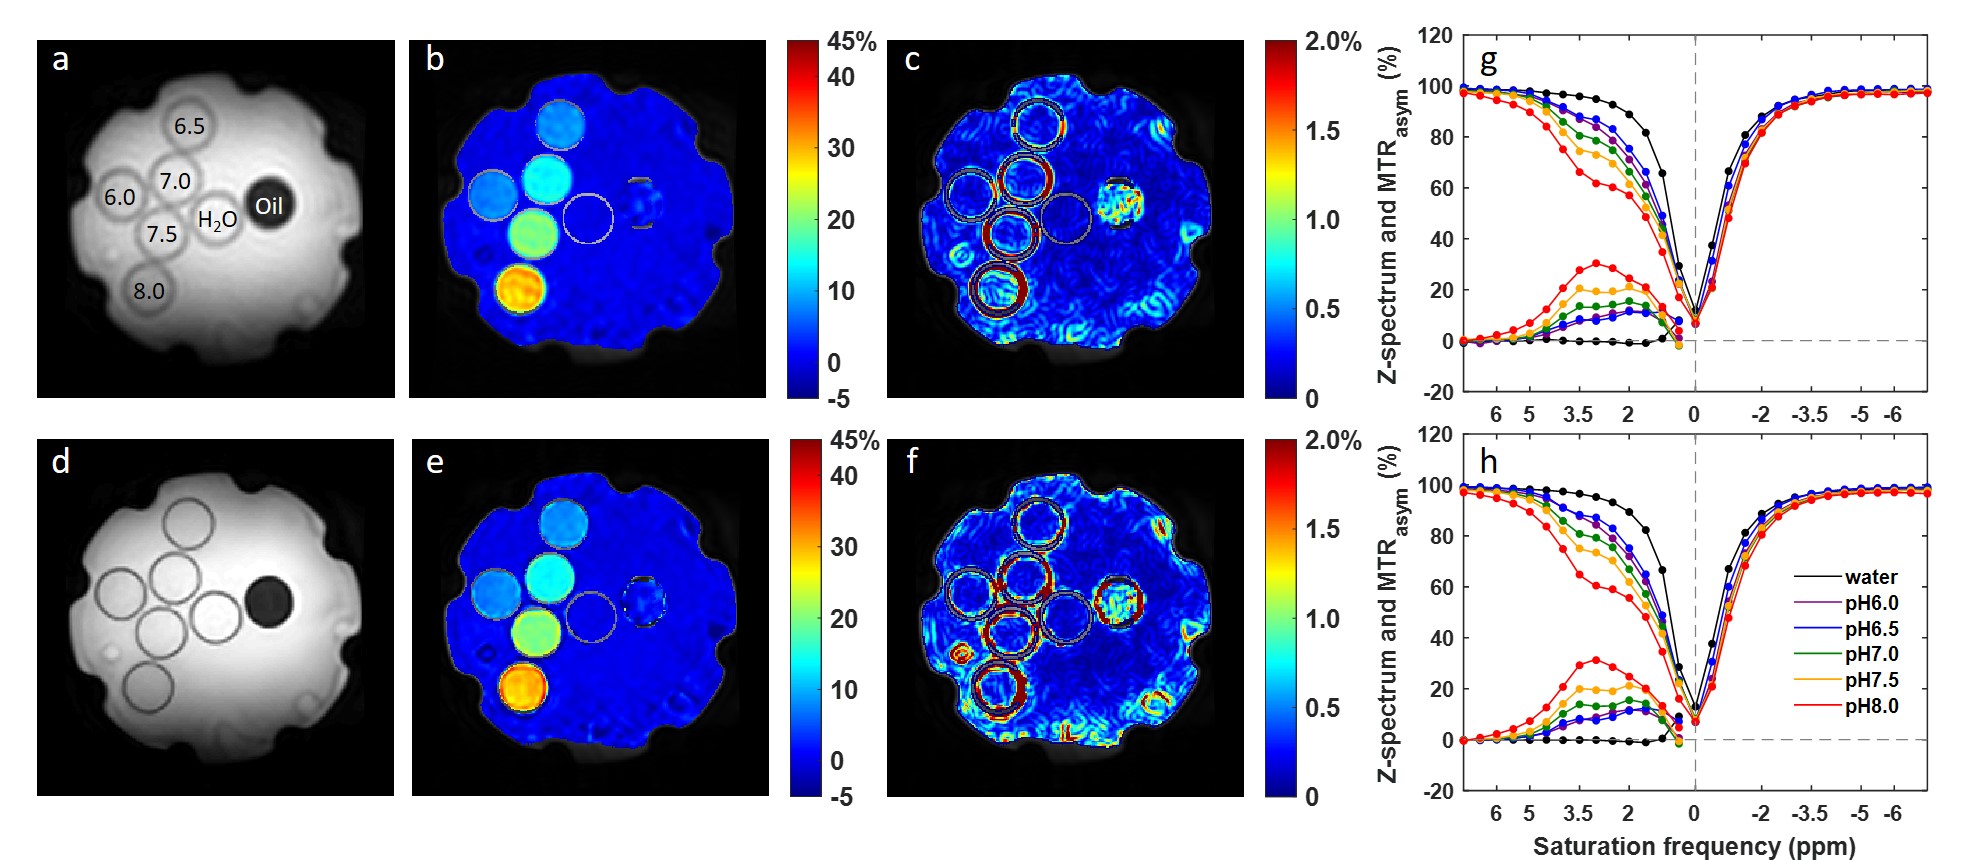
Figure
1. Reference images (a,d), MTRasym maps at 3.5 ppm (b,e) and local
standard deviation maps (c,f) for original CEST images (a-c) and CEST images
with DL Recon (d-f). The CEST images were acquired using a matrix size of 64
without ASSET. Z-spectrum and MTRasym of single pixels (g) and
averaged in ROIs (h) were compared between original (dots) and with DL recon (lines).
The gelatin protein vials were labeled with their pH values in (a). The water
and oil vials were also labeled in (a).
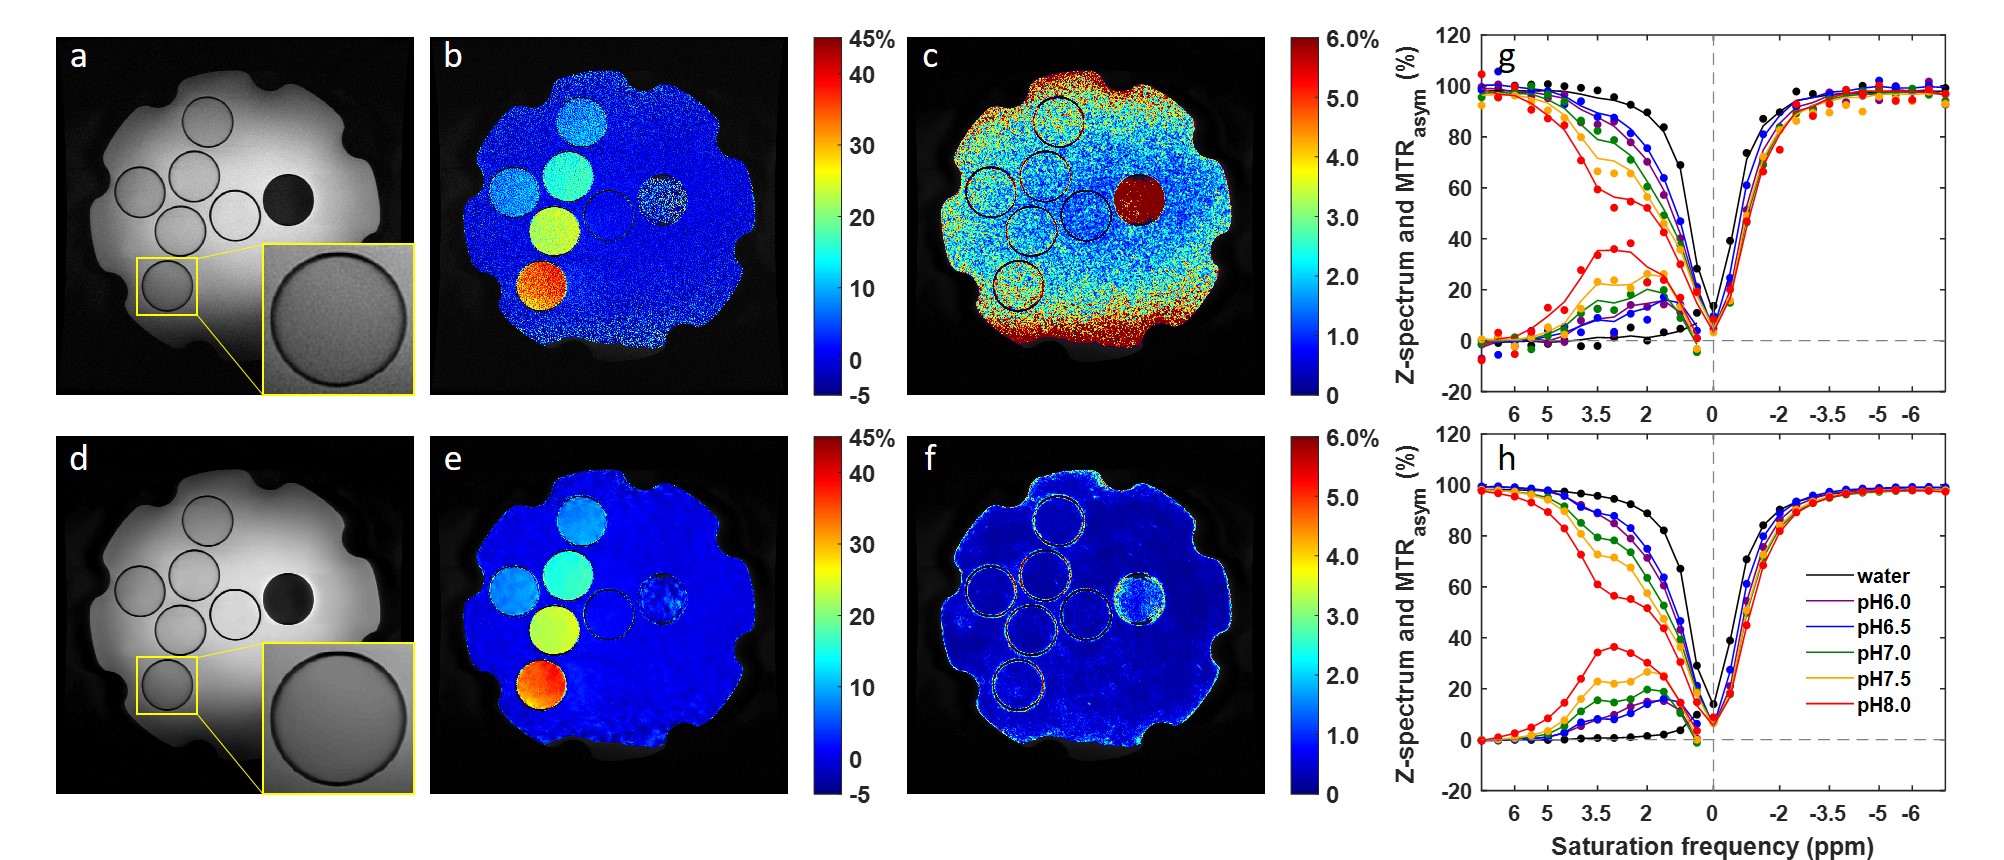
Figure 2. Reference images (a,d), MTRasym maps at
3.5 ppm (b,e) and local standard deviation maps (c,f) for original CEST images
(a-c) and CEST images with DL Recon (d-f). The insets in (a) and (d) showed a
zoom in of the reference images for better comparison. The CEST images were
acquired using a matrix size of 512 without ASSET. Z-spectrum and MTRasym
of single pixels (g) and averaged in ROIs (h) were compared between original
(dots) and with DL recon (lines).
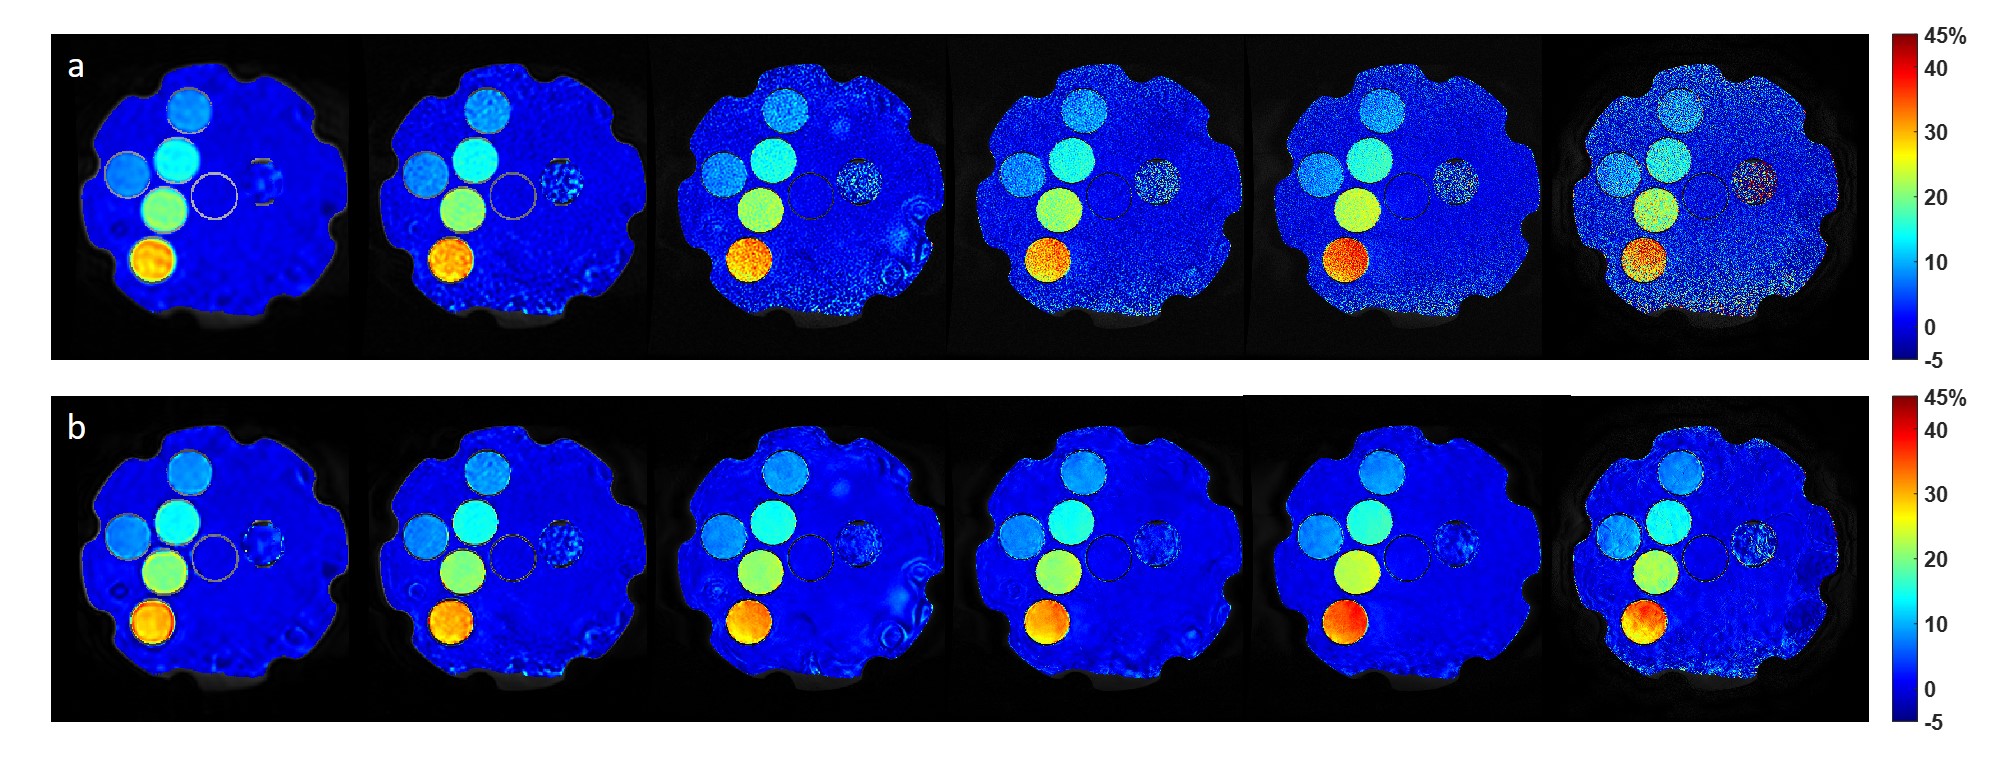
Figure
3. MTRasym maps at 3.5 ppm calculated from original CEST images (a)
and CEST images with DL Recon (b). The images were acquired with a matrix size
of 64, 128, 256, 384, 512 without ASSET and 512 with ASSET from left to right.

Figure
4. ROI mean and standard deviation of the MTRasym at 3.5 ppm against
acquisition matrix size for gelatin at pH 7.5.
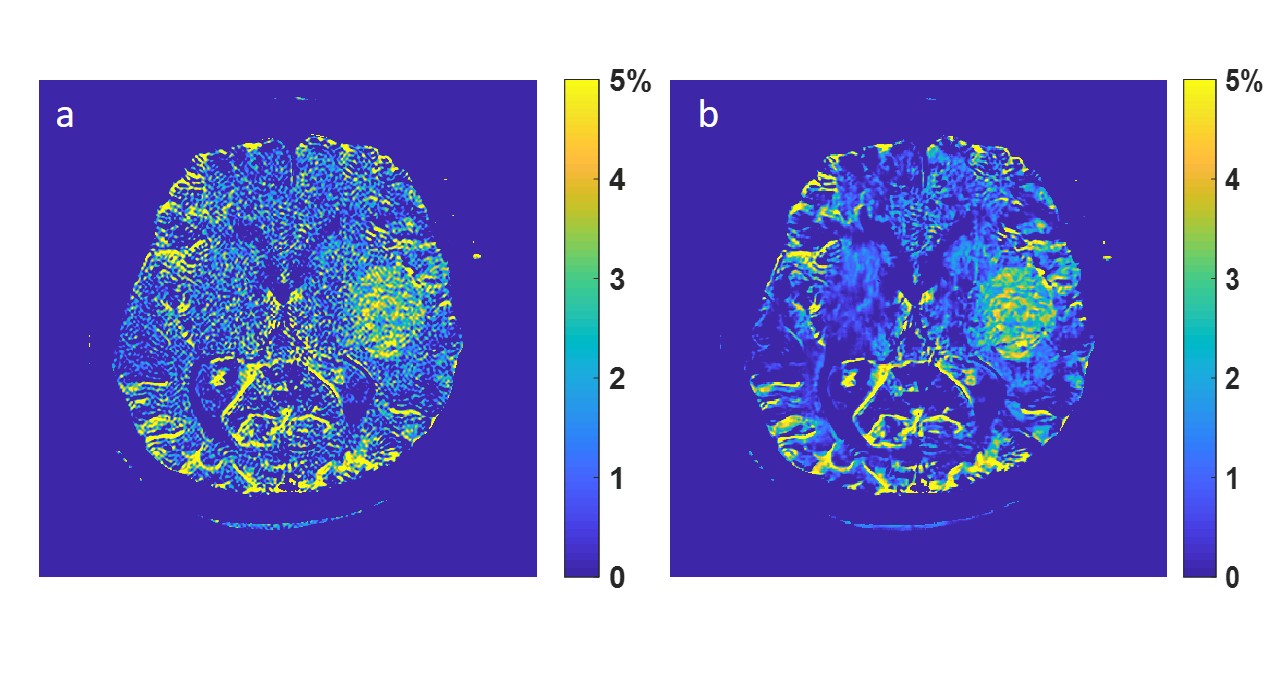
Figure
5. MTRasym at 3.5 ppm using standard recon (a) and DL recon (b).