3099
Two-stage denoising of CEST MRI data by principal component analysis of spectral groups1German Cancer Research Center (DKFZ), Heidelberg, Germany
Synopsis
In this study a novel method for the denoising of CEST MRI data is presented, combining the formation of subsets of similar spectra and the subsequent application of a principal component analysis. Exploiting only the subtle spectral differences of these reduced datasets – as opposed to using all spectra for the analysis – allows for a better identification and isolation of the obscured underlying spectral features. The proposed denoising resulted in an SNR gain by approximately a factor of four compared to the noisy initial data and an additional 14% compared to the conventional principal component analysis denoising.
Introduction
Recently, we developed an adaptive denoising algorithm for CEST spectra, combining the identification of spectral redundancies by means of a principal component analysis (PCA) with an appropriate data-driven truncation criterion to separate the relevant spectral features from noise-like characteristics.1 However, an even better denoising performance for CEST data is desirable, for example, to generate high-SNR ground truths for the reliable training of neural networks. In this study a novel method is presented, extending the previous approach by a second stage of denoising2,3 (Step 3 in methods section). To this end, the result of the previously established denoising approach is used to define for each spectrum the subset of its most similar spectra. Subsequent application of a PCA to these reduced datasets – exhibiting only subtle spectral differences – allows for a better identification and isolation of the obscured underlying spectral features.Methods
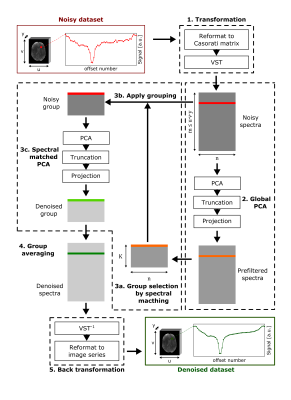
The proposed denoising algorithm comprises the following steps (Fig. 1):Step 1: The acquired CEST data of size $$${u}\times{v}\times{y}\times{n}$$$ (one 3D image for each of the $$$n$$$ saturation frequency offsets) is reformatted into a Casorati matrix of size $$${m}\times{n}$$$ (with $$$m\leq{u}\cdot{v}\cdot{y}$$$ being the number of remaining voxels after skull stripping). Subsequently, a variance-stabilizing transformation (VST) is applied to the matrix to correct for the Rician noise induced bias.4
Step 2: In the first denoising stage, all noisy spectra are denoised using the previously established adaptive PCA, whereby the optimal truncation is determined by the Nelson criterion.1,5
Step 3: In the newly introduced second denoising stage, each resulting prefiltered spectrum is used to define the group of its $$$K$$$ (in this study set to $$$10\cdot{n}$$$) most similar spectra (Step 3a),3 whereby the similarity between two spectra $$$\mathbf{s_i}$$$ and $$$\mathbf{s_j}$$$ is determined by the cosine similarity:
$$\textrm{sim}(\mathbf{s_i},\mathbf{s_j})=\frac{\mathbf{s_i}\cdot\mathbf{s_j}}{||\mathbf{s_i}||\cdot||\mathbf{s_j}||}$$
The corresponding groups of noisy spectra are each denoised individually using again the adaptive PCA (Step 3b and c). As a result, each group yields an estimate for all included spectra.
Step 4: The final denoised spectra are calculated by averaging the corresponding estimates from all groups.
Step 5: Application of the inverse VST and reformatting to an image series yields the denoised dataset.
In vivo 3D CEST MRI was performed on a 7T whole-body scanner (Siemens Healthineers, Germany) using the snapshot-CEST approach6 with a matrix size of $$${128}\times{104}\times{12}$$$ and a resolution of $$${1.7}\times{1.7}\times{3}~{mm}^3$$$. Presaturation was obtained by 140 Gaussian-shaped pulses $$$(t_p=15~ms,~{duty}~{cycle}=60\%,~{t_{sat}}=3.5~{s},~\textrm{mean}~{B_1}=0.7\mu{T})$$$ applied at 56 unevenly distributed offsets. Low-SNR data as input for the denoising were acquired with bandwidth $$$(BW)=1560~Hz/pixel$$$ and flip angle $$$(FA)=1^\circ$$$ and high-SNR data with $$$BW=560~Hz/pixel$$$ and $$$FA=4^\circ$$$. All acquired image data were motion corrected using an automatic multimodal rigid registration algorithm in MITK,7 corrected for $$$B_0$$$ inhomogeneities and manually skull stripped. A ground truth was obtained by averaging five high-SNR datasets and application of the first stage (i.e. single-stage) denoising. To obtain a reference for the denoising performance, the conventional single-stage denoising was also applied to the low-SNR data. Image contrasts were calculated by the asymmetric magnetization transfer ratio $$$(MTR_{asym}=(M(-\Delta\omega)-M(\Delta\omega))/M_0)$$$ at $$$\Delta\omega=3.5~ppm$$$.
Results
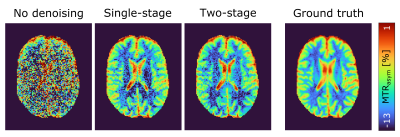
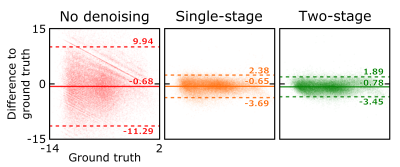
Application of the proposed two-stage denoising algorithm to the low-SNR data results in an image quality comparable with the ground truth (see last paragraph in Methods for definition of the ground truth) and slightly improved compared to using only the conventional denoising approach (Fig. 2). In the corresponding Bland-Altman plots (Fig. 3), this translates into a reduced spread of the limits of agreement – and thereby gain in SNR – by a factor of approximately four compared to the noisy initial data and 14% compared to the single-stage denoising. A small bias of the proposed denoising is observable (i.e. difference of the mean from zero in the Bland-Altman plot), which can however in large parts be assigned to the different BW and FA of the low-SNR data acquisition with respect to the ground truth as it is already present in the noisy data.Discussion
The proposed method extends the previously presented denoising algorithm1 by a second denoising stage allowing, improved image quality. Moreover, the selection and subsequent denoising of similar subsets of spectra reduces the risk of spectral features being undesirably removed or significantly blurred. This is especially important for rare spectral features only present in a small region of the acquisition volume (e.g. in the tumor) containing the important clinical information. However, introduction of the second stage comes at the cost of increased computation time, as the spectral matching and subsequent denoising are repeated for each voxel. In a next step, a thorough investigation on realistic simulations will be necessary to be able to compare the denoising results with an unbiased ground truth, thereby allowing quantification of the SNR gain across multiple noise levels, as well as investigation of the effect of the denoising on rare spectral features.Conclusion
In this study, a novel denoising algorithm for CEST MRI is presented that exploits in a second stage the denoising of spectrally matched groups. The resulting improved image and spectral quality might in the future allow for the development of faster CEST imaging sequences, application of metrics and methods especially prone to noise, and generation of high-SNR ground truths for the reliable training of neural networks.Acknowledgements
JB acknowledges the financial support of the International Max Planck Research School for Quantum Dynamics in Physics, Chemistry and Biology.References
1. Breitling J, Deshmane A, Goerke S, et al. Adaptive Denoising For Chemical Exchange Saturation Transfer MR Imaging. NMR Biomed. 2019;32(11).
2. Zhang X, Peng J, Xu M, et al. Denoise Diffusion-Weighted Images Using Higher-Order Singular Value Decomposition. Neuroimage. 2017;156:128-145.
3. Zhang L, Dong W, Zhang D, Shi G. Two-Stage Image Denoising By Principal Component Analysis With Local Pixel Grouping. Pattern Recognit. 2010;43(4):1531-1549.
4. Foi A. Noise Estimation And Removal In MR Imaging: The Variance-Stabilization Approach. In: 2011 IEEE International Symposium on Biomedical Imaging: From Nano to Macro. IEEE; 2011:1809-1814.
5. Nelson LR. Some Observations On The Scree Test, And On Coefficient Alpha. J Educ Res Meas. 2005;3(1):1-17.
6. Zaiss M, Ehses P, Scheffler K. Snapshot-CEST: Optimizing Spiral-Centric-Reordered Gradient Echo Acquisition For Fast And Robust 3D CEST MRI At 9.4 T. NMR Biomed. 2018;31(4):e3879.
7. Floca R. Matchpoint: On Bridging The Innovation Gap Between Algorithmic Research And Clinical Use In Image Registration. In: IFMBE Proceedings. Vol 25. Springer, Berlin, Heidelberg; 2009:1105-1108.
Figures


