3098
AutoCEST: a Machine-Learning Approach for Optimal CEST-MRI Experiment Design and Quantitative Mapping1Athinoula A. Martinos Center for Biomedical Imaging, Massachusetts General Hospital and Harvard Medical School, Charlestown, MA, United States, 2Department of Physics, Harvard University, Cambridge, MA, United States, 3Magnetic Resonance Center, Max Planck Institute for Biological Cybernetics, Tübingen, Germany, 4Department of Neuroradiology, University Clinic Erlangen, Erlangen, Germany
Synopsis
The most common metric for CEST analysis is the magnetization-transfer-ratio asymmetry. Although qualitatively useful, it is affected by a mixed contribution from several exchange properties and requires experiment-specific protocol optimization. Herein, we propose a machine-learning framework for simultaneously tackling two challenging tasks: (1) automatic design of the optimal CEST acquisition schedule; (2) automatic extraction of fully quantitative CEST maps from the acquired data. The method was evaluated in simulations and phantoms at 4.7T. The resulting data acquisition and reconstruction times were 52 s and 36 ms respectively, providing quantitative exchange-rate and volume fraction maps with good agreement to ground-truth.
Introduction
Chemical exchange saturation transfer (CEST) is a promising and increasingly explored contrast mechanism for molecular MRI.1 Although various CEST acquisition and data analysis methods were previously developed, the predominant experimental protocol remains a full z-spectrum acquisition followed by the magnetization-transfer-ratio asymmetry (MTRasym) analysis.2 Despite the demonstrated capability of this approach in detecting changes caused by molecular mechanisms underlying various pathologies, it holds several inherent shortcomings: (1) The MTRasym metric is only "semi-quantitative" and is simultaneously affected by several exchange properties and relaxation times, so that competing mechanisms cannot be easily de-convolved. (2) The acquisition protocol parameters substantially affect the CEST signal SNR and the MTRasym contrast; thus, simulations and optimization efforts are required prior to new experiments.3-5 Moreover, the protocol parameters used by different groups vary substantially, making the comparison and generalization of findings difficult.6Although several methods were developed to allow quantitative CEST imaging,7,8 they usually require the acquisition of several z-spectra at various saturation powers, resulting in a very long scan-time, unpractical for clinical settings. Recently, CEST MR-fingerprinting (MRF) was suggested as a fast technique for obtaining quantitative maps.9-11 However, it was shown that the discrimination ability between the various exchange parameters is still very dependent on the acquisition parameters,12 which need to be optimized for the clinical case of interest.
The purpose of this work is to suggest and evaluate a different paradigm for conducting and analyzing CEST experiments. We base our approach on the new developments in machine learning based protocol design,13 where an MR physics governed AI system gets a broadly defined clinical scenario as input, and automatically outputs the corresponding optimal acquisition schedule as well as the optimal reconstruction method (in the form a well-trained deep reconstruction neural-network). This concept was recently demonstrated for water T1 and T2 mapping and here is expanded for fast and quantitative CEST imaging.
Methods
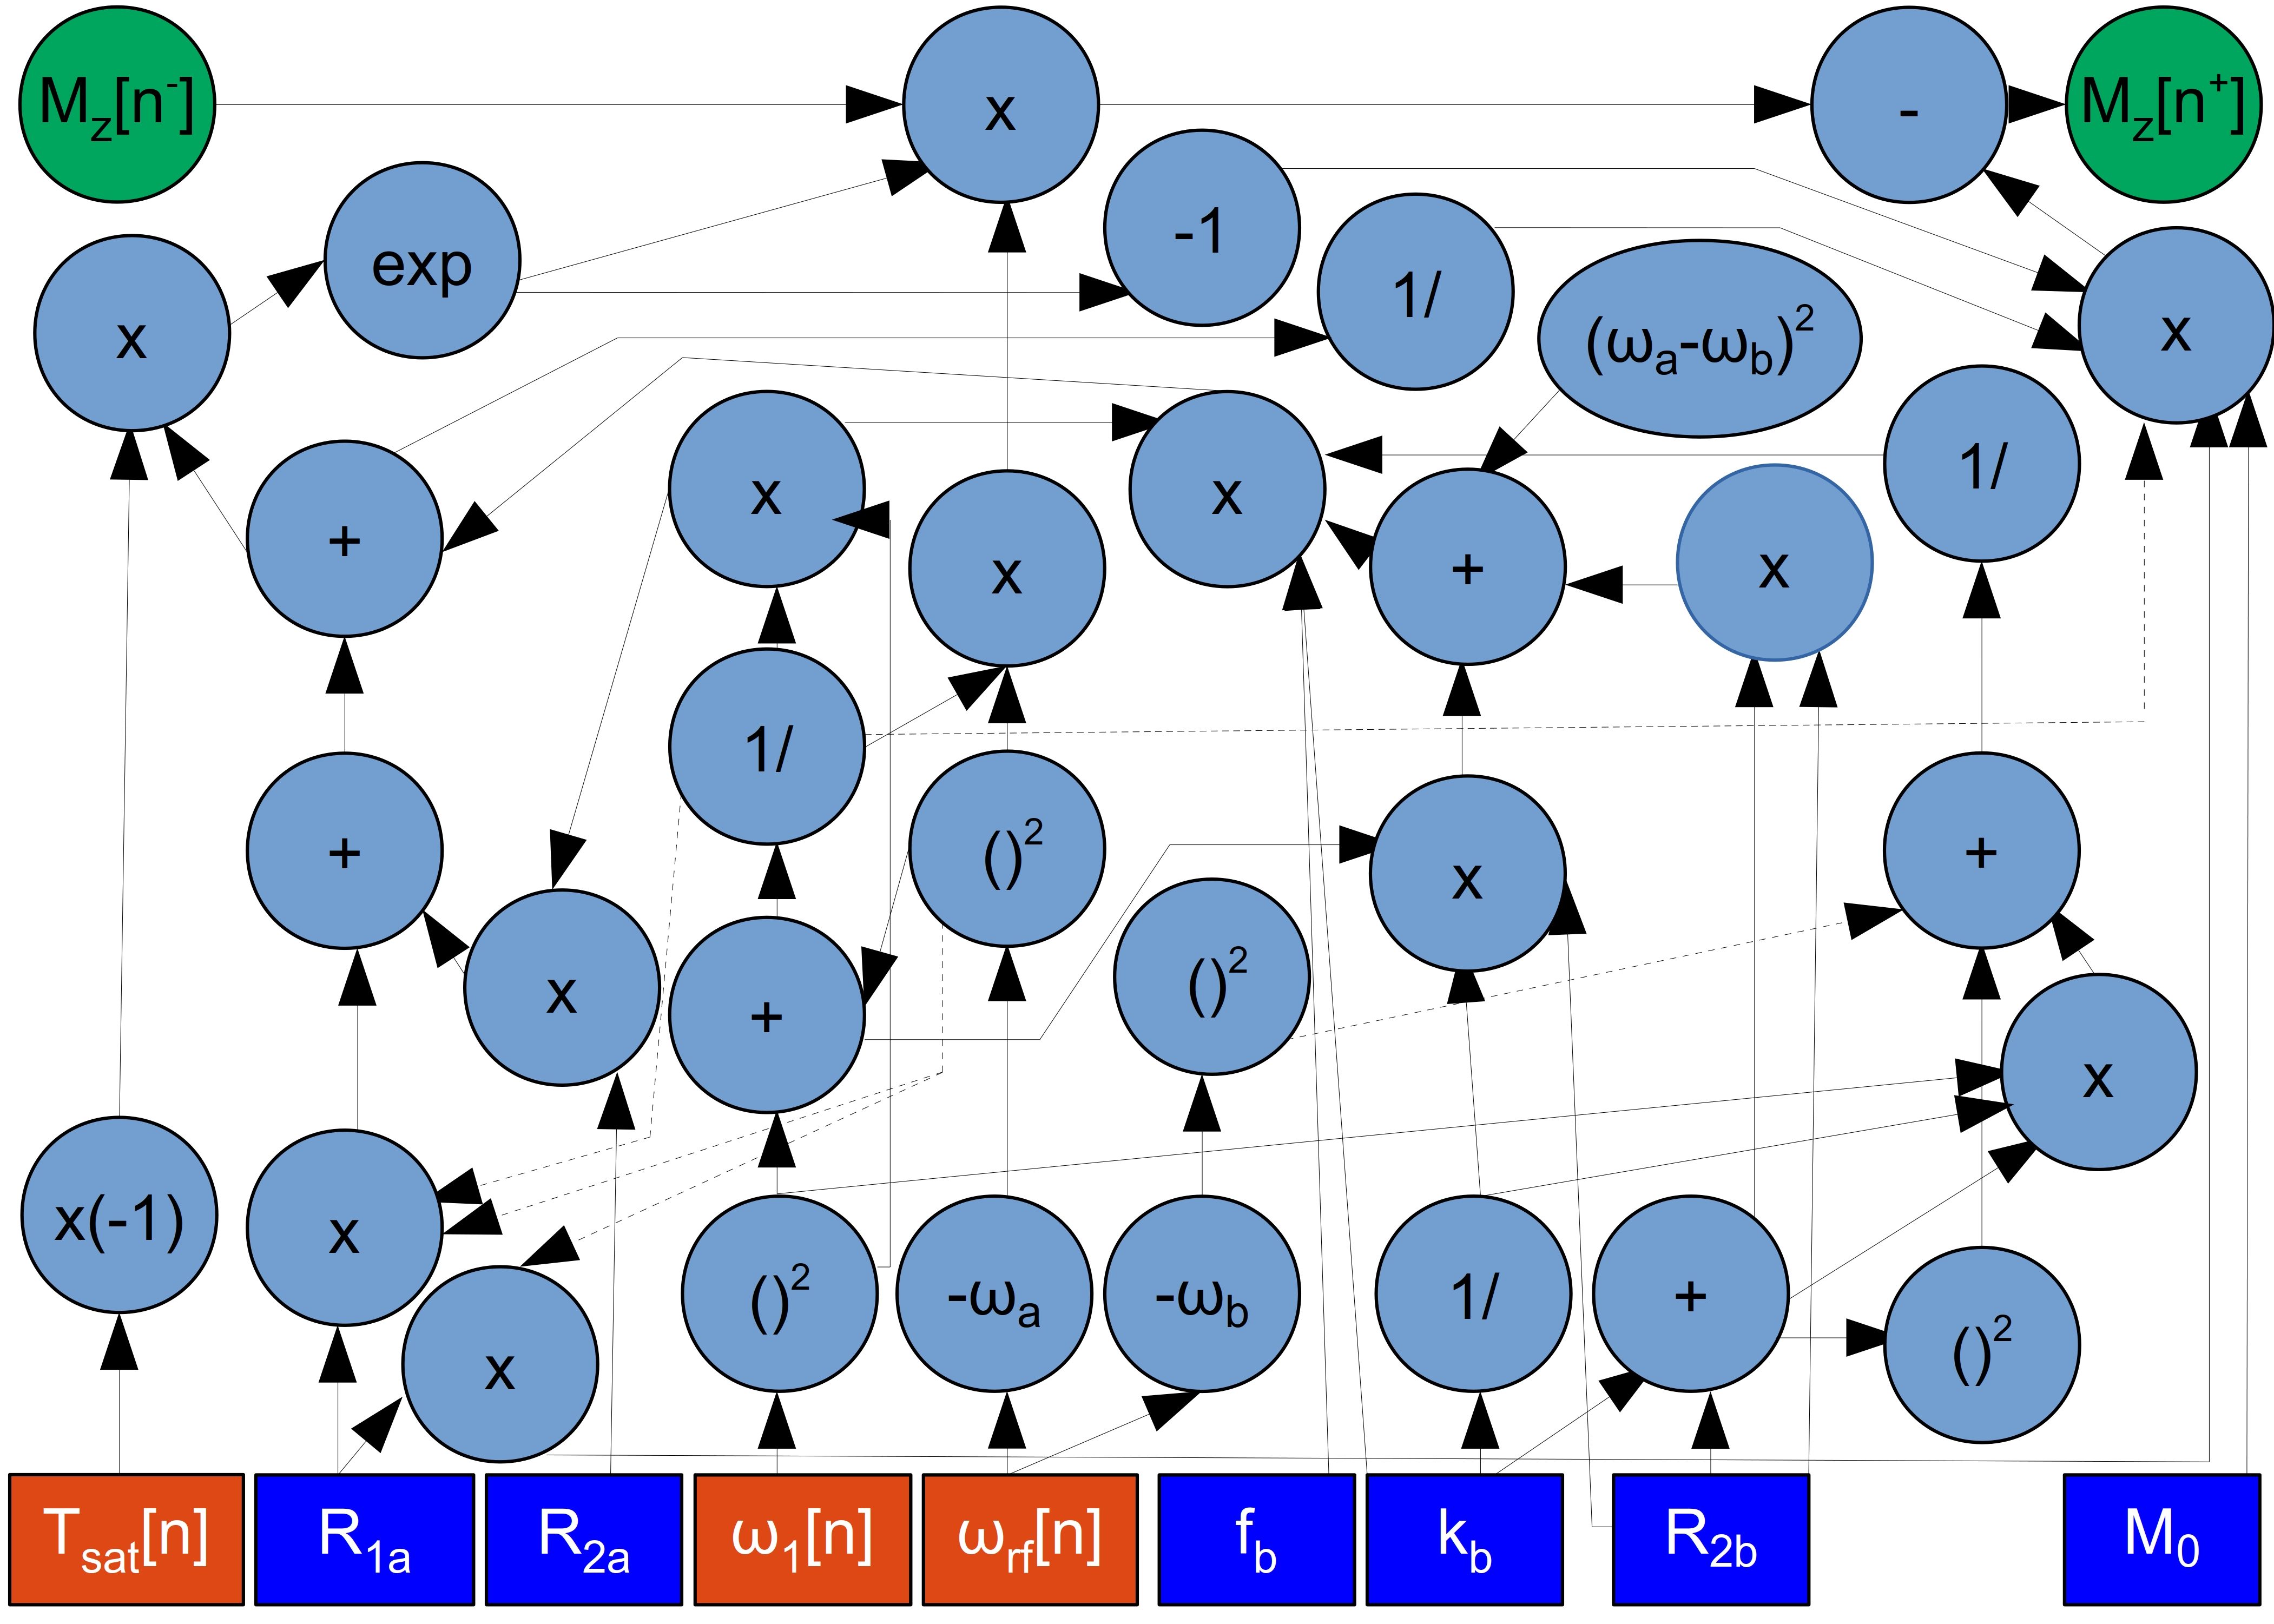
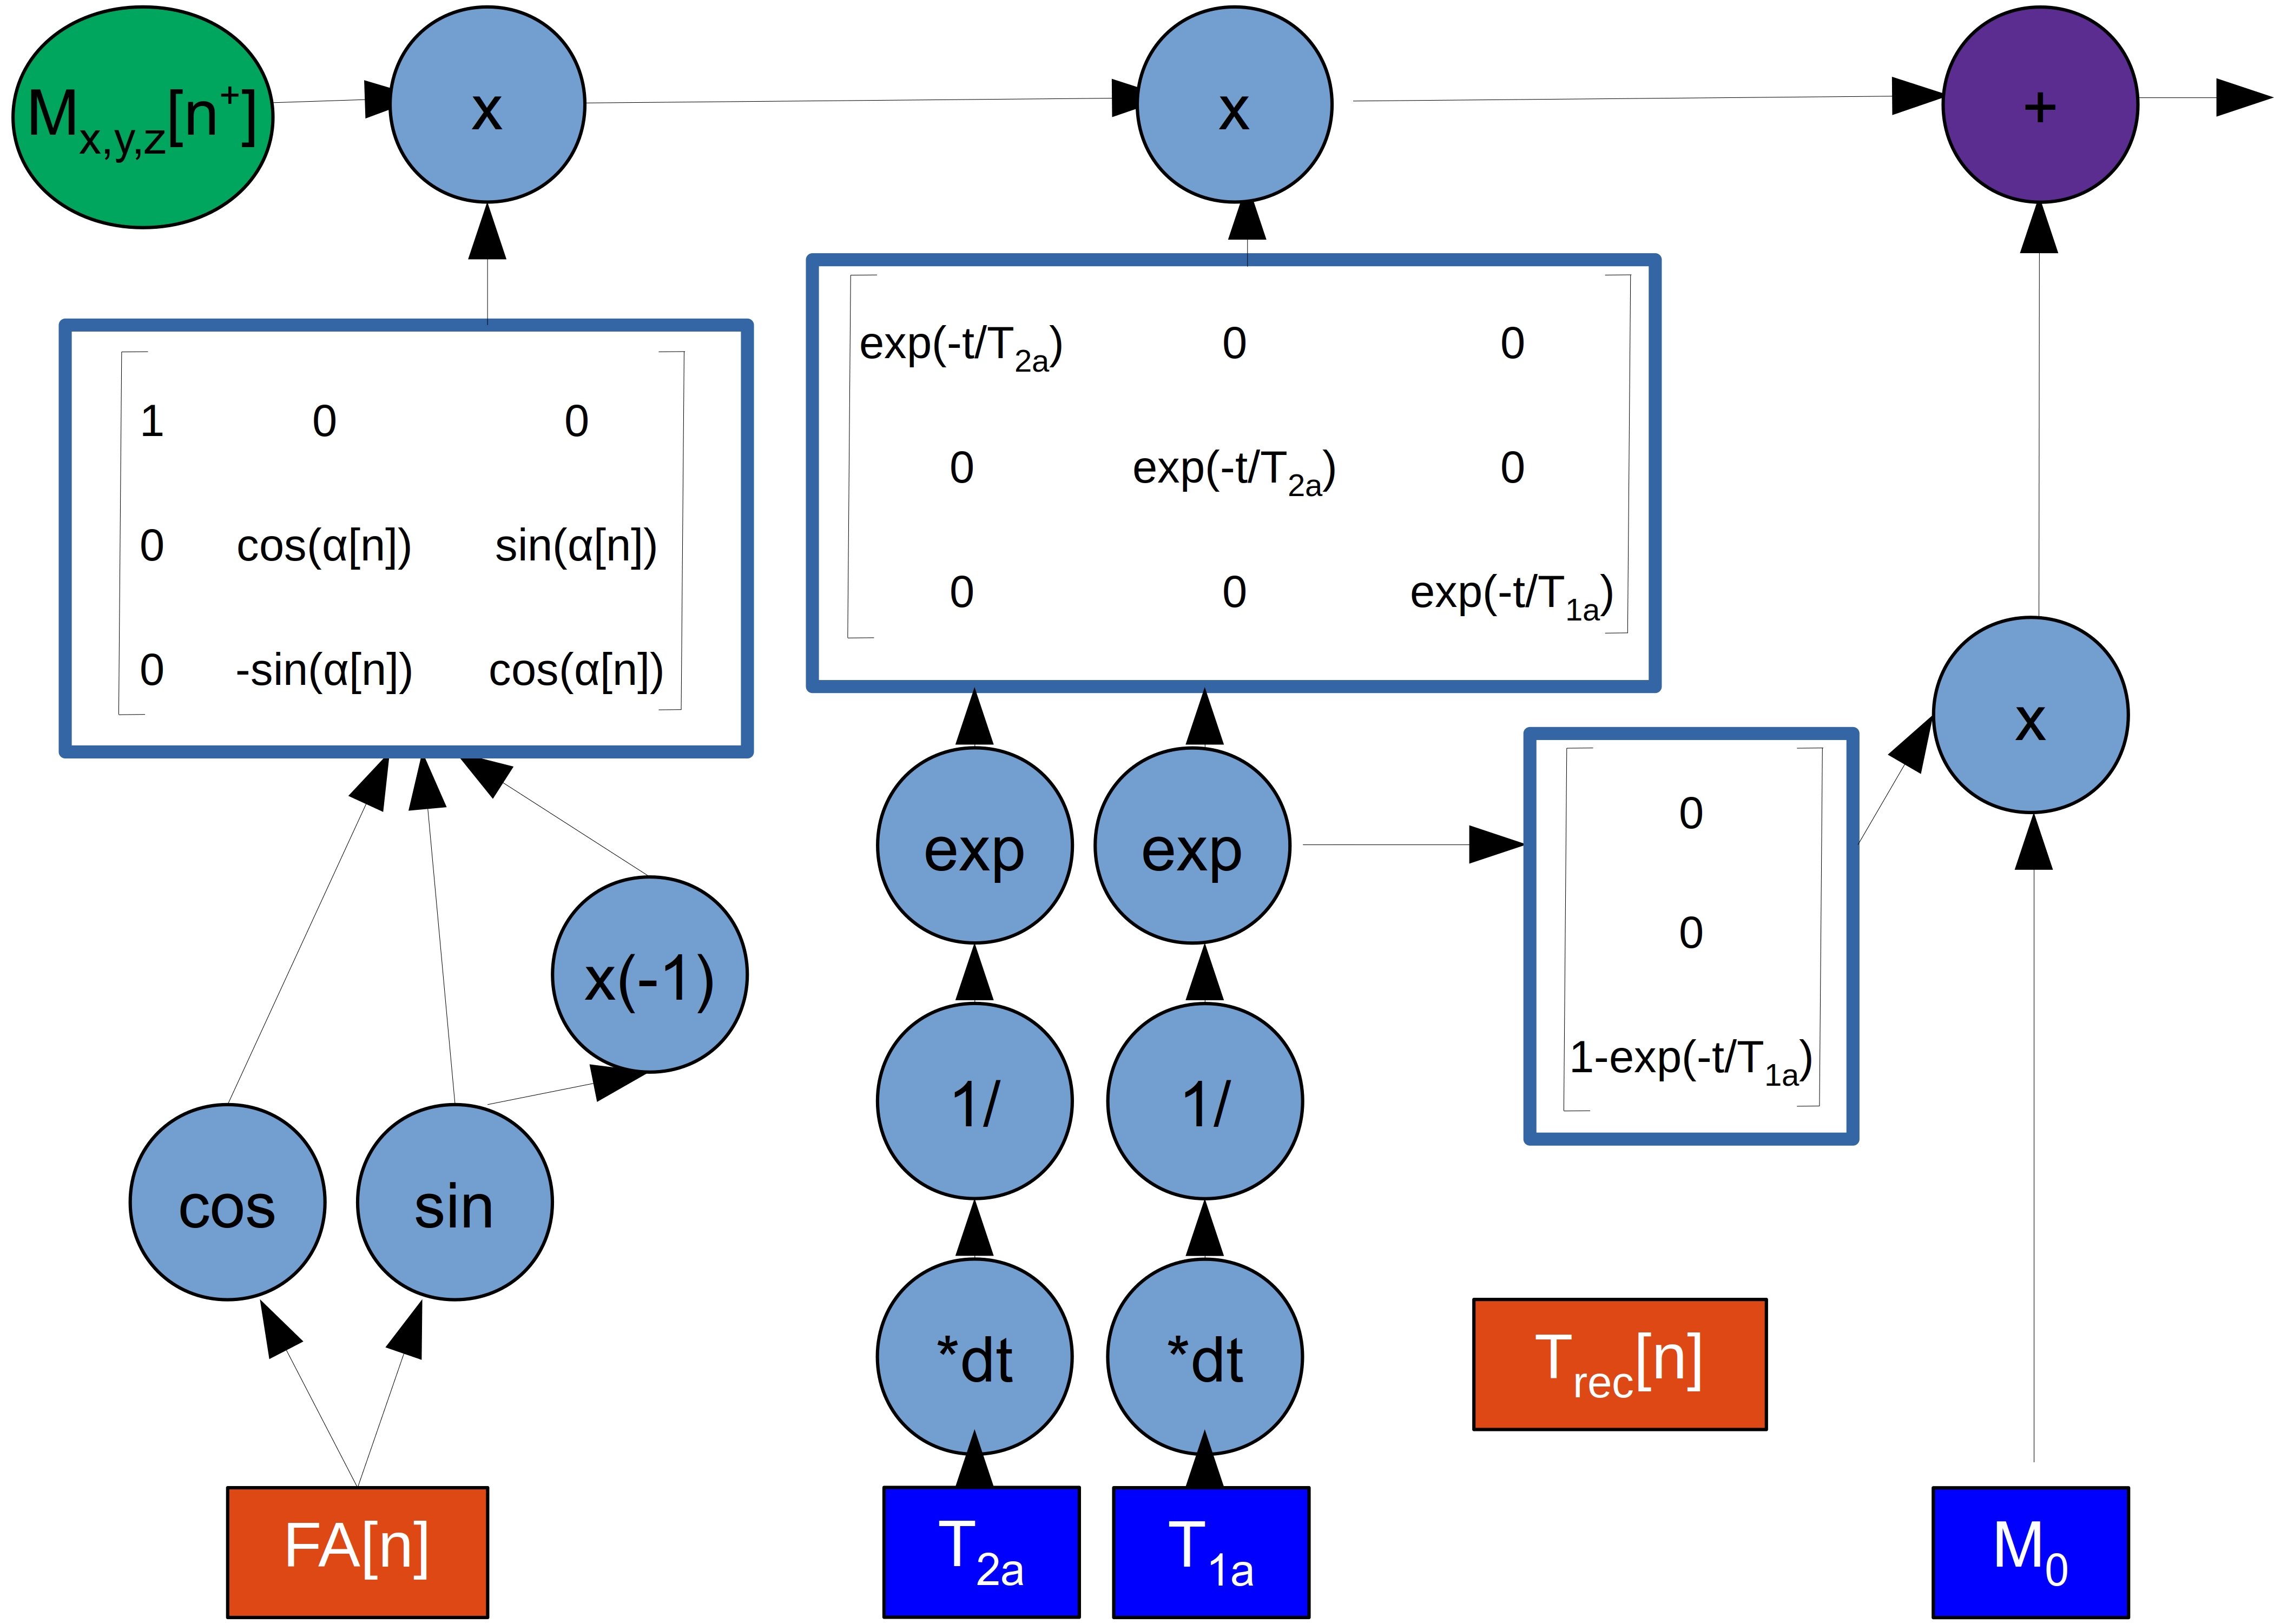
AutoCEST architectureThe optimization of an MR schedule as part of a deep-learning system is analogues to treating each of the acquisition parameters as a neural-network node weight. To achieve efficient optimization using auto-differentiation, we have represented the CEST saturation block as a computational graph (Fig. 1), based on the analytical solution of the Bloch-McConnell equations.14 This step allows the calculation of the water-pool Mz component at the end of the saturation, and more importantly, the update of the saturation-block parameters during training. In the next step of the forward-direction modeling, the transverse spin components are zeroed-out, assuming sufficient spoiling is applied. Next, the spin dynamics are calculated during excitation and relaxation, using the Bloch equations with a discrete-time state-space model in the rotating frame13 (Fig. 2). This allows for the update of the flip-angle and the recovery time parameters as well as the calculation of the expected “ADC” signals. Finally, the resulting MR signals are mapped to CEST quantitative parameters using a fully connected 4-layers deep reconstruction network15 (Fig. 3).
Training and implementation
The entire model was implemented using PyTorch. The acquisition and reconstruction steps were serially connected to allow joint optimization using stochastic gradient descent. The number of training epochs was set to 100 and the number of images to acquire was set to N = 11. The network was trained with 665,873 simulated CEST-MRI signals.9 The reconstruction network was composed of an 11-node input layer, two hidden layers of 300 nodes each, and a two-node output layer, designed to output the CEST proton exchange rate and concentration.
Phantom studies
To validate the suggested approach, a set of 3 phantoms were imaged, containing various concentrations of L-arginine dissolved in a buffer titrated to a range of 4-6 pH.12 The phantoms were imaged using a 4.7T scanner (Bruker, Germany), employing an in-house programmed, flexible CEST-EPI protocol, loaded with the parameters output by AutoCEST. For comparison, a traditional Z-spectra was obtained and a QUESP scan served as the reference ground-truth.
Results and discussion
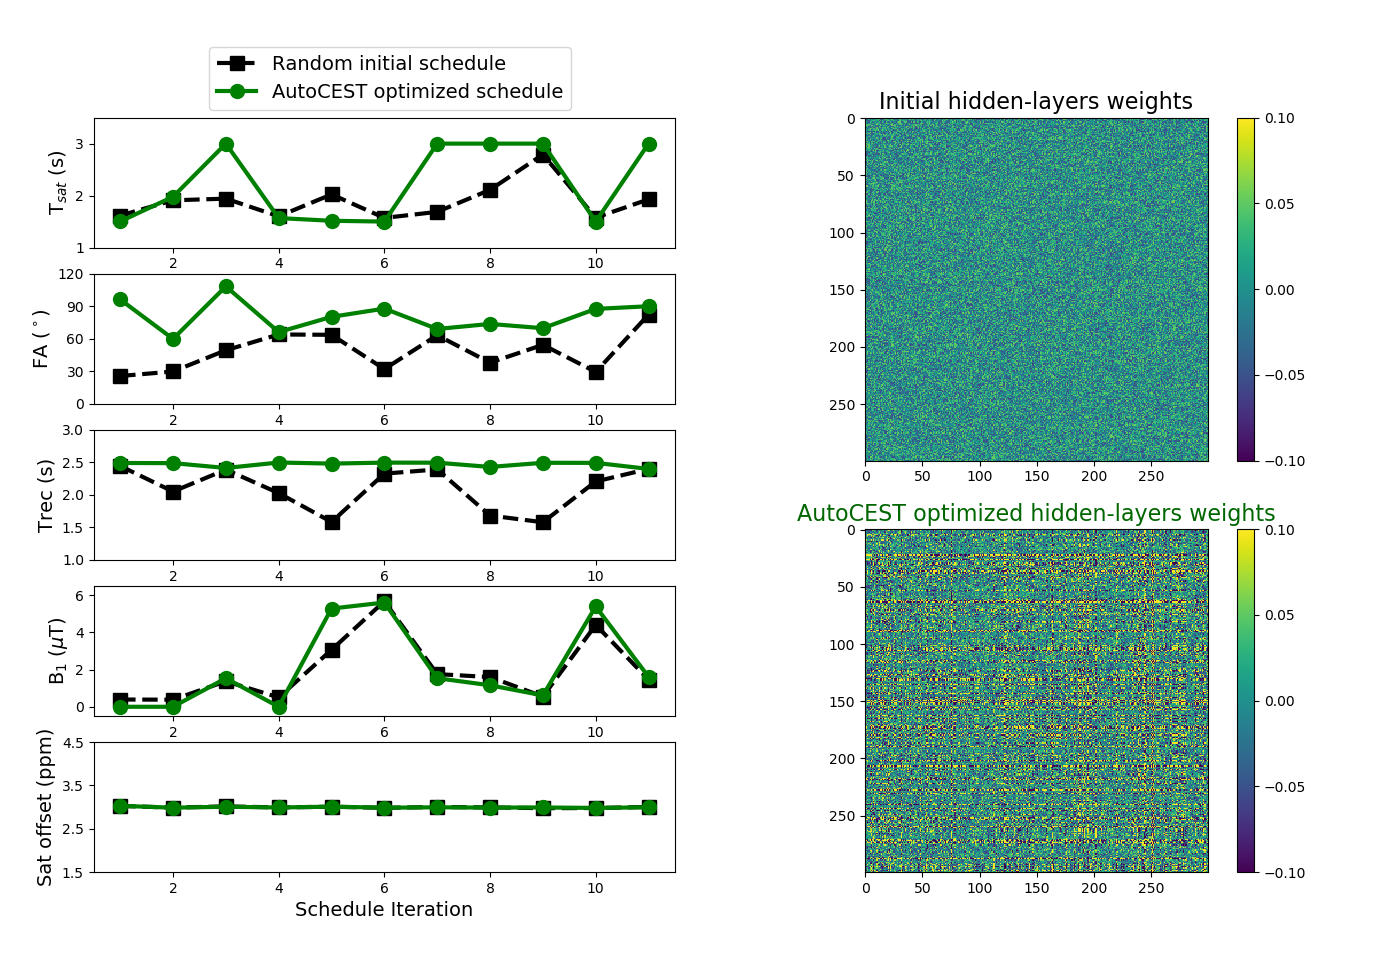
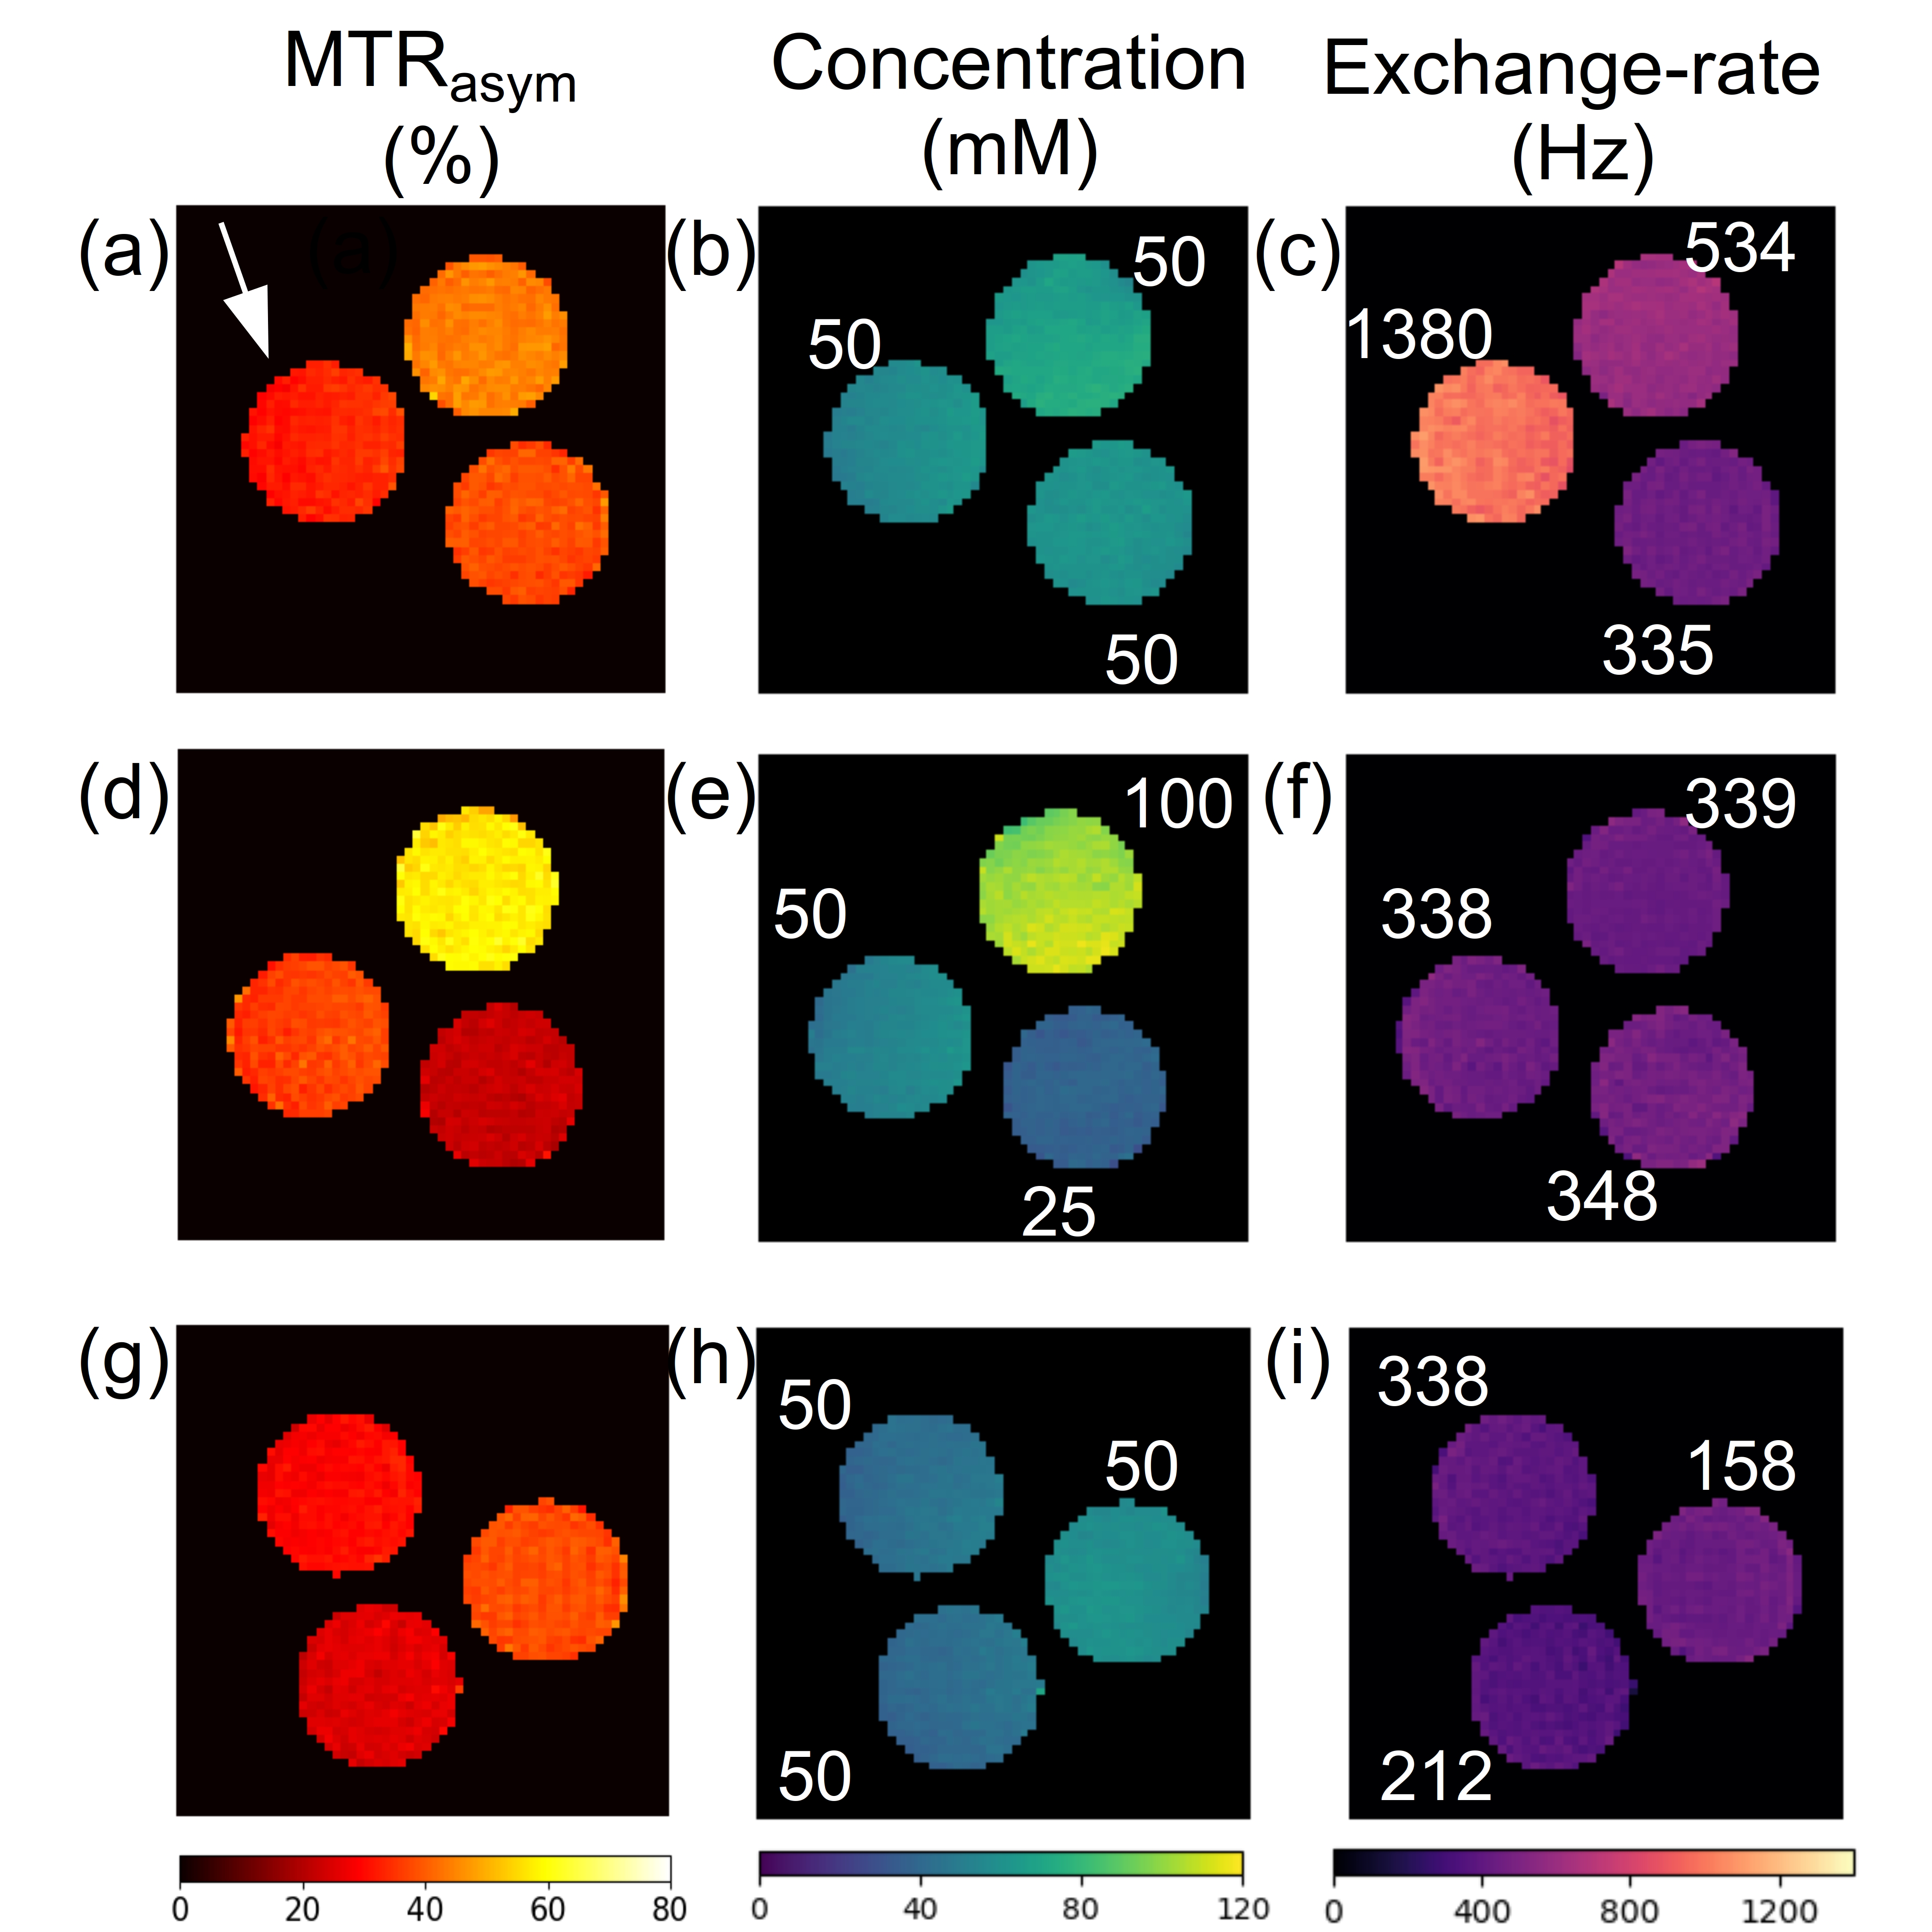
A comparison between the initialized acquisition protocol parameters and the AutoCEST optimized parameters can be seen in Fig. 4. As expected, the optimal saturation frequency offset remained as initialized; namely, roughly fixed at the solute frequency offset (3 ppm). The resulting recovery times were generally longer than initialized, in agreement with the trend reported in previous CEST-MRF optimizations.12 The rest of the parameters appeared to vary without any noticeable human-intuition, similar to the output for T1/T2 automatic sequence generation.13 The resulting AutoCEST sequence acquisition and reconstruction times were 52 s and 36 ms respectively. The output maps (Fig. 5.) were in good agreement with the known solute concentration and QUESP-measured exchange rates (RMSE: 9.80 ± 2.85 mM and 176.86 ± 49.46 Hz respectively). In comparison, the single z-spectrum acquisition and the resulting MTRasym images were not suitable for proper contrast evaluation of the entire wide range of examined exchange rates (Fig 5a) and were not able to decouple the exchange-rate-based changes from the concentration-based changes (Fig. 5d).Conclusion
The suggested framework provides a fast and automatic means for designing and analyzing quantitative CEST experiments, potentially contributing to the efforts to disseminate CEST in the clinic. Additional work is underway to incorporate the semisolid-pool, account for pulsed saturation blocks, and evaluate the method in-vivo.Acknowledgements
National Institutes of Health Grant/Award Numbers: R01CA203873, P41-RR14075. This project has received funding from the European Union’s Horizon 2020 research and innovation programme under the Marie Skłodowska-Curie grant agreement No. 836752 (OncoViroMRI).References
1) van Zijl, P., & Knutsson, L. In vivo magnetic resonance imaging and spectroscopy. Technological advances and opportunities for applications continue to abound. J. Magn Reson. 2019;306, 55-65.
2) van Zijl, P. C., Lam, W. W., Xu, J., Knutsson, L., & Stanisz, G. J. Magnetization transfer contrast and chemical exchange saturation transfer MRI. Features and analysis of the field-dependent saturation spectrum. Neuroimage 2018;168, 222-241.
3) Kim, J., Wu, Y., Guo, Y., Zheng, H., & Sun, P. Z. . A review of optimization and quantification techniques for chemical exchange saturation transfer MRI toward sensitive in vivo imaging. Contrast media & molecular imaging 2015;10(3), 163-178.
4) Schmitt, B., Zaiß, M., Zhou, J., & Bachert, P. Optimization of pulse train presaturation for CEST imaging in clinical scanners. Magn Reson Med. 2011;65(6), 1620-1629.
5) Zu, Zhongliang, et al. "Optimizing pulsed‐chemical exchange saturation transfer imaging sequences." Magn Reson Med. 2011;66.4 1100-1108.
6) Jones, K. M., Pollard, A. C., & Pagel, M. D. Clinical applications of chemical exchange saturation transfer (CEST) MRI. J. Magn Reson. 2018;47(1), 11-27.
7) Meissner, J. E., Goerke, S., Rerich, E., Klika, K. D., Radbruch, A., Ladd, M. E., ... & Zaiss, M. Quantitative pulsed CEST-MRI using omega-plots. NMR in Biomedicine 2015;28(10), 1196-1208.
8) Sun, P. Z. Simplified quantification of labile proton concentration‐weighted chemical exchange rate (kws) with RF saturation time dependent ratiometric analysis (QUESTRA): normalization of relaxation and RF irradiation spillover effects for improved quantitative chemical exchange saturation transfer (CEST) MRI. Magn Reson Med. 2012;67(4), 936-942.
9) Cohen, O., Huang, S., McMahon, M. T., Rosen, M. S., and Farrar, C. T. Rapid and quantitative chemical exchange saturation transfer (CEST) imaging with magnetic resonance fingerprinting (MRF). Magn Reson Med. 2018;80(6):2449–2463.
10) Heo, H. Y., Han, Z., Jiang, S., Schär, M., van Zijl, P. C., & Zhou, J. Quantifying amide proton exchange rate and concentration in chemical exchange saturation transfer imaging of the human brain. NeuroImage, 2019;189, 202-213.
11) Zhou, Zhengwei, et al. "Chemical exchange saturation transfer fingerprinting for exchange rate quantification." Magn Reson Med. 2018; 80.4: 1352-1363.
12) Perlman, O., Herz, K., Zaiss, M., Cohen, O., Rosen, MS., Farrar, CT. CEST MR-Fingerprinting: Practical considerations and insights for acquisition schedule design and improved reconstruction. Magn Reson Med. 2020;83:462-478.
13) Zhu B, Liu J, Koonjoo N, Rosen B, Rosen MS. AUTOmated pulse SEQuence generation (AUTOSEQ) and neural network decoding for fast quantitative MR parameter measurement using continuous and simultaneous RF transmit and receive. in ISMRM Annual Meeting & Exhibition, 1090. Montreal, QC, Canada: International Society for Magnetic Resonance in Medicine; 2019.
14) Zaiss, M., Bachert, P. Exchange-dependent relaxation in the rotating frame for slow and intermediate exchange–modeling off-resonant spin-lock and chemical exchange saturation transfer. NMR in Biomedicine, 2013;26(5), 507-518.
15) Cohen, O., Zhu, B., and Rosen, M. S. MR fingerprinting deep reconstruction network (DRONE). Magn Reson Med. 2018;80(3):885–894.
16) Graves, A. Generating sequences with recurrent neural networks. 2013; arXiv preprint arXiv:1308.0850.
Figures