3097
Glioma staging with CEST asymmetry curves and amides/amines ratio.1Lysholm Dept of Neuroradiology, National Hospital for Neurology & Neurosurgery, UCL Hospitals NHS Foundation Trust, London, United Kingdom, 2UCL Institute of Neurology, London, United Kingdom, 3Olea Medical, La Ciotat, France, 4University College of London Hospitals NHS Foundation Trust, London, United Kingdom, 5Biomedical Engineering Department, School of Biomedical Engineering and Imaging Sciences, King's College London, London, United Kingdom, 6Department of Neurodegenerative Disease, Institute of Neurology UCL, London, United Kingdom, 7National Hospital for Neurology & Neurosurgery, UCL Hospitals NHS Foundation Trust, London, United Kingdom, 8Siemens Healthcare Limited, Erlangen, Germany
Synopsis
Gliomas are the most common primary brain tumour, whose staging depends on the IDH and 1p/19q status and is reflected in different prognoses and clincal management. CEST is a highly sensitive MRI technique detecting amide- and amine-containing mobile proteins. The CEST amides/amines ratio has been proposed as a measure of pH in stroke. We show that CEST amides/amines ratio is much more sensitive than separate amides and amines CEST in differentiating gliomas with the best prognosis (IDH-mutant_1p/19q-retained) from those with the worst prognosis (IDH-wildtype). The different shapes in CEST asymmetry spectra could also potentially help in glioma staging.
Introduction
Gliomas account for almost 30% of all primary brain tumours and 80% of all malignant tumours1. Gliomas can be differentiated based on the status of the isocitrate dehydrogenase genes mutation (IDH-mutant or IDH-wildtype) and on the chromosomal combined 1p/19q status (1p/19q-retained or 1p/19q-codeleted). Three glioma groups can be identified: IDH-wt, IDH-mut_1p/19q-ret and IDH-mut_1p/19q-codel. More than 90% of glioblastomas are IDH-wt and have the worst prognosis, whilst the IDH-mut_1p/19q-codel are oligodendroglioma and have the best prognosis, with better response to radiotherapy and alkylating agent chemotherapy, longer progression free survival and prolonged overall survival2,3. Acidification of the tumour microenvironment corresponds to increased tumour aggressiveness, enhanced invasion, and resistance to various therapies1. Amide chemical exchange saturation transfer (CESTamides = CEST at 3.5ppm) and amine CEST (CESTamines = CEST at 2ppm) have so far been studied separately and have been shown to help differentiating IDH-wt from IDH-mut gliomas and 1p/19q-ret from 1p/19q-codel gliomas4,5. CESTamines has been shown to be sensitive to decreased extracellular pH, transverse relaxation rate, and amino acid concentration5. The ratio CESTamides/CESTamines (CESTamides/amines) has been proposed as a measure of pH in stroke6. In addition, in recent studies the presence of T2/FLAIR mismatch (high signal on T2-weighted images, and relatively low signal on FLAIR in more than 50% of the tumour) identified with 100% positive predictive value the IDH-mut 1p/19q-ret gliomas7-10, whilst some tumors in the same group do not show this mismatch. In this study, we assess whether the CESTamides/amines ratio is a powerful marker for glioma staging, especially for differentiating the gliomas with the best prognosis from those with the worst prognosis.Methods
Patients. 35 histologically confirmed, treatment naive, glioma patients (9 IDH-wt, 16 IDH-mut_1p/19q-retained, 10 IDH-mut_1p/19q-codel, Table 1) were enrolled in this prospective study. Gadolinium enhancement was present only in 9 of the 35 patients (6 with faint enhancement). MRI. Data were acquired on a 3T MAGNETOM Prisma (Siemens). CEST: a 2D single axial slice was located at the largest tumour cross-section (resolution=1.6x1.6x4mm3). Saturation at 3 saturations powers (1.7μT, 2.0μT and 2.3μT) was achieved with 41 Gaussian pulses of duration/interpulse delay=44.8/40ms, in a total TA=8:9min:s. One off-resonance (-150ppm) pre-saturation was followed by 37 equally-spaced alternating offsets from ±4.5ppm to 0ppm. T1-weighted images, with and without gadolinium: 3D SPACE, 0.9mm isotropic, TR/TE=700/11ms, TA=4:23min:s. T2-weighted images: 3D SPACE, 1.1mm isotropic, TR/TE=3200/401ms,TA=3:49min:s. FLAIR images: 3D SPACE, TR/TE/TI=5000/502/1600ms, TA=4:22min:s. ROIs. An experienced neuroradiologist outlined (1) the solid tumour (ROIT) on FLAIR images, excluding cysts and necrotic components and (2) the contralateral white matter (ROIWM). Analysis. CEST data were processed with a prototype software created by Olea Medical® for the Horizon 2020 project GLINT (number 667510). After B011 and B112 inhomogeneity correction, the CEST maps were computed as the area under the MTRasym(ω) curve13 in the range Δω=[1.5,2.5]ppm for the amines and Δω=[3,4]ppm for the amides. The tumour signal was normalised by subtracting the WM: AUC_ΔMTRasym=AUC_MTRasym(Δω,ROIT)-AUC_MTRasym(Δω,ROIWM). Statistics: after normality test, a Kruskal Wallis test was followed, when significant, by Dunn's pairwise comparison with Holm-Sidak adjustment for multiple comparisons. p<0.05 was considered statistically significant.Results
The ΔMTRasym plots (Fig 1a) show a similarity in shape between the spectra of the two IDH-mut groups, with an approximately 30% higher intensity for the IDH-mut_1p/19q-ret gliomas. The shape of the IDH-wt spectrum shows a proportionally larger contribution in the amides range and a proportionally smaller contribution in the amines range with respect to the two IDH-mut groups. The ΔMTRasym spectrum of the IDH-mut_1p/19q-ret with T2/FLAIR mismatch has approximately 50% higher intensity than the spectrum of IDH-mut_1p/19q-ret without T2/FLAIR mismatch (Fig 1b). Representative images of the structural images and of the CEST maps are shown in Fig 2.When considering all subjects, CESTamines is significantly lower in the IDH-wt than in the IDH-mut_1p/19q-ret gliomas and CESTamides/amines is significantly higher in the IDH-wt than in both IDH-mut gliomas subgroups (Table 1, Fig 3). When considering a subset of IDH-mut_1p/19q-ret with T2/FLAIR mismatch, in addition to the described significant differences, both the CESTamides and CESTamines are significantly higher in the IDH-mut_1p/19q-ret than in the IDH-mut_1p/19q-codel gliomas (Table 1, Fig 4). The CESTamides/amines remains significantly higher in IDH-wt than in IDH-mut_1p/19q-codel gliomas also when considering a subset of IDH-mut_1p/19q-ret without T2/FLAIR mismatch.
Discussions and Conclusions
Our results show that CESTamides/amines ratio is much more sensitive than CESTamides and CESTamines in differentiating IDH-wt from IDH-mut_1p/19q-codel gliomas. It is also as sensitive as CESTamines in differentiating IDH-wt from IDH-mut_1p/19q-ret gliomas, whilst CESTamides and CESTamines separately are more sensitive than CESTamides/amines in differentiating IDH-mut_1p/19q-ret from IDH-mut_1p/19q-codel gliomas. CESTamides/amines ratio, in the hypothesis of amides and amines belonging to the same molecule, has been shown to be a measure of pH(ref) whilst, if this hypothesis is not valid, it is also related to the concentrations of amides and amines and to the T1 relaxation times. The presence of T2/FLAIR mismatch (in 66% of the IDH-mut_1p/19q-ret in our cohort) strongly affects the CEST maps and needs further investigation in larger datasets. Our CEST maps have contributions also from the Nuclear Overhauser Effect and other confounding effects whose relevance can be assessed with more advanced acquisition and analysis protocols(ref). Differentiating IDH-wt (worst prognosis) from IDH-mut_1p/19-codel (best prognosis) is highly clinically relevant.Acknowledgements
This project has received funding from the European Union’s Horizon 2020 research and innovation programme under grant agreement No 667510 and the Department of Health’s NIHR-funded Biomedical Research Centre at University College London.
SB and LM are supported by the National Institute of Health Research Biomedical Research Council, UCL Hospitals NHS Trust
EDV is supported by the Wellcome/EPSRC Centre for Medical Engineering [WT 203148/Z/16/Z]
References
1. Weller M, Wick W, Aldape K et al. Glioma. Nature Reviews 1:1-18 (2015)
2. Eckel-Passow J, Lachance DH, Molinaro AM et al. Glioma groups based on 1p/19q, IDH, and TERT promoter mutations in tumors. N Engl J Med 372:2499-2508 (2015)
3. The Cancer Genome Atlas Research Network. Comprehensive, integrative genomic analysis of diffuse lower-grade gliomas N Engl J Med 372:2481-2498 (2015)
4. Jiang S, Zou T, Eberhart CG et al. Predicting IDH mutation status in grade II gliomas using amide proton transfer-weighted (APTw) MRI. Magn Reson Med 78:1100-1109 (2017)
5. Yao J, Chakhoyan A, Nathanson DA et al. Metabolic characterization of human IDH mutant and wild type gliomas using simultaneous pH- and oxygen-sensitive molecular MRI. Neuro-Oncology 2019 May 4. pii: noz078. doi: 10.1093/neuonc/noz078. [Epub ahead of print]
6. McVicar N, Li AX, Goncalves DF et al. Quantitative tissue pH measurement during cerebral ischemia using amine and amide concentration-independent detection (AACID) with MRI. J Cereb Flow and Metab 34:690-698 (2014)
7. Patel S, Poisson LM, Brat DJ, et al. T2-FLAIR mismatch, an imaging biomarker for IDH and 1p/19q status in lower-grade gliomas: a TCGA/TCIA project. Clin Cancer Res 23:6078-6085 (2017)
8. Lasocki A, Gaillard F, Gorelik A and Gonzales M. MRI features can predict 1p/19q status in intracranial gliomas. Am J Neuroradiol 39:687-692 (2017)
9. Broen MPG, Smits M, Wijnenga MMJ et al. The T2-FLAIR mismatch sign as an imaging marker for non-enhancing IDH-mutant, 1p/19q-intact lower-grade glioma: a validation study. Neuro Oncol 20:1393-139 (2018)
10. Batchala PP, Muttikkal TJE, Donahue JH et al. Neuroimaging-Based Classification Algorithm for Predicting 1p/19q-Codeletion Status in IDH-Mutant Lower Grade Gliomas.Am J Neuroradiol 40:426-432 (2019)
11. Stancanello J, Terreno E, Castelli DD et al. Development and validation of a smoothing‐splines‐based correction method for improving the analysis of CEST‐MR images. Contrast media & molecular imaging, 3:136-149 (2008)
12. Windschuh J, Zaiss M, Meissner JE et al. Correction of B1‐inhomogeneities for relaxation‐compensated CEST imaging at 7 T. NMR Biomed, 28:529-537 (2015)
13.Terreno E, Stancanello J, Longo D, et al. Methods for an improved detection of the MRI‐CEST effect. Contrast media & molecular imaging, 4:237-247 (2009).
Figures
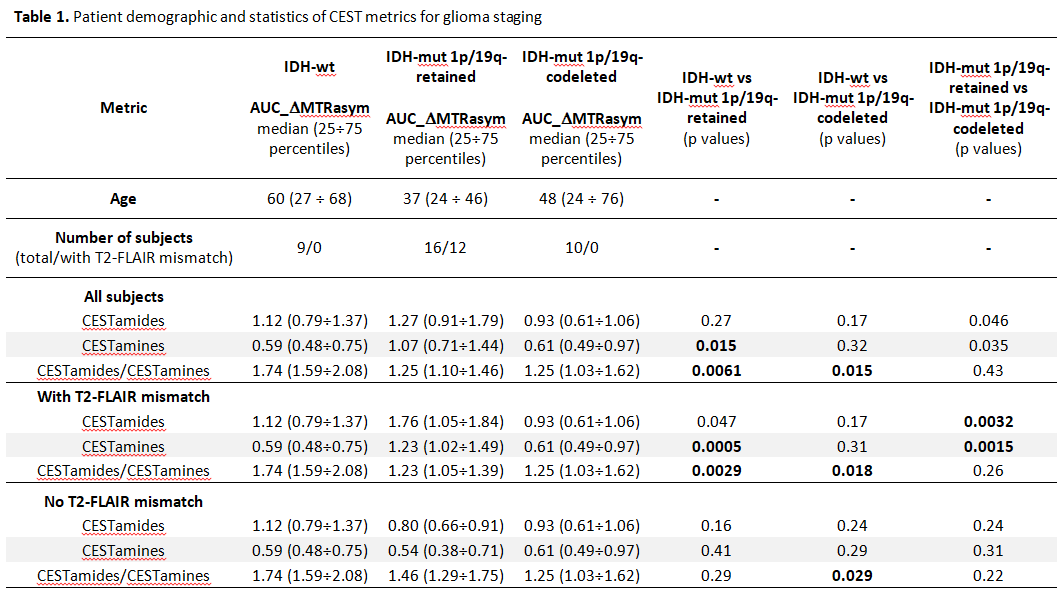
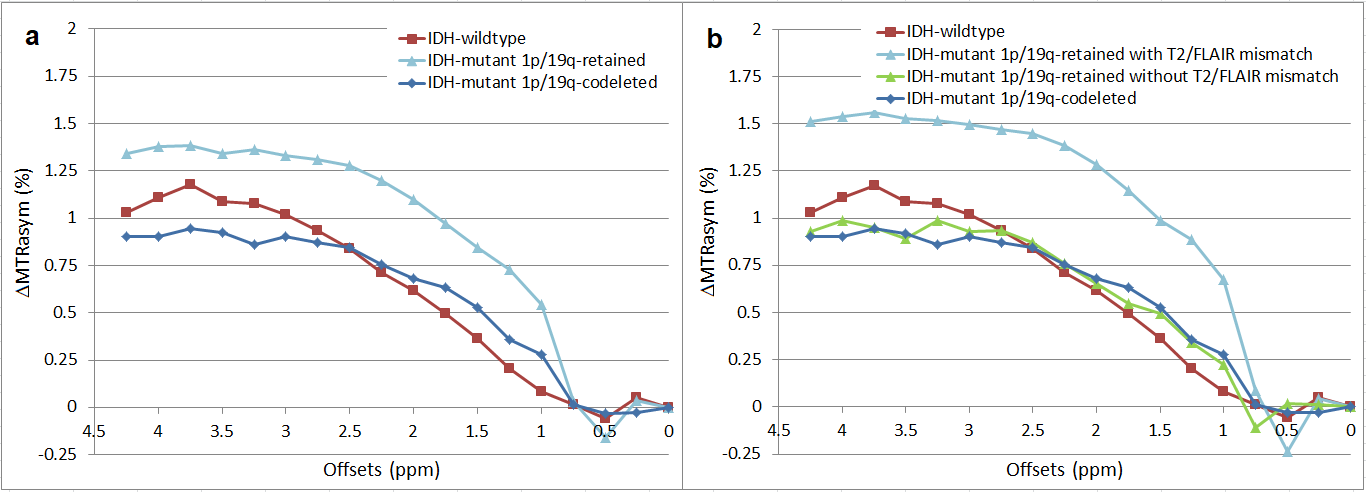
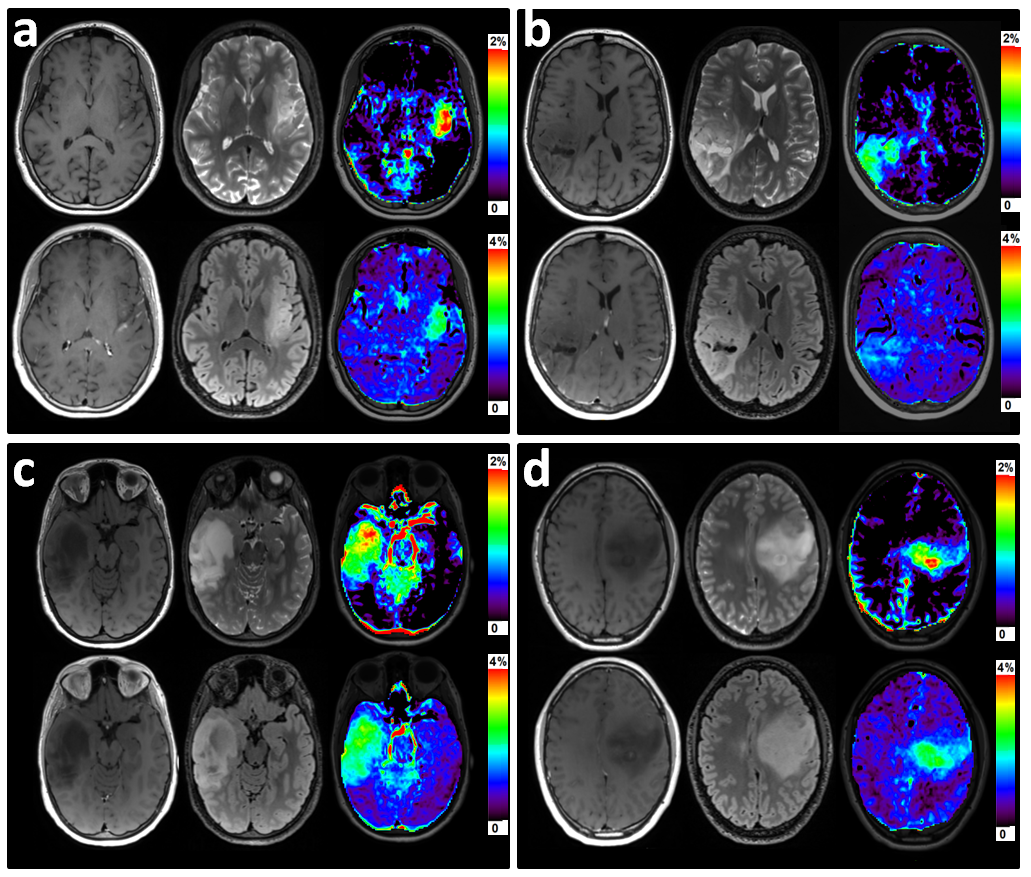
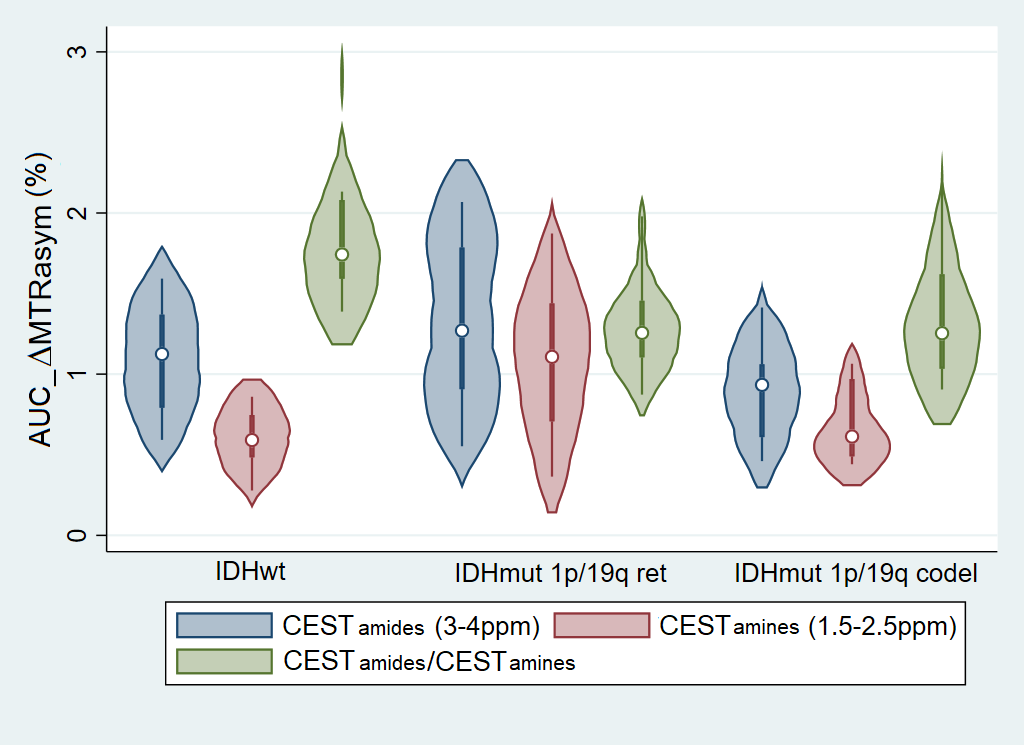
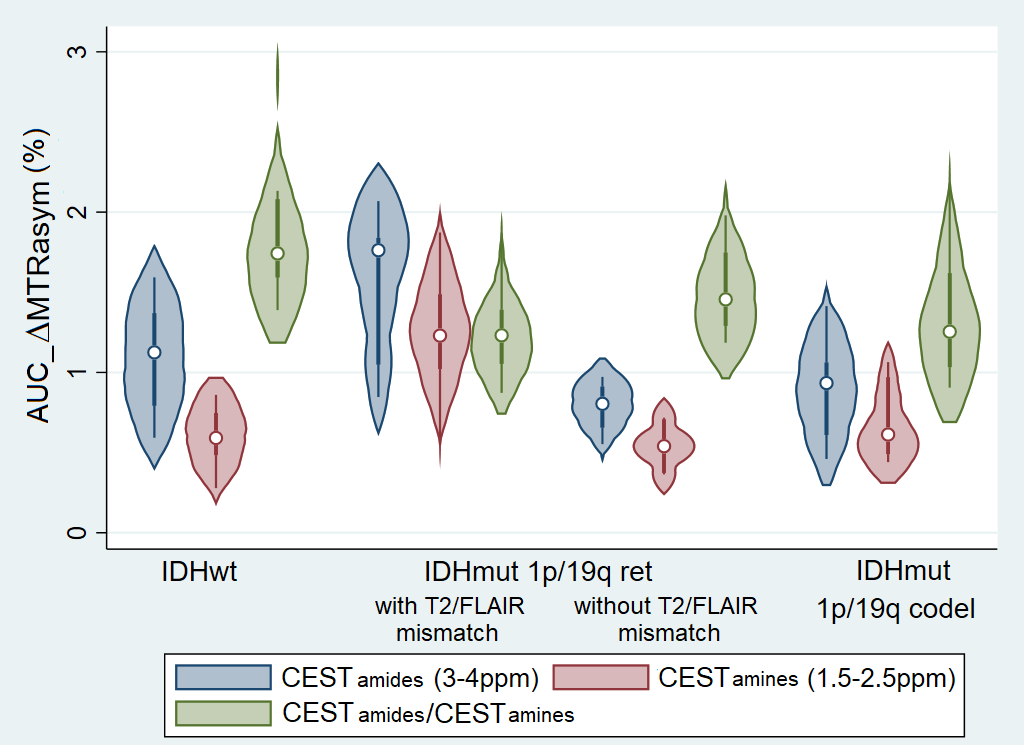
Fig 4. Violin plot of CESTamides (blue), CESTamines (red) and CESTamides/CESTamines (green). From left to right: IDH-wt, IDH-mut 1p/19q-ret with and without T2/FLAIR mismatch and IDH-mut 1p/19q-codel. CESTamines is lower in IDH-wt vs IDH-mut_1p/19q-ret (p=0.0005) and CESTamides/CESTamines is higher in IDH-wt vs both IDH-mut 1p/19q-ret (p=0.0029) and IDH-mut 1p/19q-codel (p=0.0018). In addition, CESTamides and CESTamines are higher in IDH-mut_1p/19q-ret vs IDH-mut_1p/19q-codel gliomas (p=0.0032 and p=0.0015).