3094
Investigation of Optimizing Chemical Exchange Saturation Transfer Imaging for Tuberous Sclerosis Epilepsy at 3 Tesla1Key Laboratory for Biomedical Engineering of Ministry of Education, Department of Biomedical Engineering, College of Biomedical Engineering & Instrument Science, Zhejiang University, Hangzhou, China, 2Department of Neurology, First Affiliated Hospital, College of Medicine, Zhejiang University, Hangzhou, China, 3Siemens Healthcare Ltd., Shanghai, China
Synopsis
Epilepsy is a prevalent neurological manifestation of Tuberous Sclerosis Complex (TSC). Here, the feasibility of applying Chemical Exchange Saturation Transfer (CEST) imaging to TSC epilepsy is investigated, with the radio-frequency saturation power, duration and frequency offsets optimized. The maximum CEST contrast between cortical tubers and normal white matter was achieved for an optimal saturation duration of 1000ms, while the optimal saturation frequency offset was related to the saturation power. Importantly, distinct contrast between tubers and normal white matter was demonstrated for TSC epilepsy for the first time, indicating CEST may serve as a potentially useful tool for diagnosing TSC.
Introduction
Cortical tubers are one of the major intracranial hallmarks of Tuberous Sclerosis Complex (TSC). Previous studies have demonstrated that the homeostasis of some metabolites (e.g. glutamate and N-acetyl groups) is impaired in TSC epilepsy. 1,2 Chemical Exchange Saturation Transfer (CEST) MRI allows the detection of in vivo metabolites by frequency-selective radio-frequency (RF) saturation pulses targeting various metabolite pools. 3 However, the role of CEST imaging is not established in TSC. In the present study, the feasibility of applying CEST MRI for the detection of TSC tubers at 3T was evaluated, with RF saturation power, duration and frequency offsets optimized in order to obtain the best CEST contrast for tuber description.Methods
Nine TSC epilepsy subjects were scanned on a 3T MRI system (MAGNETOM Prisma, Siemens Healthcare, Erlangen, Germany) with approval given by the local IRB and consent forms signed by each participant. Anatomical images acquired from the T2-weighted turbo-spin-echo sequence (TR=9s, TE=83ms, resolution=0.69mm×0.69mm, and slice thickness=2.5mm) were used to plan the slice location for CEST imaging. The CEST sequence was done with turbo-spin-echo readout using the following parameters: slice thickness=5mm; FOV=212mm×185.5mm; matrix size=416×364; TE=8.1ms; RF saturation duration=400ms, 700ms, and 1000ms with corresponding TR=3s, 4s, and 5s, respectively; RF saturation power=1, 2, 3, and 4μT; and RF saturation frequencies=-6 to 6ppm stepped at 0.25ppm and 15.6ppm. The WASSR method 4 was used to determine B0 offset maps with the same readout parameters to the aforementioned CEST sequence, except with the saturation frequency from -1.2ppm to 1.2ppm stepped at 0.1ppm.All data was registered to the CEST frame at 3.5ppm 5 using the FLIRT tool (FSL, FMRIB Centre, University of Oxford) with a rigid body transformation. Data analysis was performed with in-house software written in Matlab (Mathworks, MA, USA). The CEST signal was quantified with the asymmetry analysis, CESTasym(-Δw) = Ssat(-Δw)/S0 – Ssat(Δw)/S0, where Δw was the saturation frequency, Ssat was the saturated CEST signal, and S0 was the unsaturated signal. Two regions of interest (tuber and normal-appearing white matter) were drawn manually on the CEST source images with reference to the T2-weighted images. The CEST contrast between the tuber and white matter was calculated as ΔCEST = CESTasym|tuber – CESTasym|white matter. The statistical test was performed with paired one-tailed t test.
Results
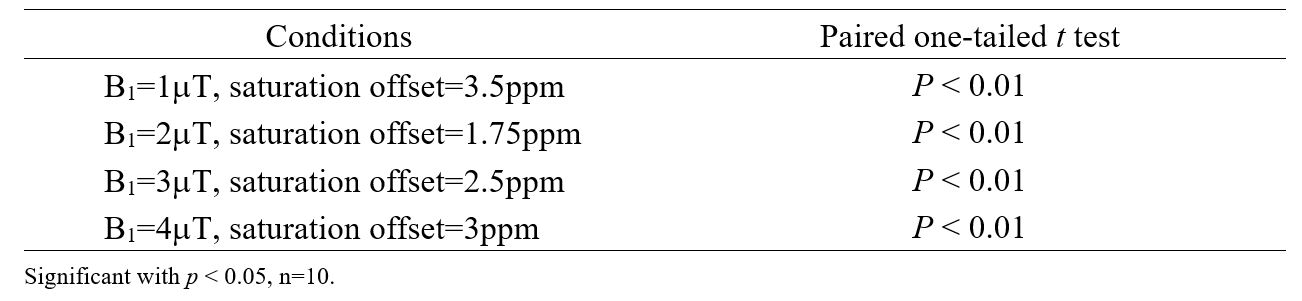
Ten tubers from 9 patients were included in the analysis. The average ΔCEST values under different B1 levels (1, 2, 3, and 4μT) with three saturation times (400ms, 700ms and 1000ms) at varying saturation offset frequencies from 1 to 4ppm are shown in Fig. 1. On the whole, ΔCEST increased with RF saturation duration, indicating 1000ms was the best among all three tested saturation times to differentiate the tuber and normal white matter. Fig. 2 and Fig. 3 show that CEST signals were higher in the tubers than those in the white mater. In addition, the peaks of CESTasym and ΔCEST occurred at similar saturation offsets for B1 of 2, 3, and 4μT (~1.75ppm for 2μT, ~2.5ppm for 3μT, and ~3ppm for 4μT). At a B1 power of 1μT, CESTasym didn’t reach a peak value within 1 to 4ppm, but ΔCEST attained its peak value at ~3.5ppm. Fig.4 illustrates the CEST maps of two representative TSC epilepsy patients, showing a distinct contrast between cortical tubers and normal white matter. Furthermore, the difference was statistically significant with a P-value <0.01 (Table 1).Discussion
As shown in Fig. 1, a long saturation time of 1000ms was helpful for the detection of tubers in TSC patients. Under this condition, the optimal CEST contrast between cortical tubers and normal white matter was obtained at 3.5ppm using a saturation power of 1μT, suggesting appreciable contributions from mobile proteins and peptides. 6 As B1 increased from 2μT to 4μT, the saturation offset of the peak CESTasym and ΔCEST values gradually moved from ~1.75ppm to ~3ppm. A prior study 7 has demonstrated that the CEST peak of glutamate is centered around 3ppm, and several studies 2,8 have reported elevated glutamate levels in TSC epilepsy. Although the exchange rate of amine protons in glutamate is very fast and the slow to intermediate exchange rate condition is not fulfilled at 3T, some amine protons might have been labeled and potentially contributed to the CEST effect at high B1. In any case, the calculated CEST maps at the optimal saturation offsets with respect to various B1 levels all exhibited significant contrast between tubers and contralateral normal tissues, demonstrating the feasibility of detecting TSC with CEST MRI. In addition, it is worthwhile noting that some elevated signals on CEST maps did not correlate well with hyperintensity on anatomical images (Fig. 4), which needs to be investigated in future studies.Conclusion
CEST MRI was successfully applied to TSC epilepsy patients, generating significant contrast between cortical tubers and normal tissues. The peak CEST contrast was achieved with the saturation duration of 1000ms, and at the saturation frequencies of ~1.75ppm, ~2.5ppm, and ~3ppm for B1 powers of 2μT, 3μT, and 4μT, respectively.Acknowledgements
NSFC grant number: 61801421, 81971605. Zhejiang Lab grant number: 2018EB0ZX01. This work is also supported by “the Fundamental Research Funds for the Central Universities (2019FZJD005)”.References
1. William Mukonoweshuro, Iain D. Wilkinson, Griffiths PD. Proton MR Spectroscopy of Cortical Tubers in Adults with Tuberous Sclerosis Complex. AJNR American journal of neuroradiology. 2001;22(10):1920-1925.
2. Michael Wong, Kevin C.Ess, Erik J.Uhlmann, et al. Impaired Glial Glutamate Transport in a Mouse Tuberous Sclerosis Epilepsy Model. Annals of neurology. 2003;54(2):251-256.
3. Vinogradov E, Sherry AD, Lenkinski RE. CEST: from basic principles to applications, challenges and opportunities. J Magn Reson. 2013;229:155-172.
4. Kim M, Gillen J, Landman BA, et al. Water saturation shift referencing (WASSR) for chemical exchange saturation transfer (CEST) experiments. Magnetic Resonance in Medicine. 2009;61(6):1441-1450.
5. Zhang Y, Heo HY, Lee DH, et al. Selecting the reference image for registration of CEST series. J Magn Reson Imaging. 2016;43(3):756-761.
6. Zhou J, Payen J-F, Wilson DA, et al. Using the amide proton signals of intracellular proteins and peptides to detect pH effects in MRI. Nature medicine. 2003;9(8):1085-1090.
7. Cai K, Haris M, Singh A, et al. Magnetic resonance imaging of glutamate. Nat Med. 2012;18(2):302-306.
8. Jabs R, Seifert G, Steinhauser C. Astrocytic function and its alteration in the epileptic brain. Epilepsia. 2008;49 Suppl 2:3-12.
Figures