3092
Investigation of a parallel transmission (pTx) GRE-readout with customized pulses for CEST MRI at 7 Tesla
Katharina Tkotz1, Andrzej Liebert1, Jürgen Herrler2, Patrick Liebig3, Arnd Dörfler2, Michael Uder1, Moritz Zaiss2,4, and Armin M. Nagel1,5
1Institute of Radiology, University Hospital Erlangen, Friedrich-Alexander-Universität Erlangen-Nürnberg, Erlangen, Germany, 2Department of Neuroradiology, University Hospital Erlangen, Friedrich-Alexander-Universität Erlangen-Nürnberg, Erlangen, Germany, 3Siemens Healthcare GmbH, Erlangen, Germany, 4Max Planck Institute for Biological Cybernetics, Tuebingen, Germany, 5Institute of Medical Physics, Friedrich-Alexander-Universität Erlangen-Nürnberg, Erlangen, Germany
1Institute of Radiology, University Hospital Erlangen, Friedrich-Alexander-Universität Erlangen-Nürnberg, Erlangen, Germany, 2Department of Neuroradiology, University Hospital Erlangen, Friedrich-Alexander-Universität Erlangen-Nürnberg, Erlangen, Germany, 3Siemens Healthcare GmbH, Erlangen, Germany, 4Max Planck Institute for Biological Cybernetics, Tuebingen, Germany, 5Institute of Medical Physics, Friedrich-Alexander-Universität Erlangen-Nürnberg, Erlangen, Germany
Synopsis
In Chemical Exchange Saturation Transfer MRI B1+-inhomogeneity influences both saturation and acquisition of the signal. Typically only a correction of the inhomogeneity of the CEST saturation is performed while the inhomogeneity of the readout is neglected. The influence of the readout was investigated in measurements using standard inhomogeneous 1Tx readout and a homogenized readout with customized pTx pulses. Compared to the 1Tx readout the readout with pTx pulses shows an increase of the homogeneity of the CEST contrast for CEST agents with low SNR like the amides and in regions with low 1Tx flip angle like the cerebellum.
Introduction
The CEST contrast strongly depends on the B1+ field inhomogeneity, which becomes prominent at ultra-high (B0 ≥ 7 Tesla) magnetic field strengths. Therefore, several techniques for correction or mitigation of the B1+ field inhomogeneity were developed1-4. However, most of these techniques concentrate only on the inhomogeneity of the CEST saturation while the inhomogeneity of the readout is neglected. A spatial variation of the readout flip angle (FA) leads to two effects in case of CEST acquisitions. On one hand it introduces a spatial variation of the SNR of the images; on the other hand it directly influences the measured CEST contrast. The latter effect is negligible if a saturation steady state is achieved. However, to approach clinically feasible scan times typically short recovery and saturation durations are chosen. Therefore the magnetization at one frequency offset depends on the previous excitations. This results in a change of the CEST spectra and contrasts with the FA.In this work, we investigate these influences of the readout inhomogeneity on the CEST contrast and verify the advantages of a homogenized readout with parallel transmission (pTx) over the single channel transmission readout (1Tx).
Methods
Data AcquisitionFor comparison of the 1Tx and the pTx readout, measurements of a healthy volunteer were performed on a 7-Tesla whole-body MR system (Magnetom Terra, Siemens Healthineers, Erlangen, Germany) with a 8Tx/32Rx head coil (Nova Medical, Wilmington, USA). The CEST images were acquired with a Snapshot-CEST sequence5 utilizing the MIMOSA approach1 to achieve a more homogenous saturation. For the pTx readout universal pulses with online customization based on a spiral nonselective k-space trajectory were used6, 7. The pTx pulse customization was performed based on pre-optimized trajectory, energy regularization, pulse shapes and individually acquired B1+ and B0 maps. For both readout types measurements with two different saturation B1 values were performed to allow for further correction of the saturation B1+ inhomogeneity. The CEST saturation parameters were: τp = 46.08 ms, τD = 30 ms, n = 50, Trec = 1 s, B1,Nominal = 0.72 µT and 1.08 µT, Gaussian pulse shape. Image acquisition for the 1Tx and the pTx approach was performed using a GRE readout with the following parameters: FA = 6°, TR = 3.4 ms, TE = 1.43 ms, matrix size = 92x92x72, FoV = 230x230x180 mm3, GRAPPA 3x2. B1+ maps for MIMOSA and the 1Tx mode were acquired using a pre-saturated 2D turbo-flash sequence8. Anatomical images were acquired using an in-house pTx-MPRAGE sequence with similar readout as the CEST pTx readout.
Data Analysis
All acquisitions were co-registered onto the anatomical acquisition. Segmentation into gray (GM) and white matter (WM) was performed on the anatomical images. Both, co-registration and segmentation, were performed using SPM 129. The influence of the saturation inhomogeneity on the CEST spectra was corrected with a two point B1+ correction approach2. The inverse magnetic transfer ratio metric (MTRRex) of the relayed Nuclear Overhauser Effect (rNOE), amide proton transfer (APT) and magnetization transfer (MT) were calculated utilizing a multi-Lorentzian fitting2. To investigate the dependency of the CEST contrast onto the FA, the CEST data was binned into equal sized (0.3°) bins of the 1Tx FA distribution and the mean and standard deviation of the data were computed. The binning was performed separately for the GM and WM segments.
Results and Discussion
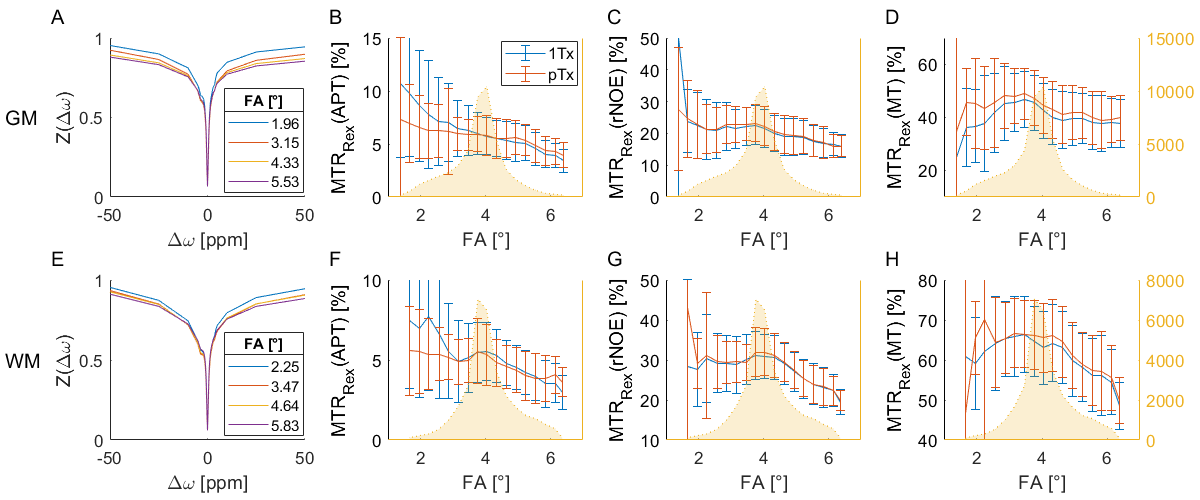
Comparing the CEST spectra for different FAs reveals that the signal intensity decreases with increasing FA (Fig. 1 A, E). Accordingly, one expects a decrease of the CEST contrast with the FA that is stronger for the 1Tx than for the pTx measurement (compare the FA distributions Fig. 2). This is mainly visible for the APT contrast in GM. For the other contrasts the effect appears to be small compared to other influences like spatial anatomical variations. The overestimation of the APT contrast for small FAs is linked to higher standard deviations probably caused by the lower SNR5.The advantage of the pTx readout can be depicted more clearly by analyzing the distributions of the CEST contrasts for GM and WM (Fig. 3). The pTx readout yields a narrower distribution of the CEST contrasts especially for the APT contrast. This indicates that B1+ readout influences were partially compensated. Considering the spatial distribution of the CEST contrasts (Fig. 4) one sees that the APT and rNOE contrasts in the cerebellum are overestimated for the 1Tx readout as has been reported before10. The pTx readout reduces this artefact.
Conclusion
The effect of an inhomogeneous readout FA on the CEST contrast is small compared to the effect of the saturation B1+. The CEST contrast for already B1+ corrected data though can be further improved by a homogenization of the readout by pTx. This is especially relevant for CEST agents producing only small contrasts like the amides and in regions with low 1Tx FA like the cerebellum.Acknowledgements
The financial support of the FAU Emerging Fields Initiative (MIRACLE, support to K.T., A.L. and A.M.N.) is gratefully acknowledged.References
- Liebert A, et al., Multiple interleaved mode saturation (MIMOSA) for B1 (+) inhomogeneity mitigation in chemical exchange saturation transfer. Magn Reson Med, 2019. 82(2): p. 693-705.
- Windschuh J, et al., Correction of B1-inhomogeneities for relaxation-compensated CEST imaging at 7 T. NMR Biomed, 2015. 28(5): p. 529-37.
- Khlebnikov V, et al., On the transmit field inhomogeneity correction of relaxation-compensated amide and NOE CEST effects at 7 T. NMR Biomed, 2017. 30(5): p. e3687.
- Tse DHY, et al., B1+ inhomogeneity mitigation in CEST using parallel transmission. Magn Reson Med, 2017. 78(6): p. 2216-2225.
- Zaiss M, Ehses P and Scheffler K, Snapshot-CEST: Optimizing spiral-centric-reordered gradient echo acquisition for fast and robust 3D CEST MRI at 9.4 T. NMR Biomed, 2018. 31(4): p. e3879.
- Malik SJ, et al., Tailored excitation in 3D with spiral nonselective (SPINS) RF pulses. Magn Reson Med, 2012. 67(5): p. 1303-15.
- Gras V, et al., Homogeneous non-selective and slice-selective parallel-transmit excitations at 7 Tesla with universal pulses: A validation study on two commercial RF coils. PLoS One, 2017. 12(8): p. e0183562.
- Fautz H-P, et al., B1 mapping of coil arrays for parallel transmission. in Proceedings of the 16th Annual Meeting of ISMRM. 2008. Toronto, Canada.
- Penny WD, et al., Statistical parametric mapping: the analysis of functional brain images. 2011: Elsevier.
- Akbey S, et al., Whole-brain snapshot CEST imaging at 7 T using 3D-EPI. Magn Reson Med, 2019. 82(5): p. 1741-1752.
Figures
Figure
1 Measured CEST spectra (1Tx readout) for GM (A)
and WM (E) with varying readout FA (1Tx) and the resulting CEST contrasts MTRRex(APT)
(B, F), MTRRex(rNOE) (C, G) and MTRRex(MT) (D, E) for the
1Tx and pTx readout. The yellow curves show the histogram of the 1Tx FA
distribution. The signal intensity of the CEST spectra decreases with
increasing FA.
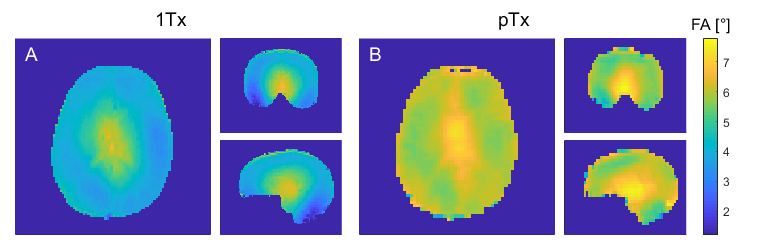
Figure 2 Flip angle distributions of the 1Tx (A) and pTx
readout (B). The pTx FA distribution is much closer to the nominal FA of 6°
than the 1Tx distribution.
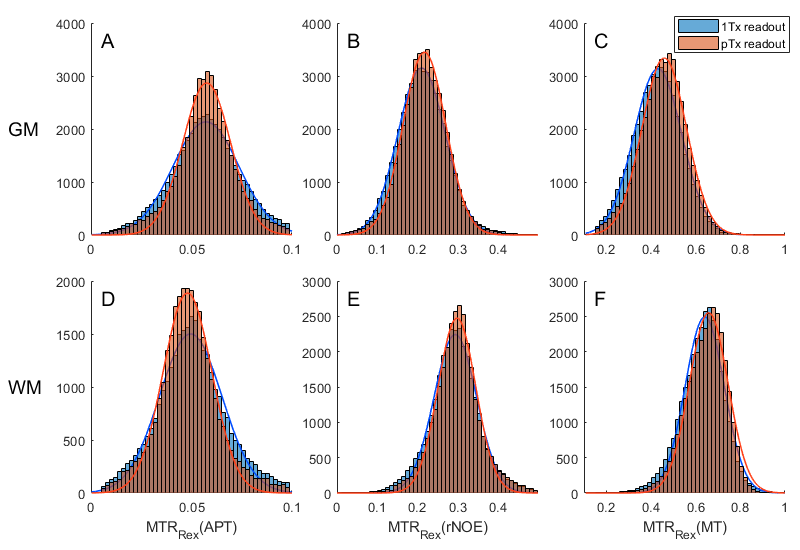
Figure 3 Distribution of the
MTRRex(APT), MTRRex(rNOE ) and MTRRex(MT)
contrasts for 1Tx and pTx readout over the whole brain volume separated for GM (A-C)
and WM (D-F).
The pTx readout leads to a
narrower distribution especially for the APT contrast.
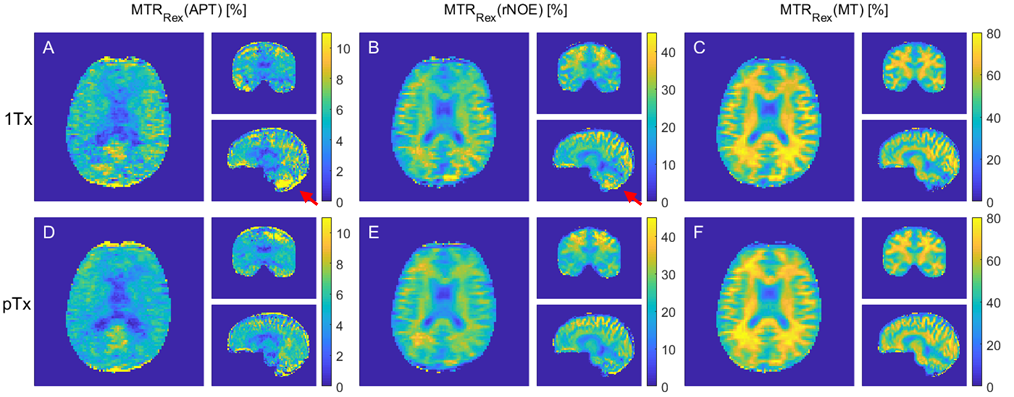
Figure 4 MTRRex(APT),
MTRRex(rNOE ) and MTRRex(MT)
maps for the 1Tx (A-C) and
pTx readout (D-F). The 1Tx readout shows an overestimation of the APT and rNOE
contrast in the cerebellum (red arrows).