3089
Real-time motion and retrospective receiver sensitivity correction for gluCEST using volumetric navigators (vNavs) at 7T1High Field MR Centre, Biomedical Imaging and Image-guided Therapy, Medical University of Vienna, Vienna, Austria, 2Department of Physics, University of Helsinky, Helsinki, Finland, 3Siemens Healthineers, Sydney, Australia, 4Harvard Medical School, Boston, MA, United States
Synopsis
CEST is susceptible to subject motion not only due to misregistration of MR images acquired over time and subsequent alterations of B0 field, but also due to the related receiver sensitivity (B1-) inhomogeneities. We propose to correct for ∆B1- from the images generated by an interleaved EPI navigator used for prospective motion correction. We show the benefit of the proposed method, in combination with B1+ and dynamic B0 corrections, to restore a glutamate weighted CEST map in an active healthy volunteer.
Introduction
Chemical Exchange Saturation Transfer (CEST) MRI is a contrast mechanism that allows the detection of small amounts of metabolites with enhanced sensitivity including glutamate, the main excitatory neurotransmitter in the human brain (1). However small movements, field artifacts and can lead to Z spectra alterations that complicate the CEST quantification (2). We propose to incorporate a retrospective receiver sensitivity (B1-) correction step to avoid distortions arising from subject movement closer or further away from the coil elements.Methods
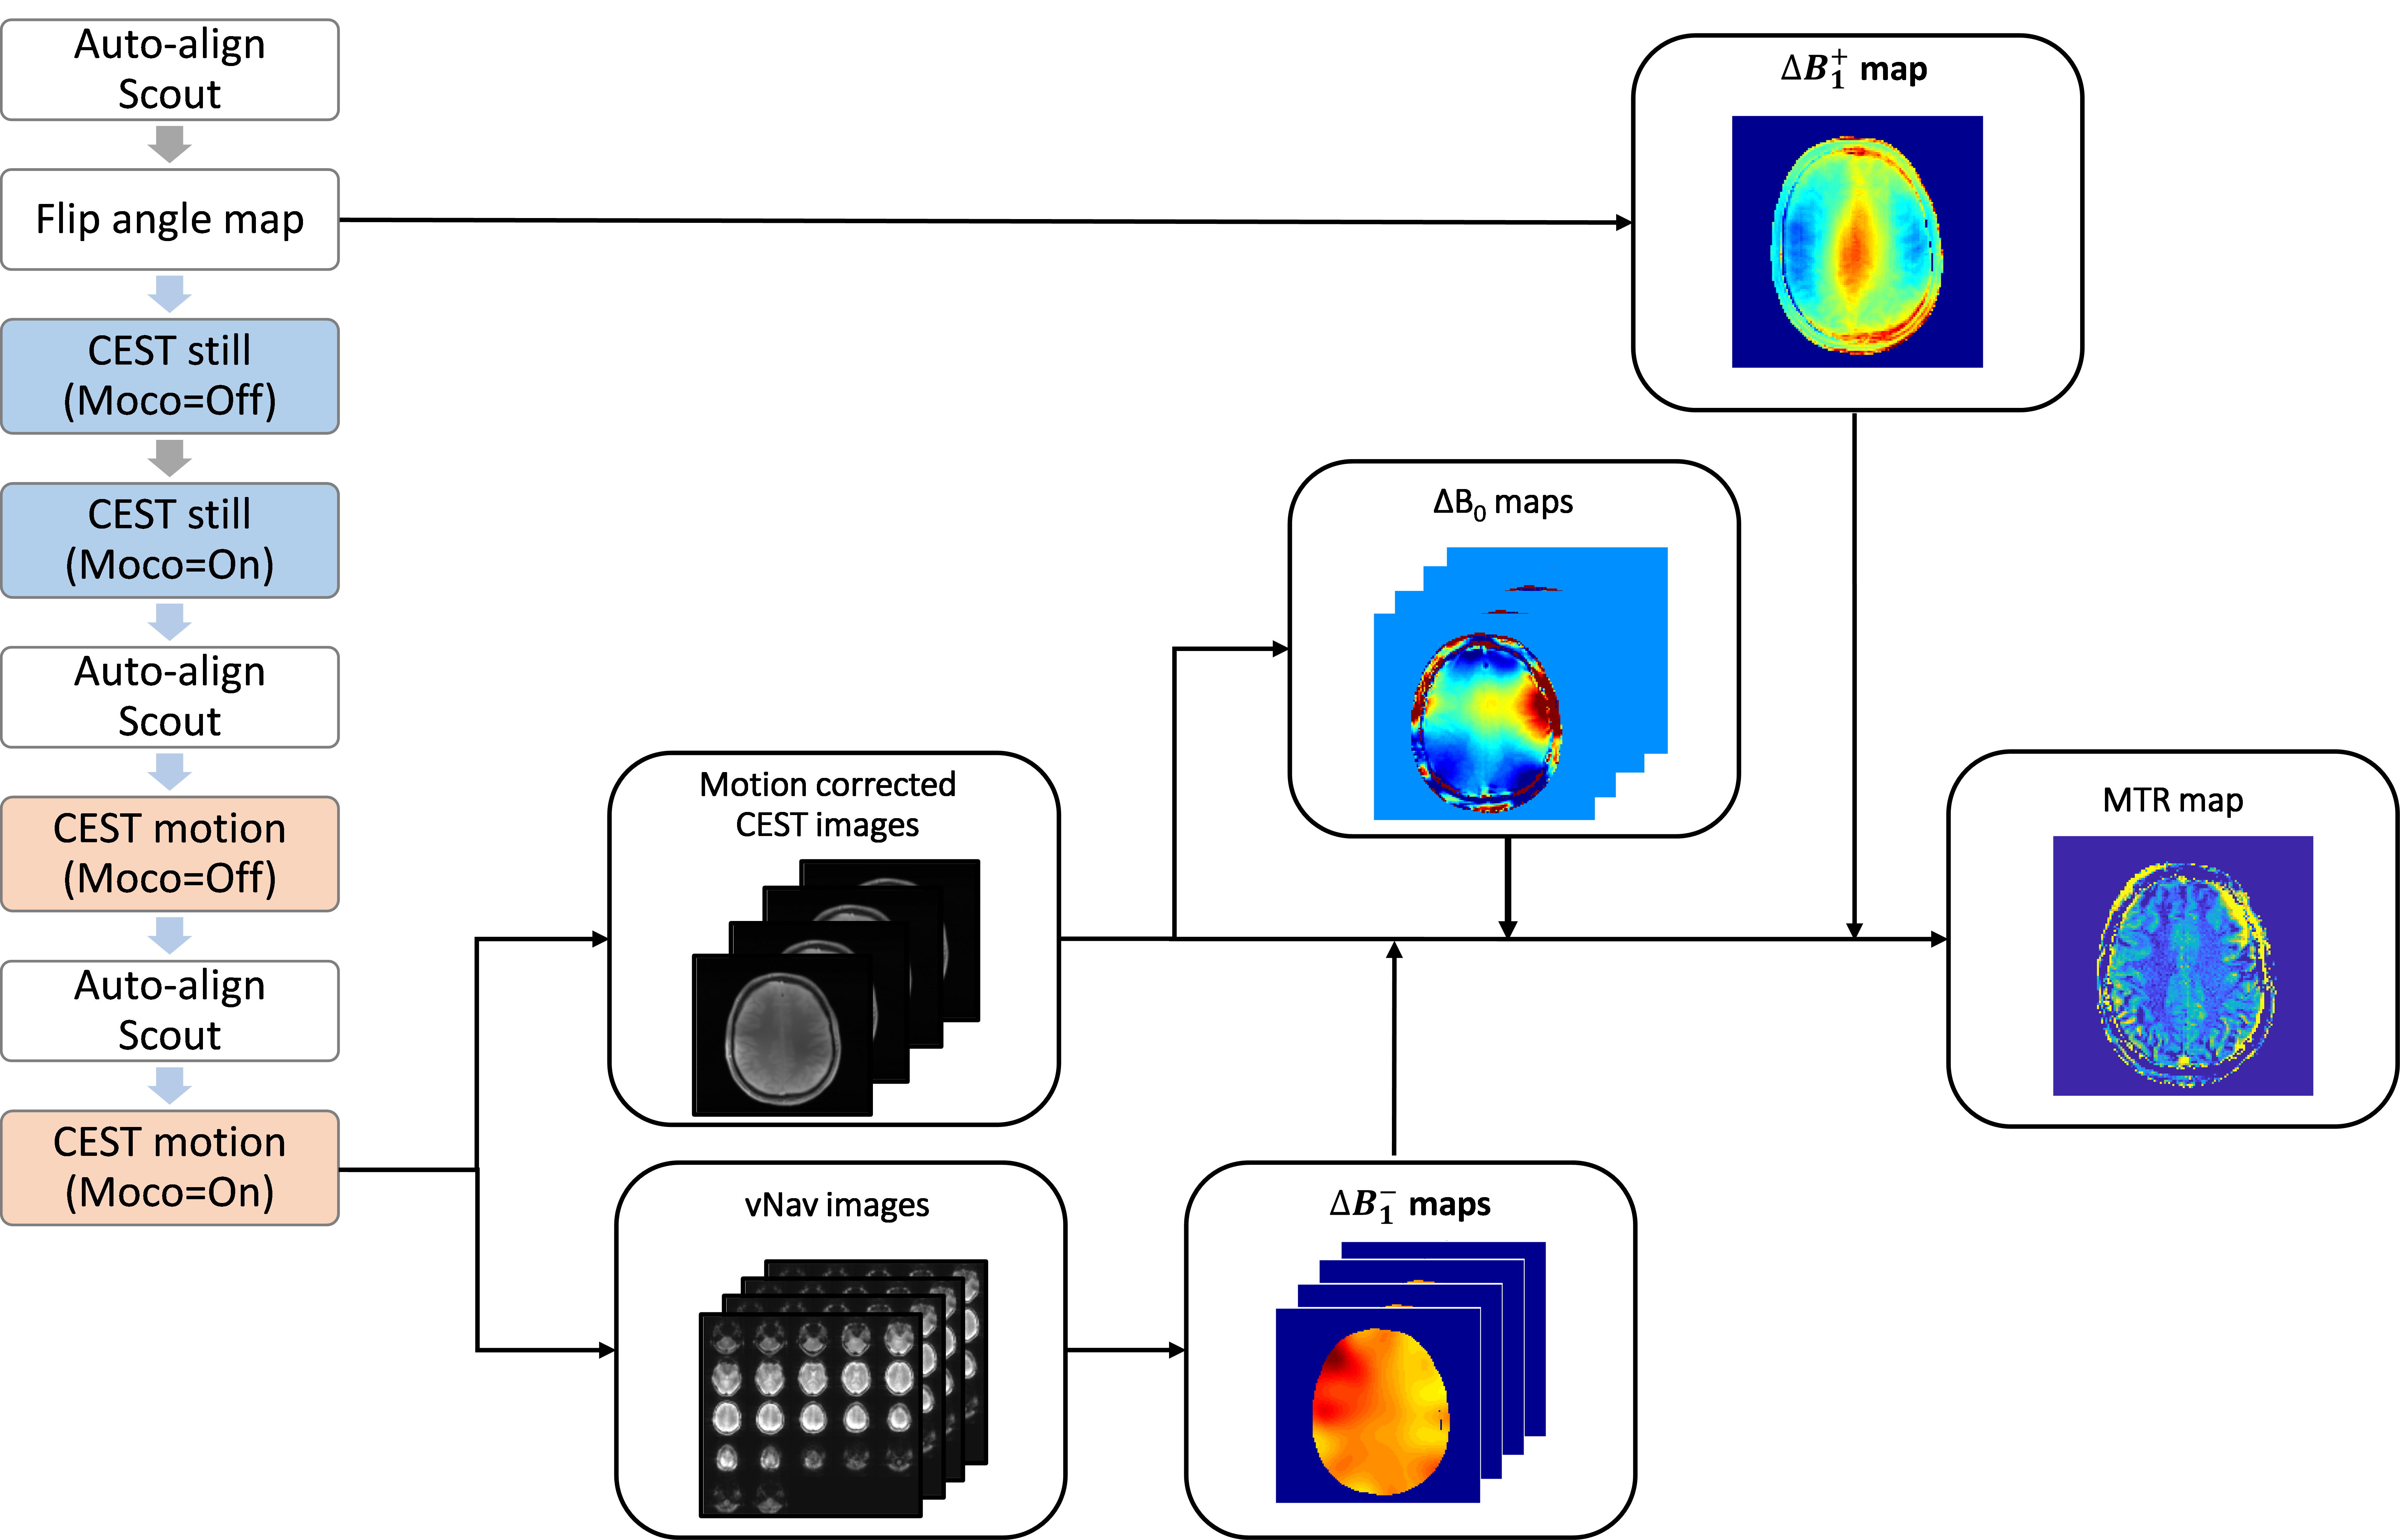
A 2D Turbo-Flash CEST acquisition optimized to be corrected intrinsically for B0 inhomogeneities was interleaved with a volumetric EPI navigator (vNav) (3). The navigator images were used for both, real-time motion correction and to map B1- fluctuations over time (Figure 1). The B1- correction was done retrospectively by normalizing each navigator image acquired prior each CEST offset acquisition with the first navigator of the sequence. This relative maps was subsequently smoothed, masked, extrapolated and resized to match the slice location of the CEST images (4). B0 inhomogeneities were corrected based on the CEST images by the dynamic method CEST‐GRE‐2TE (3). B1+ correction was based on Z-B1-correction (5) where a pre acquired a flip angle map is used to correct each CEST image.The imaging workflow (Figure 1) consisted on a Flip angle 2D Turbo-FLASH-based flip angle pre-scan necessary for B1+ correction, followed by four CEST measurements. In the first two a healthy volunteer was asked to remain still with and without real-time motion correction respectively, and the last two he was instructed to rotate the head 6 times again with/without enabling motion correction. The rotations were performed during the 8s long pauses placed between the acquisition of each CEST offset to allow for T1 relaxation. MTR asymmetry maps were calculated in the range between 2.75-3.25 ppm and normalized by M0 acquired at -100 ppm.
The study was performed on a whole-body 7T MR system (Magnetom, Siemens) with a 1H 32-channel head coil (Nova Medical) after informed written consent was obtained. Image processing, coil combination, B0/B1-/B1+ maps calculation were conducted in MATLAB (MathWorks). B0/B1-/B1+ corrections and asymmetric magnetic transfer ratio (MTRasym) analysis were performed voxel wise. The 3D vNavs had a resolution of 7x7x7 mm3 and the CEST sequences 1.75x1.75x5.0mm. GRE readout TR/TE1/TE2=9.5/1.74/5.16 ms and measurement TR=11s. The CEST saturation consisted on 3 Gaussian pulses with tp=100ms, td=12ms and amplitude 5.6uT applied at 34 frequencies alternating from ±4 down to 0 ppm.
Results:
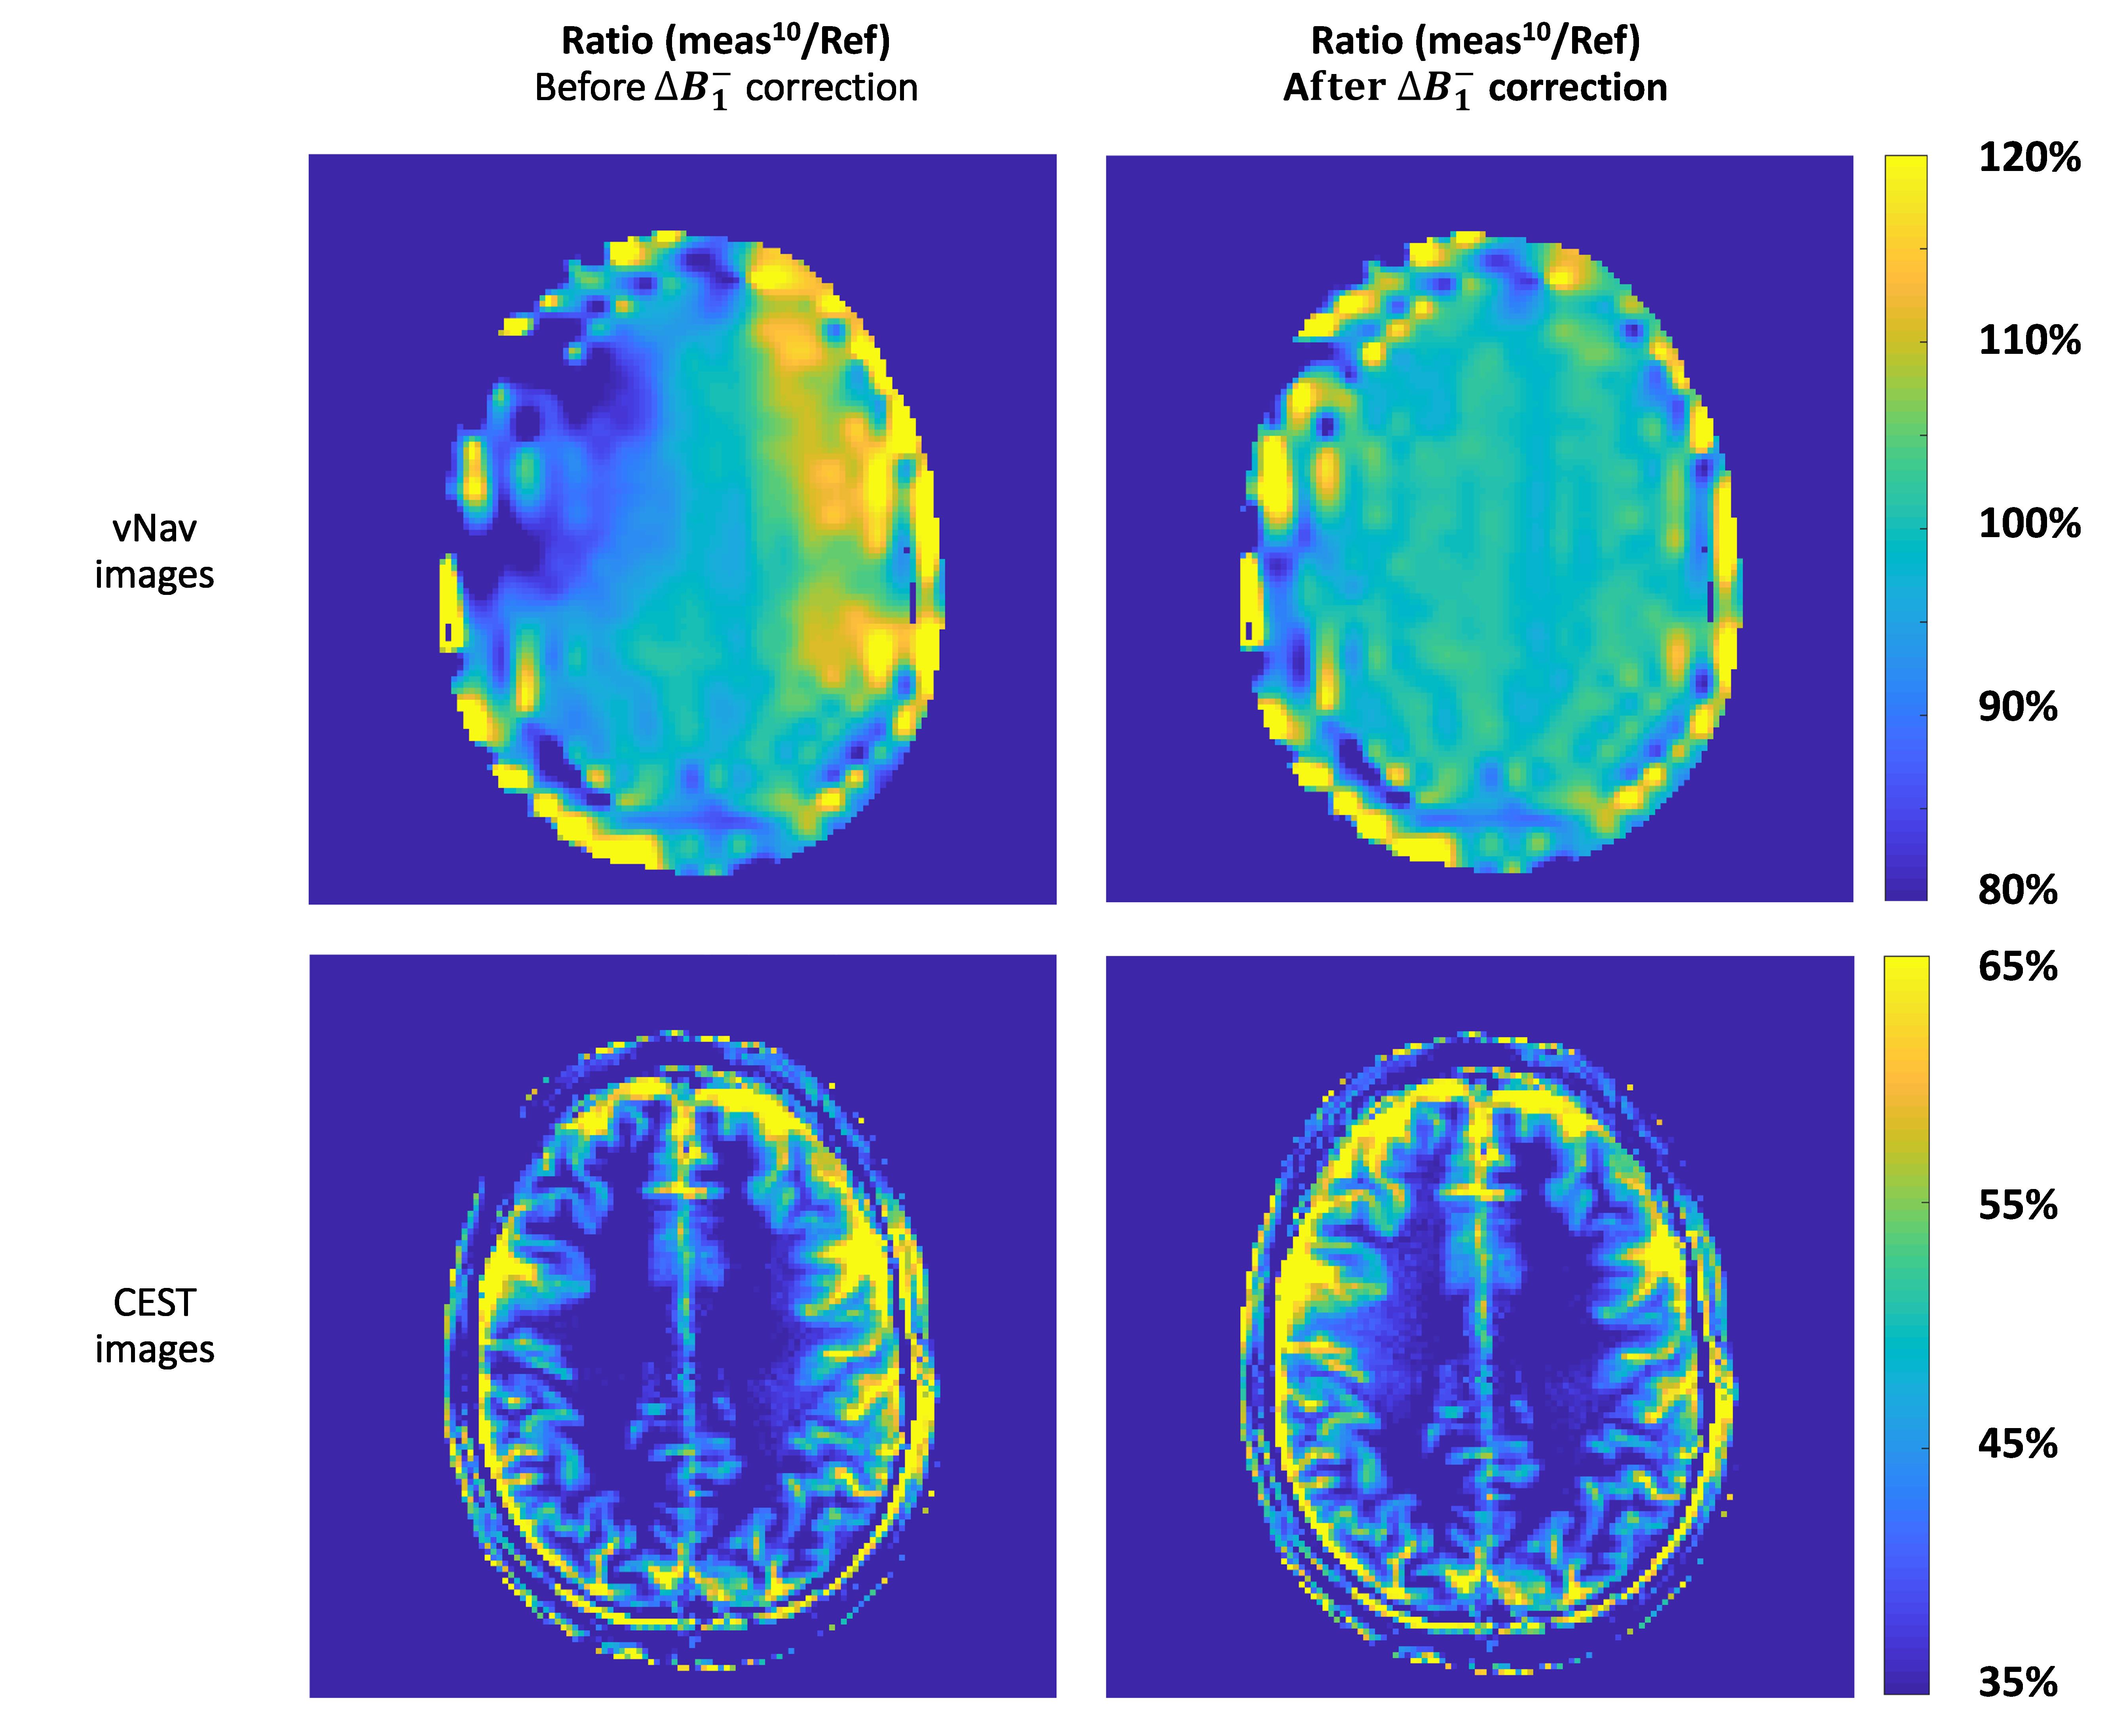
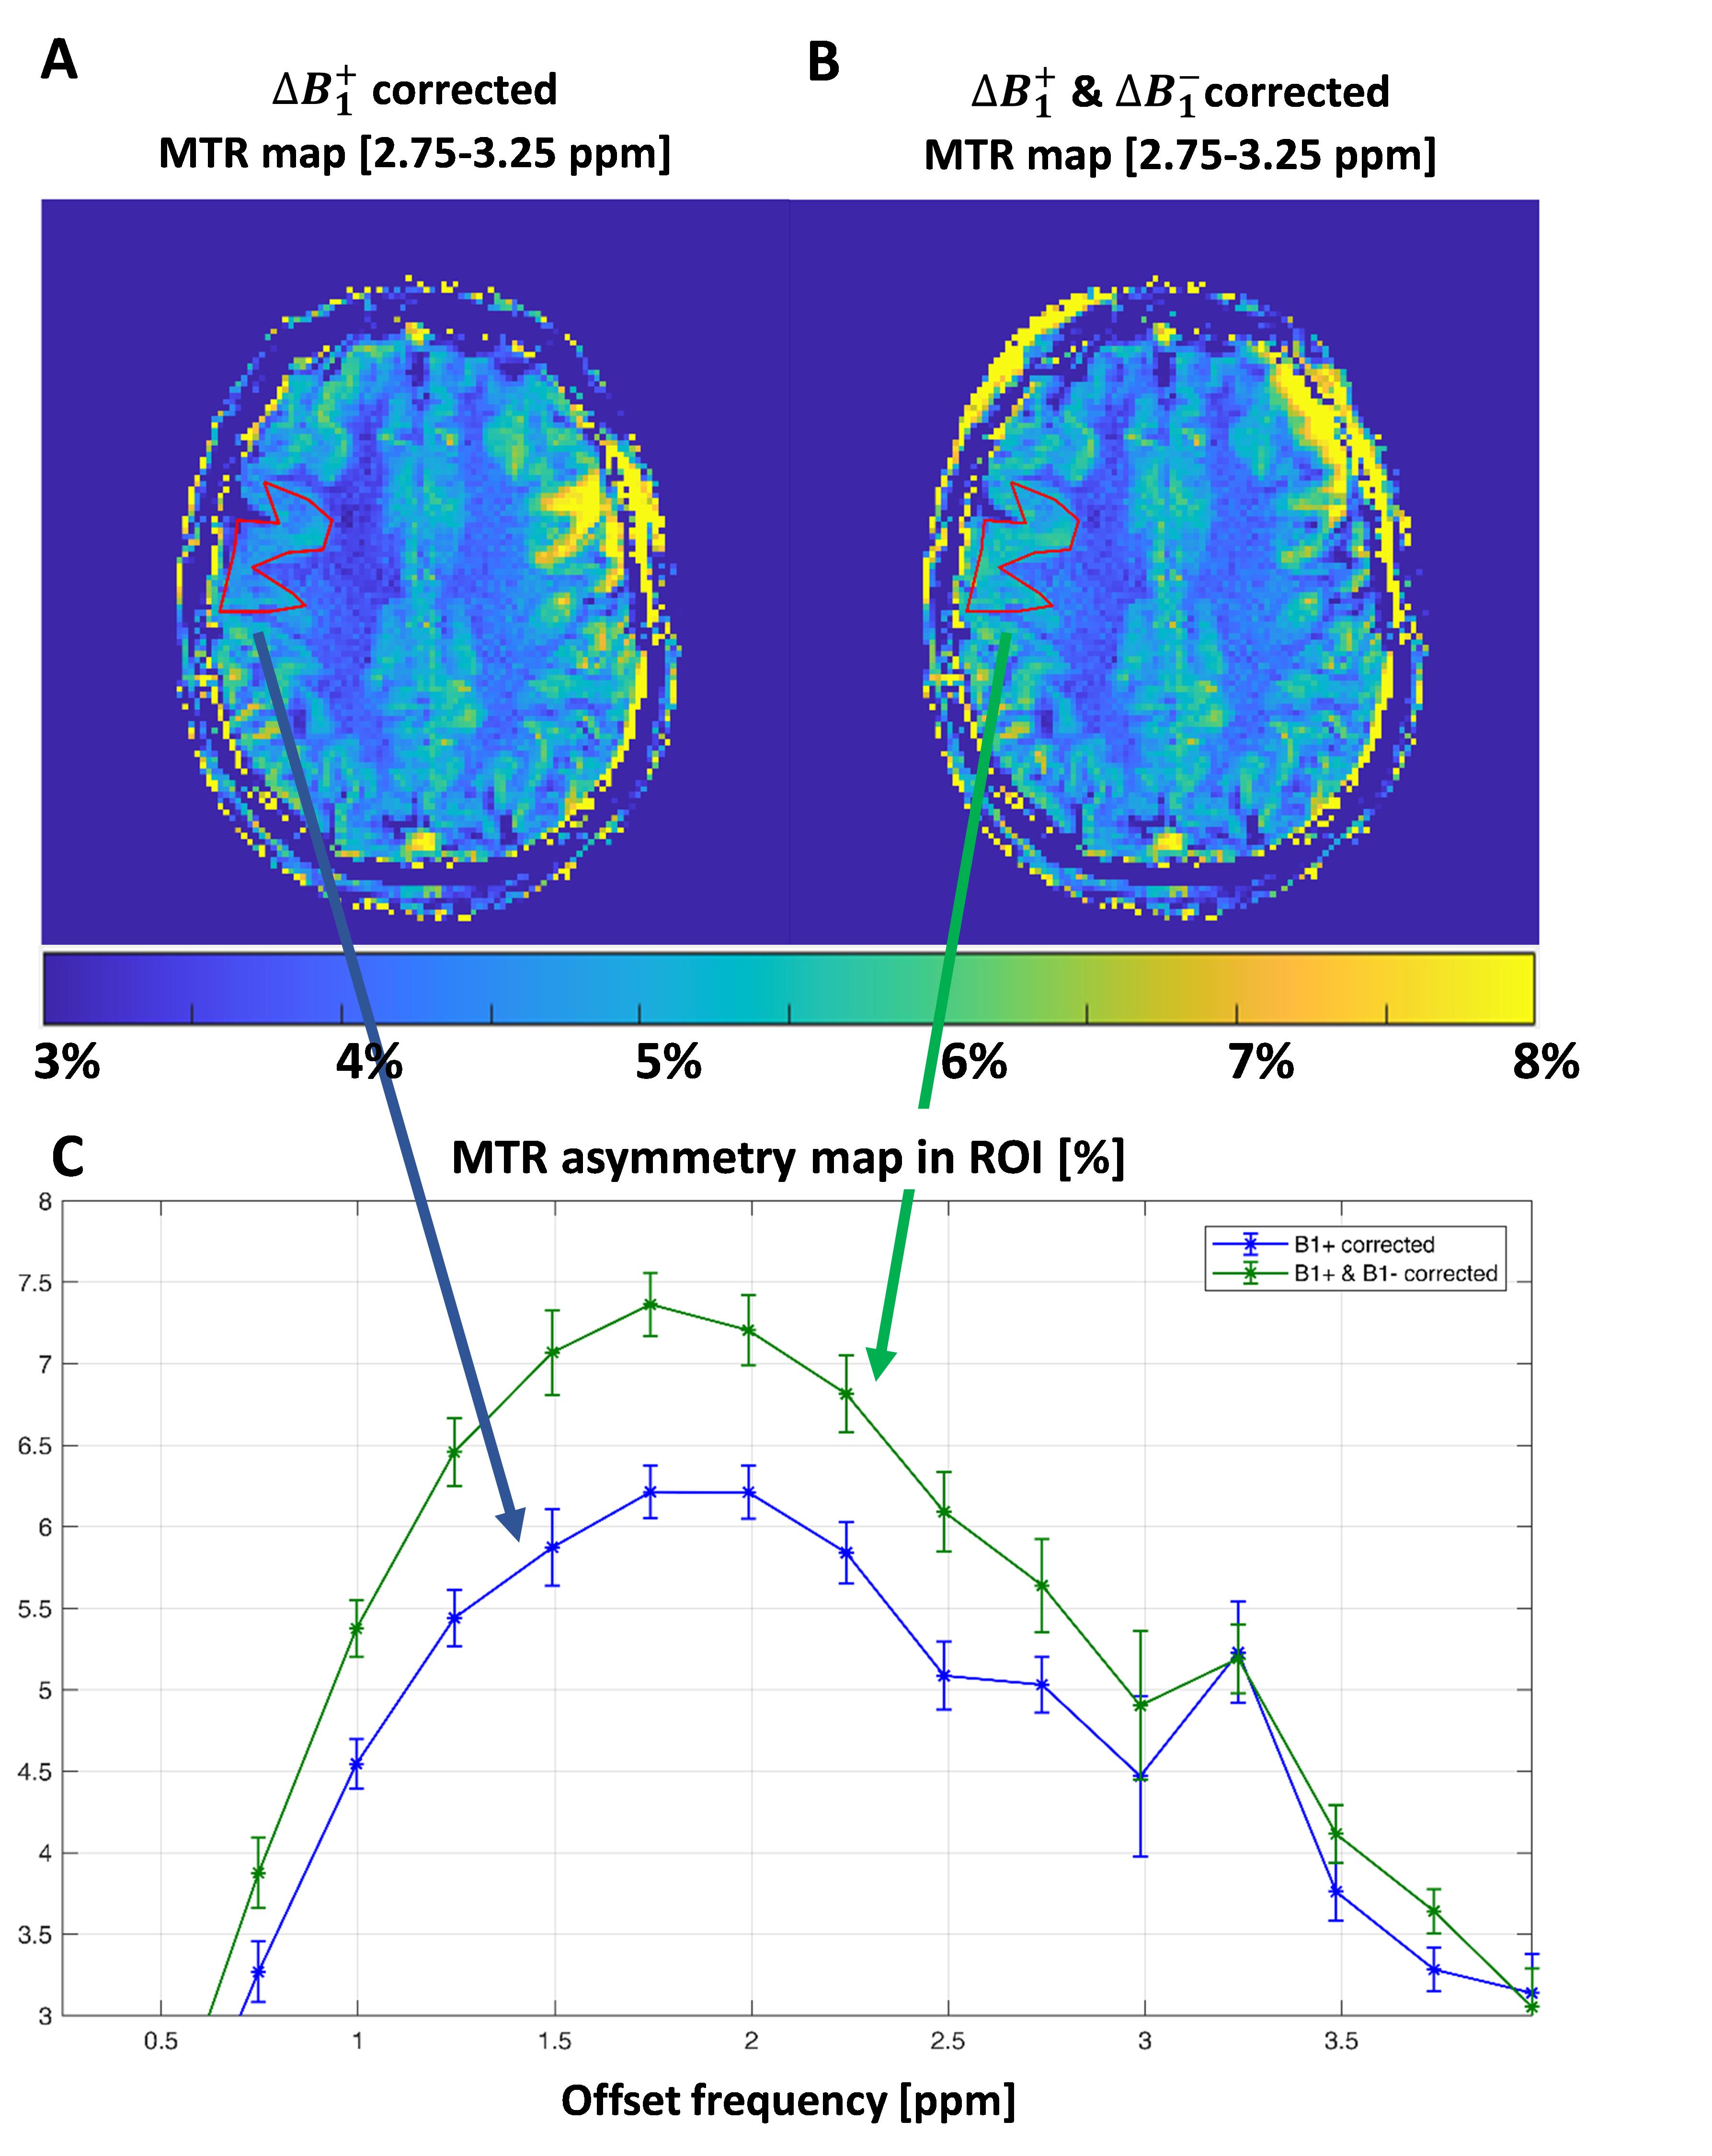
The navigator based motion correction was able to correct accumulated head rotations up to 7º with minimal residual pseduo CEST effects due to remaining misregistrations (Fig. 2). The efficaccy of the retrospective dynamic B1- correction is demonstrated for the vNav images with values ~100% with respect to the reference prior to movement (Fig 3) and applied to the CEST images (Fig 4). In the most severly affected frequencies, for CEST weighted images of metabolites resonating ~2 ppm (creatine), the current correction of a pseudo CEST effect of in the selected ROI of 1% would have reached to 2%.Discussion and Conclusion:
The real-time motion correction based on vNavs is able to substantially reduce rotations up to 7º, however remaining misregistration may be reduced by acquiring 3D CEST data. Receiver sensitivity correction based on vNavs data is able to correct hyper/hypo intensities on the MTR maps within the brain, there is still space for improvement in areas close tho the borther of the brain. This is explained because the navigator images show some misregistration among the CEST acquisition.Retrospective B1- correction is a viable method, sinergic with the use of vNav for prospective motion correction that significantly reduce motion related artifacts in CEST MRI. In combination with B0 and B1+ corrections provide the opportunity to aply this technique with motion prone patients.
Acknowledgements
No acknowledgement found.References
1. Cai K, Singh A, Roalf DR, Nanga RPR, Haris M, Hariharan H, Gur R, Reddy R. 2013. Mapping glutamate in subcortical brain structures using high-resolution glucest mri. NMR in biomedicine. 26(10):1278-1284.
2. Zaiss M, Herz K, Deshmane A, Kim M, Golay X, Lindig T, Bender B, Ernemann U, Scheffler K. 2019. Possible artifacts in dynamic cest mri due to motion and field alterations. J Magn Reson. 298:16-22.
3. Poblador Rodriguez E, Moser P, Dymerska B, Robinson S, Schmitt B, van der Kouwe A, Gruber S, Trattnig S, Bogner W. 2019. A comparison of static and dynamic b0 mapping methods for correction of cest mri in the presence of temporal b0 field variations. Magn Reson Med. 82(2):633-646.
4. Auno S, Poblador Rodriguez E, Moser P, v.d.Kouwe A, Gruber S,Trattnig S, Bogner W. Real-time motion and dynamic transmit/receive B1 correction of CEST in the human brain at 7T [Abstract]. In ISMRM 26th Annual Meeting & Exhibition: 2018 abstract nr 0661
5. Windschuh J, Zaiss M, Meissner JE, Paech D, Radbruch A, Ladd ME, Bachert P. 2015. Correction of b1-inhomogeneities for relaxation-compensated cest imaging at 7 t. NMR in biomedicine. 28(5):529-537.
Figures