3088
Volumetric CEST May Provide Insight into Clinical Neuroprotection Stratification in Sub-Acute Ischaemic Stroke1Wellcome Centre for Integrative Neuroimaging, University of Oxford, Oxford, United Kingdom, 2Acute Vascular Imaging Centre, Radcliffe Department of Medicine, University of Oxford, Oxford, United Kingdom, 3Institute of Biomedical Engineering, Department of Engineering Science, University of Oxford, Oxford, United Kingdom
Synopsis
Understanding the contributions of secondary injury following ischaemic stroke is critical for developing post-stroke neuroprotective strategies. Nuclear Overhauser effect (NOE) CEST and MT are techniques sensitive to aliphatic compounds and macromolecules, respectively, and which may point to intracellular microstructural integrity post-ischaemia, potentially helping stratification of patients for further treatment. We show that rapid 3D volumetric measurements at clinical MRI strength in patients demonstrate significant reductions in relative NOE ratio and MT exchange rate, both within conventionally defined areas of infarction using ADC, and in areas in which ADC is insensitive (infarct growth). Further work is required to confirm this observation.
Purpose
Stroke is one of the leading causes of death and disability worldwide. However, treatment options are limited with no proven effective treatments for protecting tissue at risk from secondary injury1 other than vessel recanalization, either mechanically or with tissue plasminogen activator. Current imaging methods are limited in facilitating our understanding of the dominant mechanisms of secondary injury, thus, finding a method to enable this is an important step towards developing new treatments that may be clinically effective.Chemical exchange saturation transfer (CEST) is an MRI technique sensitive to the presence of low-concentration solute protons exchanging with water. Nuclear Overhauser effect-relayed (NOE) exchange is a type of CEST contrast sensitive to aliphatic compounds2, and which has been shown to be sensitive to ischaemic stroke in rats3 and humans4. Magnetization Transfer (MT) is another type of biophysical exchange process sensitive to large macromolecules5,6, which has shown some sensitivity to stroke7. However, no methods have been developed for a rapid, 3D, clinically utilisable sequence sensitive to quantitative estimates of NOE and MT, limiting the applicability of CEST as a clinical tool. Here, we demonstrate a rapid, quantitative, 3D sequence sensitive to both NOE and MT effects, and further, show that combining NOE-mediated CEST and MT may highlight areas at risk of secondary injury.
Methods
Acquisitions: Five patients with sub-acute ischaemic stroke (age: 66±15, all male; time between onset and scan: 15.6±6.5 hours) were imaged on a 3T Siemens Verio MRI scanner (Erlangen, Germany) with approval from the National UK Research Ethics Committee. The CEST acquisition consisted of a CEST pulse train with a 3D centre-out FLASH readout8 (FOV=220x220x50-mm3, 3.44x3.44x5-mm3). The CEST preparation consisted of a train of fifty 20-ms pulses, FA=184°, 50% duty cycle; 32 frequency offsets sampled asymmetrically between ±5-ppm to sample the -3.5-ppm NOE resonance, avoiding the +3.5-ppm amide resonance to reduce model estimation bias. Additional offsets at 7.5, 15, 30, 60, and 100-ppm were acquired to sample the magnetisation transfer (MT) spectrum with FAs=[184˚, 540°]. T1 and B1+ maps were also collected, with the Variable Flip Angle9, and DREAM10 sequences, respectively. The total time for the CEST, T1, and B1+ acquisitions was ≈5 minutes.Image Analysis: NOE effect size at -3.5-ppm was quantified using the NOER* (i.e. the MT ratio asymmetry in an ideal two-pool model11) metric, and the MT effect was quantified using the macromolecular-to-water-pool-size ratio (PSR) and the macromolecular-to-water exchange rate (kmf) from a Bayesian model-based analysis11,12, assuming 3 pools (water, NOE(-3.5 ppm), MT), and using voxel-wise T1 values and B1+ values for correction. Regions of Interest (ROIs) representing the initial ischaemic core and final infarct were drawn by trained clinicians (DC, JG) using the images acquired at presentation (apparent diffusion coefficient or ADC) and at the patients’ 1-week follow-up (FLAIR image), respectively. Infarct growth was calculated by subtracting the infarct at 1 week (registered to presenting scans) from the infarct at presentation. Equivalent contralateral ROIs were also calculated using FSL to mirror the infarct ROIs in standard space13, and relative (infarct/contralateral) values were calculated to remove biases between patients. Cerebral spinal fluid was removed from all ROIs using FAST14. A random effects model15 was used to calculate voxel-weighted group mean and standard deviations, and 95% confidence intervals were calculated to test for significance.
Results
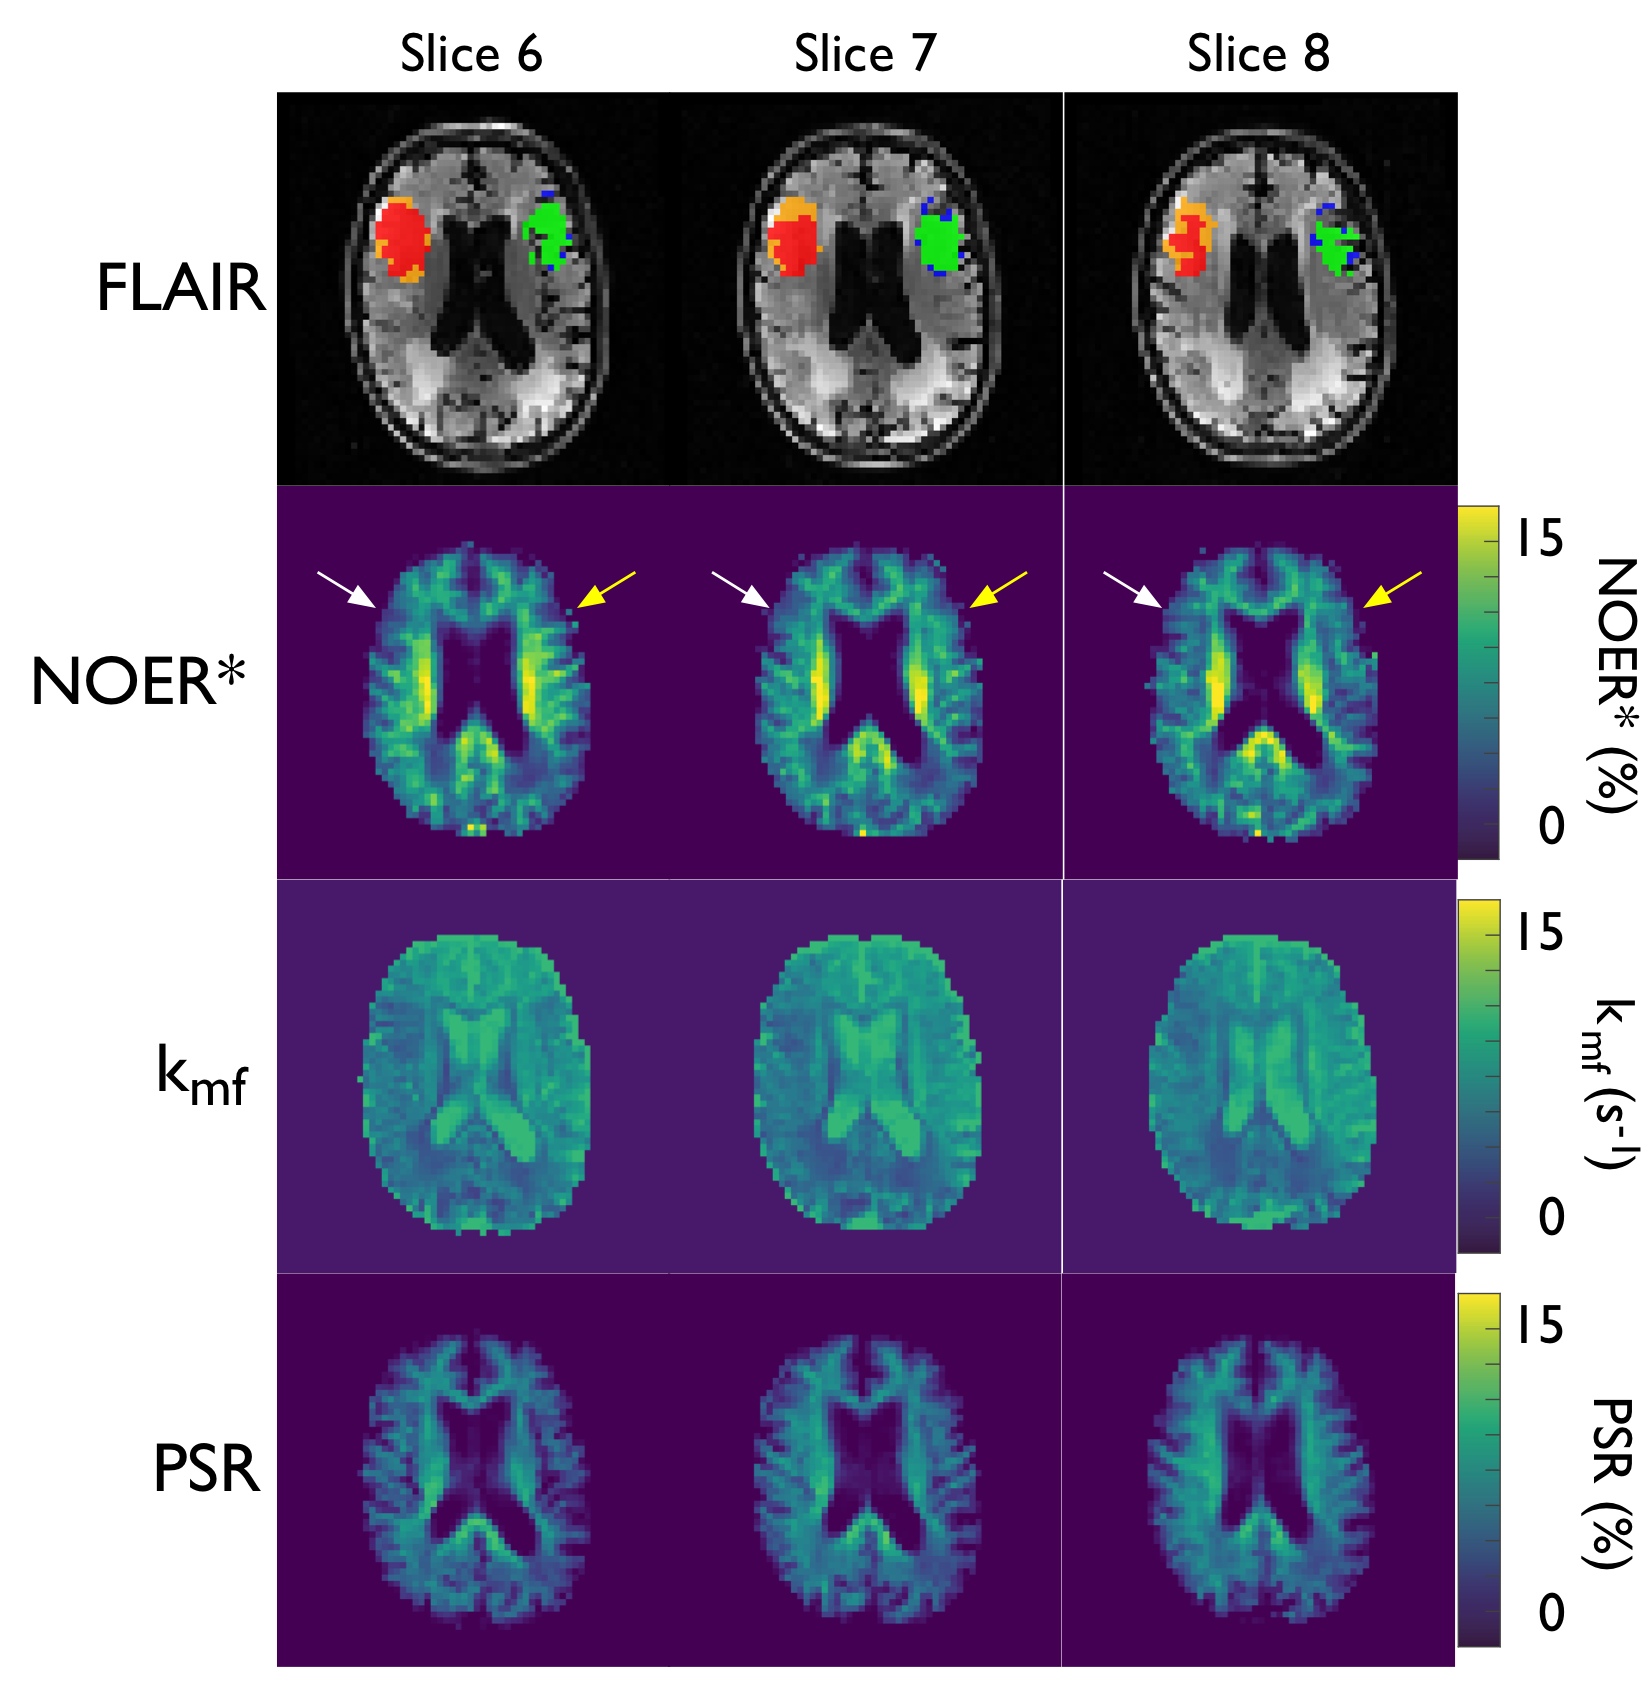
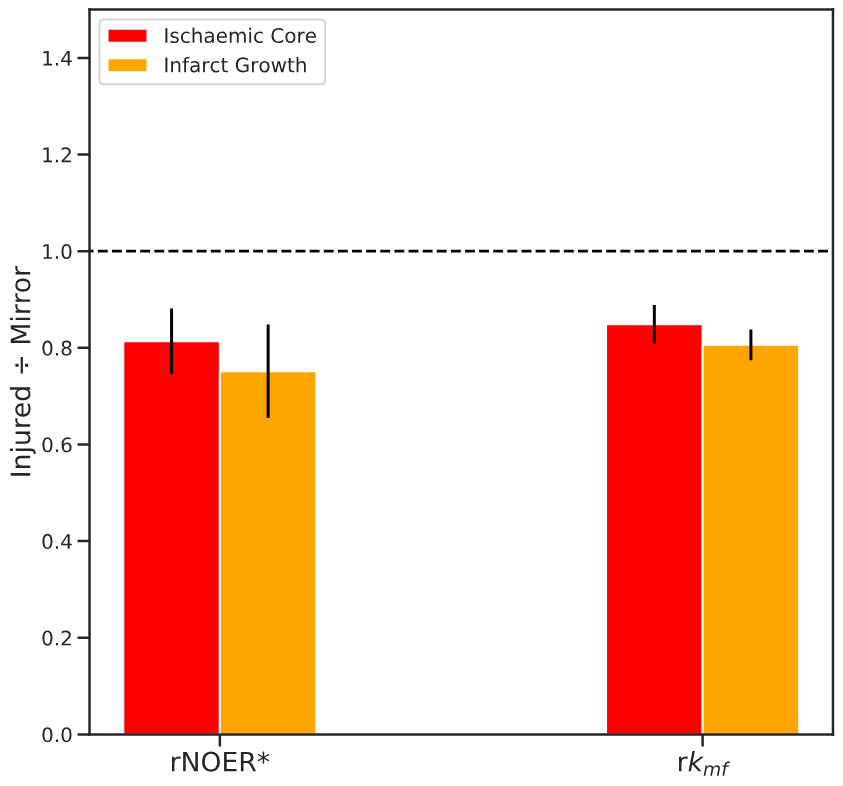
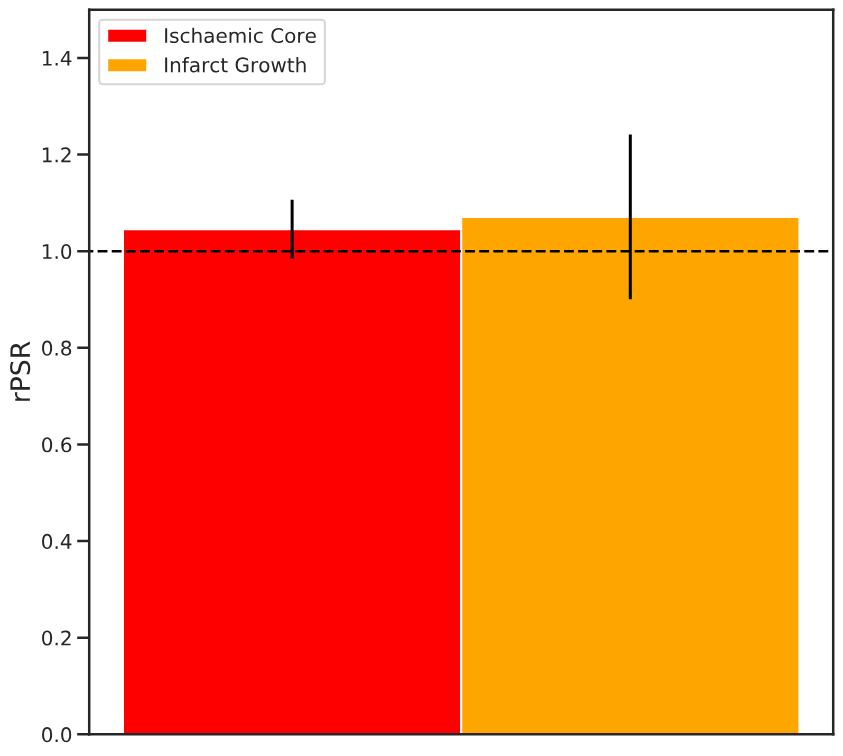
Figure 1 displays the 1-week FLAIR, NOER*, kmf, and PSR images with ROIs defining the ischaemic core and infarct growth for a typical patient. The FLAIR image shows the infarct-affected area of the brain, which is reflected in lowered NOER* and kmf in the ischaemic core and infarct growth relative to the contralateral tissue. Figure 2 shows mean±SD the relative NOER* (rNOER*) and kmf (rkmf) over all of the ROIs: both the rNOER* and rkmf are reduced in the ischaemic core ([0.68,0.95], [0.77,0.93], respectively) and infarct growth ([0.56,0.95], [0.74,0.87], respectively) relative to the corresponding mirror region. Figure 3 displays the relative PSR (rPSR). No significant differences are shown for the rPSR (ischaemic core: [0.93,1.17], infarct growth: [0.73,1.41]).Discussion
The observed decrease in NOER* may be indicative of the decreased ability of aliphatic molecules to exchange with the water pool. Stroke-induced ischaemia is accompanied by the breakdown of many biological processes, however, the sub-acute decrease in NOER* may indicate areas where there is disruption in normal cellular processes. This is further suggested by the decrease in kmf (with no change in PSR), which indicates a reduction in the amount of free water available for exchange with semisolid tissues. These changes in the microstructural environment may be an indicator of additional tissue at risk that is outside the core infarct areas clinically defined via the ADC at presentation.Conclusion
These results demonstrate that sub-acute measurements of kmf and NOER* may provide a non-invasive method to identify areas at risk of secondary injury. Importantly, these estimates may help stratify patients for neuroprotection trials and provide a target for the development of new treatments. Future work includes confirming these findings in a larger cohort of patients.Acknowledgements
Funding provided by: Whitaker International Program Fellowship, and St. Hilda’s College Junior Research Fellowship. The Wellcome Centre for Integrative Neuroimaging is supported by core funding from the Wellcome Trust (203139/Z/16/Z). Support of the NIHR Oxford Biomedical Research Centre and the Dunhill Medical Trust is also gratefully acknowledged.
References
1. Rocha M, Jovin TG. Fast Versus Slow Progressors of Infarct Growth in Large Vessel Occlusion Stroke. Stroke. 2017;48(9):2621-2627. doi:10.1161/STROKEAHA.117.017673
2. van Zijl PCM, Lam WW, Xu J, Knutsson L, Stanisz GJ. Magnetization Transfer Contrast and Chemical Exchange Saturation Transfer MRI. Features and analysis of the field-dependent saturation spectrum. Neuroimage. 2018;168:222-241. doi:10.1016/j.neuroimage.2017.04.045
3. Li H, Zu Z, Zaiss M, et al. Imaging of amide proton transfer and nuclear Overhauser enhancement in ischemic stroke with corrections for competing effects. NMR Biomed. 2015;28(2):200-209. doi:10.1002/nbm.3243
4. Tee YK, Harston GWJ, Blockley N, et al. Can Nuclear Overhauser Enhancement Mediated Chemical Exchange Saturation Transfer (NOE-CEST) Offer a New Insight in Acute Stroke Diagnosis? In: Proceedings of the Annual Meeting of the ISMRM2. ; 2015.
5. Ceckler TL, Wolff SD, Yip V, Simon SA, Balaban RS. Dynamic and chemical factors affecting water proton relaxation by macromolecules. J Magn Reson. 1992;98(3):637-645. doi:10.1016/0022-2364(92)90018-3
6. Wolff SD, Balaban RS. Magnetization transfer contrast (MTC) and tissue water proton relaxation in vivo. Magn Reson Med. 1989;10(1):135-144. doi:10.1002/mrm.1910100113
7. Sagnier S, Sibon I. The new insights into human brain imaging after stroke. J Neurosci Res. September 2019:jnr.24525. doi:10.1002/jnr.24525
8. Zaiss M, Ehses P, Scheffler K. Snapshot-CEST: Optimizing spiral-centric-reordered gradient echo acquisition for fast and robust 3D CEST MRI at 9.4 T. NMR Biomed. 2018;31(4). doi:10.1002/nbm.3879
9. Wang HZ, Riederer SJ, Lee JN. Optimizing the precision in T1 relaxation estimation using limited flip angles. Magn Reson Med. 1987;5(5):399-416. doi:10.1002/MRM.1910050502
10. Ehses P, Brenner D, Stirnberg R, Pracht ED, Stöcker T. Whole‐brain B 1 ‐mapping using three‐dimensional DREAM. Magn Reson Med. April 2019:mrm.27773. doi:10.1002/mrm.27773
11. Chappell MA, Donahue MJ, Tee YK, et al. Quantitative Bayesian model-based analysis of amide proton transfer MRI. Magn Reson Med. 2013;70(2):556-567. doi:10.1002/mrm.24474
12. Smith AK, Ray KJ, Larkin JR, Craig M, Smith SA, Chappell MA. Does the MT Effect Bias CEST Effects? Quantifying CEST in the Presence of MT. In: Proceedings of the Annual Meeting of the ISMRM. Montreal, Canada; 2019.
13. Jenkinson M, Beckmann CF, Behrens TEJ, Woolrich MW, Smith SM. Fsl. Neuroimage. 2012;62(2):782-790. doi:10.1016/j.neuroimage.2011.09.015
14. Zhang Y, Brady M, Smith S. Segmentation of brain MR images through a hidden Markov random field model and the expectation-maximization algorithm. IEEE Trans Med Imaging. 2001;20(1):45-57. doi:10.1109/42.906424
15. Borenstein M, Hedges L V., Higgins JPT, Rothstein HR. A basic introduction to fixed-effect and random-effects models for meta-analysis. Res Synth Methods. 2010;1(2):97-111. doi:10.1002/jrsm.12
Figures