3087
Application of GluCEST imaging in mapping cingulate cortex of Nicotine dependence subjects at 7.0T1Perelman School of Medicine at The University of Pennsylvania, Philadelphia, PA, United States, 2University of Colorado School of Medicine, Aurora, CO, United States
Synopsis
Nicotine addiction is still one of the most preventable causes of chronic illness and premature death, and cessation regardless of age has positive effects on health outcomes (WHO, 2015). As such, there is growing interest in developing novel therapies and diagnostic aids to treat and monitor the nicotine addiction across the lifespan. Glutamate weighted chemical exchange saturation transfer (GluCEST) imaging was used to spatially map the glutamate levels of dorsal anterior cingulate cortex (dACC). We observed lower GluCEST contrast in females in the dACC regardless of smoking status. No significant difference in GluCEST was observed between the smokers and non-smokers.
Introduction
Glutamate is an excitatory neurotransmitter that plays an important role in regulating various cognitive and motor functions, and is also implicated in brain injury, substance abuse and aging1-3. Glutamate receptors have been a target in nicotine addiction research with a recent focus on metabotropic glutamate receptor-5 (mGluR5)4-8. Nicotine dependence remains a major worldwide public healthcare issue. Since it is one of the preventable causes of chronic illnesses and premature deaths, there is a growing interest to develop novel therapies as well as diagnostic aids to treat and monitor the nicotine addiction. Recently, we have demonstrated that glutamate can be measured with higher sensitivity and at higher resolution with glutamate chemical exchange saturation transfer (GluCEST) imaging technique at 7.0T9-12. The cingulate cortex is a part of limbic system involved in emotional processing, learning and memory and was also shown to have high concentration of nicotine binding sites by positron emission tomography (PET) experiments in primates and humans13. Therefore, we have applied GluCEST on the dorsal anterior cingulate cortex (dACC) to determine its potential as an imaging biomarker in nicotine addiction as well as in aging and gender differences.Methods
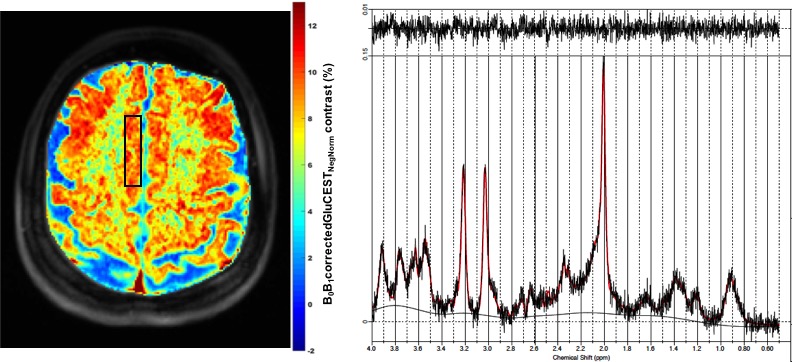
An equal number of female and male healthy human non-smokers (n=10; mean age 44.2±14.87 years) and smokers (n=10; mean age 39.7±8.37 years) completed the entire MRI scan protocol. All human studies were conducted under an approved University of Pennsylvania IRB protocol after obtaining written, informed consent from each subject. Imaging was performed on a whole body 7.0T scanner (MAGNETOM Terra, Siemens Healthcare, Erlangen, Germany) with a single volume coil transmit/32-channel receive proton head phased-array coil.GluCEST: The 2D GluCEST imaging parameters were: slice thickness=5mm, in-plane resolution=1x1mm2, matrix-size=240x168, GRE-readout TR/TE=3.3/1.48ms, band-width=690Hz/Px, duty-cycle=99, flip-angle=6°, averages=2, shotTR=6000ms, shots-per-slice=1, B1rms=3.06μT, pulse-duration=800ms (series of 100ms pulses). CEST images were acquired from ±1.8 to ±4.2ppm (relative to the water resonance set to 0ppm) with a step-size of 0.3ppm. To compute B0 maps for correction of B0 field inhomogeneity, water saturation shift referencing (WASSR) images14 were collected from ±0 to ±1.5ppm (step-size 0.15ppm) with B1rms=0.29μT and 200ms pulse duration. A relative B1 map was generated from three images obtained using square preparation pulses with flip-angles of 20°, 40° and 80°. The total acquisition time including CEST images, and B0 and B1 field maps was ~12 min. MP2RAGE which is a 2D multi-slice Siemens product sequence was used with the same spatial parameters as described for CEST to generate a T1 map which is used for segmentation of gray matter, white matter and CSF. GluCEST contrast maps for the imaging slice was generated using in-house MATLAB routines after correcting for B0 and B1 inhomogeneities. The B0 and B1-corrected GluCEST contrast map was then averaged for the rectangular region of interest drawn on dACC corresponding to spectroscopy voxel.
1HMRS: Single voxel spectroscopy was acquired on the GluCEST slice with the following parameters: voxel size: 40x10x5mm3, TR=3000ms, TE=23ms, number of averages for water reference/water suppressed=8/64, number of dummy scans=4. Spectroscopy analysis were done with the standard LCModel software15,16.
Results
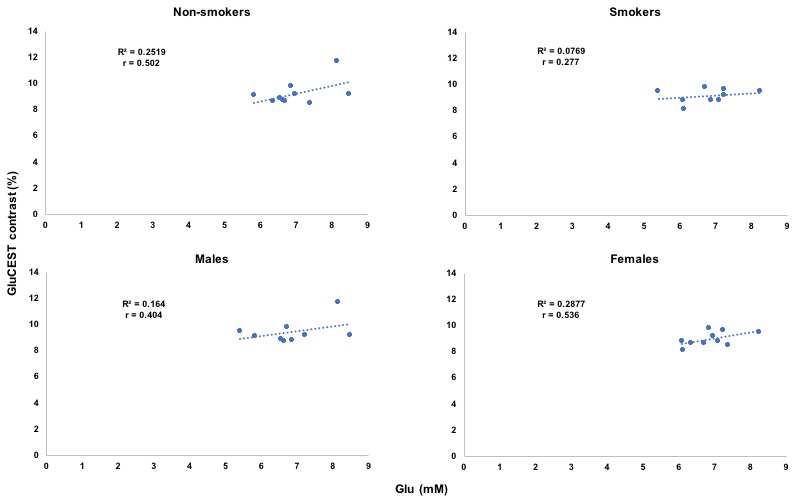
GluCEST contrast from dACC voxel and the spectroscopy results are shown in Figure 1 for all the non-smokers (n=10) and smokers (n=9; one dataset was not usable due to severe motion artifacts). Representative GluCEST map and the LCModel processed spectrum from one of the volunteers is shown in Figure 2. No significant difference in GluCEST contrast was found between smokers and non-smokers (p=0.38; one-tail t-test: two sample assuming unequal variance). But there was a trend towards lower GluCEST contrast between the gender when considered with no regards to smoking status (p=0.09). GluCEST contrast and the glutamate levels from the dACC voxel as shown in Figure 3, shows a positive correlation in both smokers (r=0.28; very weak) and non-smokers (r=0.5; moderate) and also in males (r=0.4; weak) and females (r=0.54; moderate) when smoking status was not taken into account. However, when GluCEST contrast and age was taken into account as shown in Figure 4, a negative correlation was observed in both smokers (r=0.52; moderate) and non-smokers (r=0.37; weak) as well in males (r=0.67; moderate) and females (r=0.1; very weak) regardless of smoking status.Discussion
While there was no significant difference observed in the GluCEST contrast between the smokers and non-smokers. This is in agreement with some of the previously reported spectroscopic studies where no changes/minimal change was reported in ACC17,18. However, a decreasing trend in GluCEST contrast was observed in females compared to males regardless of the smoking status. Interestingly, GluCEST contrast and age showed negative correlation in smokers which is in agreement with previous study18 but not in case of the non-smokers where our study shows negative correlation with the limited sample size we have.Conclusion
A decrease in GluCEST contrast was observed in females compared to males regardless of smoking status while no significant difference was observed in case of smokers vs non-smokers. GluCEST contrast and glutamate from 1HMRS obtained from dACC showed a positive correlation. GluCEST contrast from dACC and age showed a negative correlation irrespective of gender and smoking status.Acknowledgements
This project was supported by a pilot grant from The Thomas B. and Jeannette E. Laws McCabe Fund, National Institute of Biomedical Imaging and Bioengineering of the National Institute of Health through grant number p41-EB015893.References
1. Fonnum F, Storm-Mathisen J, Divac I. Biochemical evidence for glutamate as neurotransmitter in corticostriatal and corticothalamic fibers in rat brain. Neuroscience. 1981;6(5):863-873.
2. Fonnum F. Glutamate: A neurotransmitter in mammalian brain. J Neurochem. 1984;42(1):1-11.
3. Headley PM, Grillner S. Excitatory amino acids and synaptic transmission: The evidence for a physiological function. Trends Pharmacol Sci. 1990;11(5):205-211.
4. Tzschentke TM, Schmidt WJ. Glutamergic mechanism in addiction. Mol Psychiatry. 2003;8(4):373-382.
5. Nestler EJ. Is there a common molecular pathway for addiction? Nat Neurosci. 2005;8(11):1445-1449.
6. Jasinska AJ, Zorick T, Brody AL, et al. Dual role of nicotine in addiction and cognition: a review of neuroimaging studies done in humans. Neuropharmacology. 2014;84:111-122.
7. D’Souza MS. Glutamergic transmission in drug reward: implications for drug addiction. Front Neurosci. 2015;9:404.
8. Chiamulera C, Marzo CM, Balfour DJK. Metabotropic glutamate receptor 5 as a potential target for smoking cessation. Psychopharmacology (Berl). 2017;234(9-10):1357–1370.
9. Cai K, Haris M, Singh A, et al. Magnetic resonance imaging of glutamate. Nat Med. 2012;18(2):302-306.
10. Cai K, Singh A, Roalf DR, et al. Mapping glutamate in subcortical brain structures using high-resolution GluCEST MRI. NMR Biomed. 2013;26(10):1278-1284.
11. Davis KA, Nanga RP, Das S, et al. Glutamate imaging (GluCEST) lateralizes epileptic foci in non-lesional temporal lobe epilepsy. Sci Trans Med. 2015;7(309):309ra161.
12. Roalf DR, Nanga RPR, Rupert PE, et al. Glutamate imaging (GluCEST) reveals lower brain GluCEST contrast in patients on the psychosis spectrum. Mol Psychiatry. 2017;22(9):1298-1305.
13. Nyback H, Nordberg A, Langstorm B, et al. Attempts to visualize nicotinic receptors in the brain of monkey and man by positron emission tomography. Prog Brain Res. 1989;79:313-319.
14. Kim M, Gillen J, Landman BA, et al. Water Saturation Shift Referencing (WASSR) for Chemical Exchange Saturation Transfer (CEST) Experiments. Mag Reson Med. 2009;61(6):1441-1450.
15. Provencher SW. Estimation of metabolite concentrations from localized in vivo proton NMR spectra. Magn Reson Med. 1993;30(6):672-679.
16. Provencher SW. Automatic quantitation of localized in vivo 1H spectra with LC Model. NMR Biomed. 2001;14(4):260-264.
17. Gallinat J, Schubert F. Regional cerebral glutamate concentrations and chronic tobacco consumption. Pharmacopsychiatry. 2007;40(2):64-67.
18. Durazzo TC, Meyerhoff DJ, Mon A, et al. Chronic cigarette smoking in healthy middle-aged individuals is associated with decreased regional brain N-acetylaspartate and glutamate levels. Biol Psychiatry. 2016;79(6):481-488.
Figures