3082
Monitoring Inflammation-associated Metabolic Alterations by Deuterium MRS1Molecular Cardiology, Heinrich-Heine-University Düsseldorf, Düsseldorf, Germany
Synopsis
There is increasing evidence that inflammatory diseases go along with substantial changes in intermediatory metabolism. Also it is known that metabolic syndrome is characterized by chronic low-grade inflammation in multiple organs[1,2]. In this context, the metabolism of glucose is of major interest, since in particular in the initial phase of an inflammation infiltrating immune cells mainly rely on glycolysis to cover their energy demand.
The present study demonstrates that 2H MRI can be successfully used for monitoring metabolic alterations in an inflammatory environment with a switch to a more anaerobic glucose utilization in the initial phase of immune cell recruitment.
Introduction
There is increasing evidence that inflammatory diseases go along with substantial changes in intermediatory metabolism. On the other hand, it is known that metabolic syndrome in humans is characterized by chronic low-grade inflammation in multiple organs[1,2]. In order to further delineate the mechanisms by which inflammation and metabolism influence each other, non-invasive approaches to monitor their interaction are required. In this context, especially the metabolism of glucose is of major interest, since in particular in the initial phase of an inflammation infiltrating immune cells mainly rely on glycolysis to cover their energy demand. The clinical gold standard for glucose imaging is (18FDG)-PET. However, it requires radioactive tracers and is restricted to monitor glucose uptake, while the further metabolic fate of the ingested glucose remains unclear[3]. In contrast, deuterium (2H) metabolic imaging is a novel, non-invasive method to follow the metabolic pathways of deuterated substrates[4]. In the present study, we aimed to apply this approach for the monitoring of metabolic alterations associated with inflammatory diseases. For this, we employed an easy and reproducible murine inflammation model making use of an implanted matrigel plug doped with LPS[5] for an efficient recruitment of circulating immune cells into this artificial inflammatory focus.Methods
For this, mice received an injection of cold fluid matrigel (50 µl) mixed with 1 µg/µl LPS or PBS as control into the neck, which turns into a solid at body temperature forming a jellylike plug stable over a period of several weeks[5]. After 24 hours, infiltration of immune cells into the plug was confirmed by 1H/19F MR inflammation imaging[6] at 9.4T. In separate experiments, mice were placed with their neck on a 12×8 mm2 transmit/receive 2H surface coil (Bruker) inserted into a 30-mm 1H saw resonator. Fieldmap-based shimming (MAPSHIM) followed by manual adjustment was carried out to optimize the field homogeneity in the region of interest. 2H MR spectra were recorded over the entire matrigel region for determination of glucose metabolism (rectangular pulse, 60° flip angle; TR, 350 ms; spectral width, 15 ppm; data size, 300 points; averages, 360; acquisition time, 2 min). Exponential weighting resulting in a 10-Hz line broadening was applied and chemical shifts were referenced to the resonance frequency of water at 4.7 ppm. After acquisition of baseline spectra, mice received an ip bolus injection of 2 mg/g [6,6-2H2]glucose per body weight followed by continuous monitoring of deuterated metabolites over 60 min.Results and Discussion
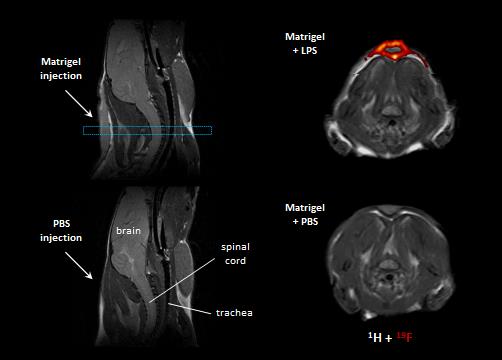
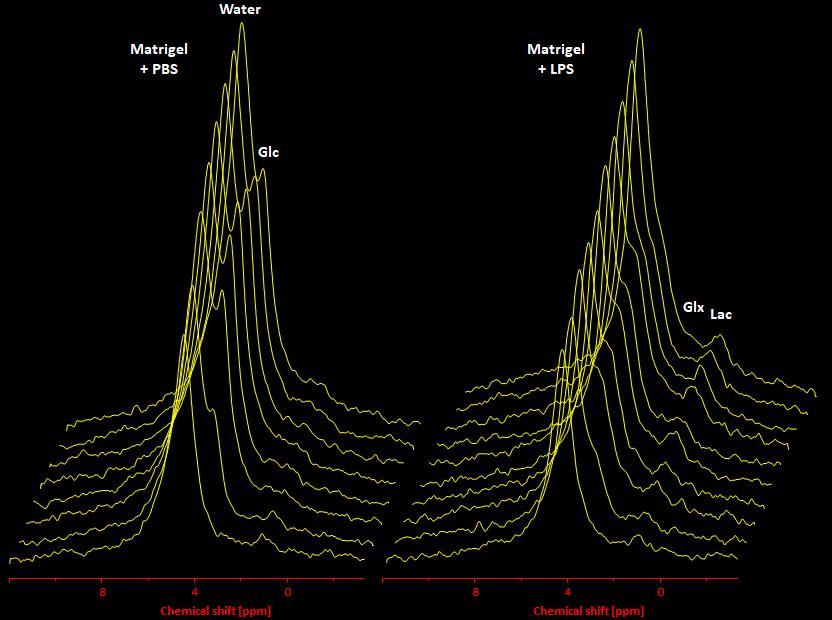
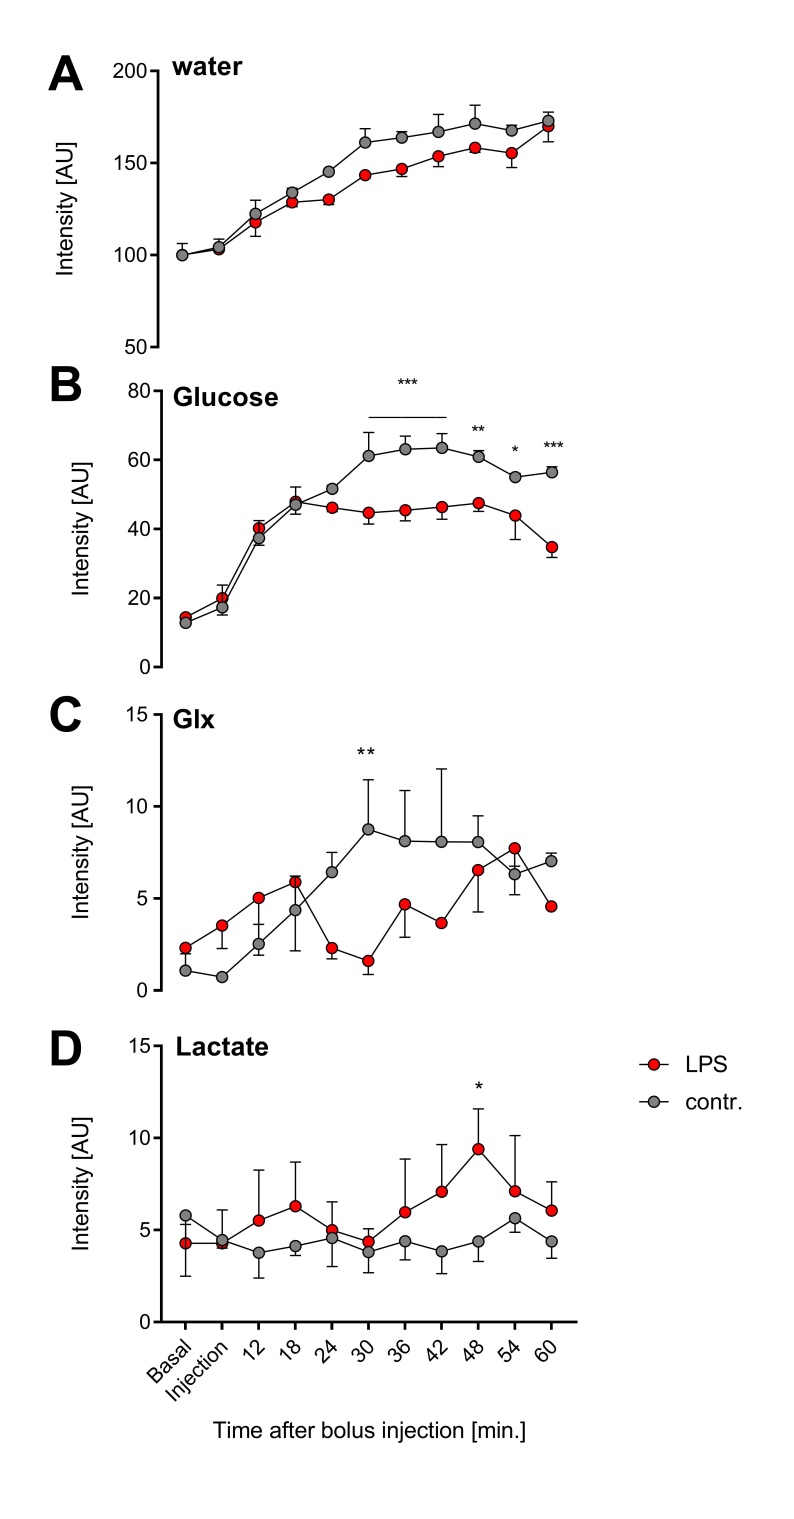
In a first step, we confirmed the presence of an inflammatory hot spot after implantation of the LPS-doped matrigel plug. For visualization of infiltrating immune cells, perfluorocarbon nanoemulsion (PFCs) were injected intravenously which are preferentially phagocytized by circulating monocytes and readily detected by 19F MRI. Figure 1 illustrates the anatomical localization of the matrigel plug in the neck region: The plug can clearly be recognized as a bright, oval structure which is missing in PBS-injected controls (Fig. 1 left top vs. bottom). Merging of 1H and 19F images revealed that PFCs are located predominantly in the border zone of the matrigel plug, while no 19F signal was found in control plugs doped with PBS (Fig. 1 left top vs. bottom). Next, we acquired 2H MR spectra to evaluate the turnover and metabolic fate of the deuterated glucose tracer in the inflammation area using a 2H surface coil directly placed upon the matrigel plug. Baseline spectra showed a prominent signal at 4.7 ppm caused by the natural abundant 2H (0.02%) in water[7] (Fig. 2, first trace). Bolus injection of [6,6-2H2]glucose gave rise to a fast increase of the corresponding 2H signal at 3.8 ppm and the subsequent appearance of the downstream metabolites Glx (i.e. glutamine + glutamate) and lactate at 2.4 and 1.3 ppm, respectively. The temporal development of 2H spectra over the entire observation period of 60 minutes is illustrated in Fig. 2 for mice with matrigel plugs doped with LPS (right) and PBS as control (left). As can be recognized, after bolus injection the glucose signal declined much quicker in the presence of LPS while concomitantly lactate levels were clearly elevated as compared to control conditions. Quantification of spectra for n=4 independent experiments (Fig. 3) confirmed these findings and furthermore revealed a lower incorporation of 2H label in both Glx and water under inflammatory conditions (Fig. 3A+C). These results clearly point to an enhanced utilization of glycolysis for energy production in the region of the inflammatory hot spot. Increased lactate levels and enhanced glucose consumption are classical indicators for a predominant anaerobic metabolism, which is further supported by lower signals for Glx and water. For incorporation of the 2H label in both compounds, it has to enter the aerobic pathway: Only when the label runs through the TCA cycle resulting in deuterated α-ketoglutarate, it may than either appear in Glx (when quitting the cycle) or water (when α-ketoglutarate passes to fumarate with split off of one 2H).Conclusion
Our results demonstrate that 2H MRI can be successfully used for monitoring metabolic alterations in an inflammatory environment with a switch to a more anaerobic glucose utilization in the initial phase of immune cell recruitment.Acknowledgements
No acknowledgement found.References
1. L.F. Van Gaal, I.L. Mertens, C.E. De Block Mechanisms linking obesity with cardiovascular disease Nature, 444 (2006), 875-880.
2. Saltiel AR, Olefsky JM. Inflammatory mechanisms linking obesity and metabolic disease. J Clin Invest. 2017;127:1–4.
3. Phelps, M, Huang, S, Hoffman, E Tomographic measurement of local cerebral glucose metabolic rate in humans with (F-18)2-fluoro-2-deoxy-D-glucose: validation of method. Ann Neurol 1979; 371–388.
4. De Feyter HM, Behar KL, Corbin ZA, Fulbright RK, Brown PB, McIntyre S, Nixon TW, Rothman DL, de Graaf RA. Deuterium metabolic imaging (DMI) for MRI-based 3D mapping of metabolism in vivo. Sci Adv. 2018;4:eaat7314.
5. Temme S, Jacoby C, Ding Z, Bönner F, Borg N, Schrader J, Flögel U. Technical advance: monitoring the trafficking of neutrophil granulocytes and monocytes during the course of tissue inflammation by noninvasive 19F MRI. J Leukoc Biol. 2014;95:689–697.
6. Flögel U, Ding Z, Hardung H, Jander S, Reichmann G, Jacoby C, Schubert R, Schrader J. In vivo monitoring of inflammation after cardiac and cerebral ischemia by fluorine magnetic resonance imaging. Circulation. 2008;118:140–148.
7. Siminovitch DJ. Solid-state NMR studies of proteins: the view from static 2H NMR experiments. Biochem Cell Biol 1998; 76: 411–422.
Figures