3081
Detection of Superparamagnetic Iron Oxide Nanoparticles using Statistical Analysis of a Block Design Modulated bSSFP (BDM-bSSFP) Acquisition1Athinoula A. Martinos Center for Biomedical Imaging, Charlestown, MA, United States, 2Harvard Medical School, Boston, MA, United States, 3Harvard-MIT Division of Health Sciences and Technology, Cambridge, MA, United States
Synopsis
The current standard methods for magnetic resonance imaging of superparamagnetic iron oxide nanoparticles (SPIONs) can be subject to “1/f” physiological fluctuations that can confound pre/post comparisons. We present a method to combine Block Design contrast Modulations and statistical analysis with the bSSFP sequence (BDM-bSSFP) in order to mitigate this effect. To do this, we leverage the frequency response of the bSSFP sequence to the local fields created by SPIONs. We show the ability of this method to detect SPIONs down to 10 μg/mL through simulations and in-vitro acquisitions.
Introduction
The current standard for magnetic resonance imaging (MRI) of superparamagnetic iron oxide nanoparticles (SPIONs) involves pre- and post-injection comparisons of T2- or T2*-weighted acquisitions acquired several minutes apart. However, this approach can be confounded by various “1/f” physiological fluctuations that occur between the pre- and post-injection images, induced by subject and respiratory motion.1,2 Others have developed entirely post-injection methods in order to generate positive contrast images from SPIONS,3-5 including using the balanced steady-state free precession (bSSFP) sequence.6-9 Recently, Zhu et al.10 demonstrated a method to externally modulate and selectively image the SPION contrast which allowed analysis of a “block design” acquisition similar to an fMRI analysis. The resulting statistical analysis potentially avoids the 1/f noise of long time-scale comparisons. In this study we achieve the advantages of block design modulation analysis by periodically shifting the unique frequency response of the Block Design Modulated bSSFP sequence (BDM-bSSFP). This selectively modulates the water signal near the SPIONs. We demonstrate the utility of this approach through both simulations and in-vitro experiments, and show detection of SPIONs down to 10μg/mL.Methods
Theory: The frequency shift $$$Δf(r)$$$ of a sphere of SPIONs can be approximated by:6$$∆f(r)= \frac{γ\cdot∆χ}{6π}(\frac{R}{r})^3(3\cos^{2}\theta-1)B_{0}$$
Figure 1A shows the B0 map for a r=5.3mm sphere and ∆χ=1ppm. Figure 1B shows the response of a bSSFP sequence to such a perturbation given a repetition time (TR) of 4.3ms and flip angle (FA)=5°. The result is the well-known relatively flat passband and a rapidly varying transition band. If maximal signal change is sought, water near SPIONs will experience local fields that would move the resonance into the transition band of the bSSFP frequency response (blue circle). Conversely, water far from the SPIONs will lie in the passband (red star) and experience little effect from shifting the sequence’s response. Thus, by modulating the bSSFP frequency response in a block design manner (by modulating the scanner Tx and Rx center frequency), we anticipate significant signal modulations in the water near SPIONs without significant modulation of the water signal from water far from the SPIONs (Figure 1C). These “block-design” modulations can be robustly detected through statistical analysis.
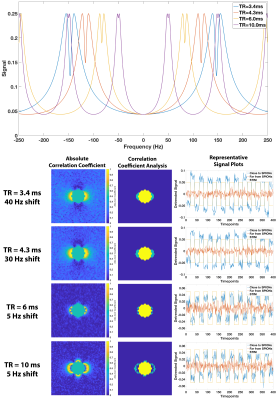
Simulations: We initially simulated the field distribution of an r=5.3mm sphere for four different TRs (3.4, 4.3, 6, and 10ms) with an isotropic resolution of 0.8mm and ∆χ=1ppm. First, we simulated the bSSFP signal for each voxel with FA=5°, and T1/T2=300/75ms. Then we took 20 timepoints at the center frequency (0Hz) followed by 20 timepoints at X Hz off-center and repeated this 10 times to generate 400 timepoints. X ranged from 5-50Hz, and gaussian noise was added to simulate experimental data. The correlation coefficient (R) at each voxel was calculated by detrending the signal, and then calculating R assuming a typical “on-off” response. Voxels with abs(R)>0.8 were considered “Activated”. Subsequently, we calculated R for ∆χ=0.25-40ppm for TR=4.3ms and 30 Hz shift off-center. We calculated percent activation for each ∆χ via the following: (# “Activated” voxels)/(# image voxels - # sphere voxels). For comparison, we also calculated the difference between the two frequencies (0 and X) using the mean of each frequency across all 200 timepoints. In this analysis, "Activated" voxels were those with difference>0.65*max(difference). All analysis was performed in MATLAB.
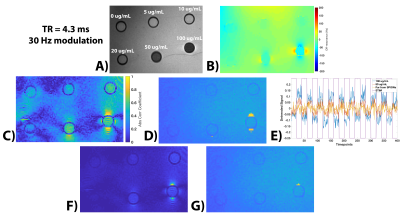
Experiments: Six concentrations (0, 5, 10, 20, 50, and 100µg/mL) of 10nm SPIONs (Ocean Nanotech) were put into r=5.3mm microcentrifuge tubes and placed into an agar phantom (Figure 4A). The phantom was placed into a Siemens 32-channel head coil with the microcentrifuge tubes orthogonal to B0 and all experiments were performed on a 3T Siemens Prisma scanner. We used the product bSSFP sequence that features an option to modulate (shift) the scanner base-frequency and thus the sequence frequency response by a specified value. For the four TRs listed above, we acquired a single 5mm sagittal slice at two different frequency offsets (0 and X Hz; 200 times at each frequency offset) with FA=5°. Then we reordered the data into blocks of 20 timepoints at 0 Hz and 20 timepoints at X Hz, for a total of 400 timepoints (10 on-off blocks) and calculated R.
Results
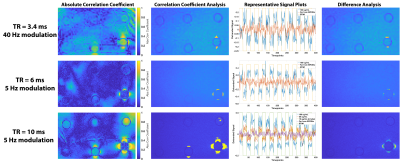
Figure 2 shows the R maps, a visualization of activated voxels, and representative signal blocks from a voxel far away and close to the SPIONs for different TRs and different frequency modulations. All four cases presented here seem to indicate robust activation near the SPIONs. Unsurprisingly, Figure 3 shows that the activation strength increases with increasing magnetic susceptibility (i.e., SPIONs concentration). Additionally, the correlation coefficient analysis provided more robust detection of the SPIONs location than a simple difference image analysis. Figure 4 shows the experimental results for TR=4.3ms and 30Hz modulation, with detection of 50 and 100µg/mL tubes clearly visible. Furthermore, the correlation coefficient analysis (C/D) yielded a greater activation volume than the difference analysis (F/G). Figure 5 shows similar results for the other acquired TRs, which is in agreement with simulations.Conclusion
We present a new approach to positive contrast imaging of SPIONs using a block design modulation of a low flip angle bSSFP acquisition. Future analysis will focus on optimizing the combination of flip angle, TR, and frequency modulation that will provide the most sensitivity to SPION detection.Acknowledgements
NIH F32EB027571.References
1. Weisskoff RM, Baker J, Belliveau J, et al. Power Spectrum Analysis of Functionally-Weighted MR Data: What’s in the Noise? In: Proc. Intl. Soc. Mag. Reson. Med. 1 (1993) 0007.
2. Aguirre GK, Zarahn E, D’Esposito M. Empirical Analyses of BOLD fMRI Statistics. Neuroimage 1997;5:199–212.
3. Cunningham CH, Arai T, Yang PC, Mcconnell M V, Pauly JM, Conolly SM. Positive Contrast Magnetic Resonance Imaging of Cells Labeled with Magnetic Nanoparticles. Magn. Reson. Med. 2005;53:999–1005.
4. Zhao Q, Langley J, Lee S, Liu W. Positive contrast technique for the detection and quantification of superparamagnetic iron oxide nanoparticles in MRI. NMR Biomed. 2011;24:464–472.
5. Harris SS, Mao H, Hu XP. Adiabatic Pulse Preparation for Imaging Iron Oxide Nanoparticles. Magn. Reson. Med. 2012;67:1133–1137.
6. Çukur T, Yamada M, Overall WR, Yang P, Nishimura DG. Positive Contrast with Alternating Repetition Time SSFP (PARTS): A Fast Imaging Technique for SPIO-Labeled Cells. Magn. Reson. Med. 2010;63:427–437.
7. Ingle RR, Çukur T, Nishimura DG. The Central Signal Singularity Phenomenon in Balanced SSFP and Its Application to Positive-Contrast Imaging. Magn. Reson. Med. 2012;67:1673–1683.
8. Mascheri N, Dharmakumar R, Zhang Z, Paunesku T. Fast low-angle positive contrast steady-state free precession imaging of USPIO-labeled macrophages: theory and in vitro experiment. Magn. Reson. Imaging 2009;27:961–969.
9. Heyn C, Bowen C V, Rutt BK, Foster PJ. Detection Threshold of Single SPIO-Labeled Cells With FIESTA. Magn. Reson. Med. 2005;53:312–320.
10. Zhu B, Witzel T, Jiang S, Huang SY, Rosen BR, Wald LL. Selective magnetic resonance imaging of magnetic nanoparticles by acoustically induced rotary saturation. Magn. Reson. Med. 2016;75:97–106.
Figures


